| Param | Original file | Final file |
|---|---|---|
| Filename | modeM0/AS1A05_010T02_9000002556_17297cztM0_level2.evt | modeM0/AS1A05_010T02_9000002556_17297cztM0_level2_quad_clean.evt |
| Size (bytes) | 521,392,320 | 105,917,760 |
| Size | 497.2 MB | 101.0 MB |
| Events in quadrant A | 3,393,986 | 722,164 |
| Events in quadrant B | 3,243,106 | 732,107 |
| Events in quadrant C | 3,156,873 | 675,691 |
| Events in quadrant D | 5,560,617 | 629,602 |
| Mode M0 | |||
|---|---|---|---|
| Quadrant | BADHDUFLAG | Total packets | Discarded packets |
| A | 0 | 14228 | 1 |
| B | 0 | 13630 | 1 |
| C | 0 | 13432 | 1 |
| D | 0 | 20825 | 1 |
| Mode M9 | |||
|---|---|---|---|
| Quadrant | BADHDUFLAG | Total packets | Discarded packets |
| A | 0 | 13 | 0 |
| B | 0 | 13 | 0 |
| C | 0 | 13 | 0 |
| D | 0 | 13 | 0 |
| Mode SS | |||
|---|---|---|---|
| Quadrant | BADHDUFLAG | Total packets | Discarded packets |
| A | 0 | 130 | 0 |
| B | 0 | 130 | 0 |
| C | 0 | 130 | 0 |
| D | 0 | 130 | 0 |
| Quadrant | Total seconds | Saturated seconds | Saturation percentage |
|---|---|---|---|
| A | 6423 | 149 | 2.319788% |
| B | 6424 | 115 | 1.790162% |
| C | 6424 | 121 | 1.883562% |
| D | 6424 | 591 | 9.199875% |
Noise dominated data is calculated using 1-second bins in cleaned event files. If a bin has >2000 counts, and if more than 50% of those come from <1% of pixels, then it is considered to be noise-dominated and hence unusable.
| Quadrant | # 1 sec bins | Bins with >0 counts | Bins with >2000 counts | High rate bins dominated by noise | Noise dominated (total time) | Noise dominated (detector-on time) | Marked lightcurve |
|---|---|---|---|---|---|---|---|
| A | 7683 | 6424 | 38 | 38 | 0.49% | 0.59% |  |
| B | 7684 | 6425 | 0 | 0 | 0.00% | 0.00% | 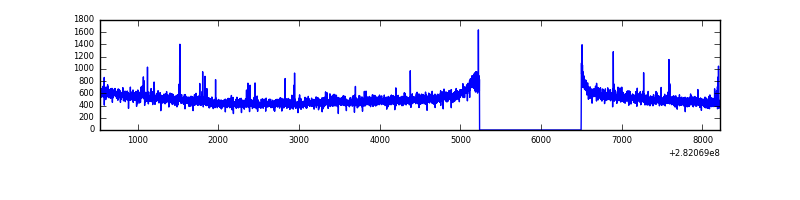 |
| C | 7684 | 6425 | 0 | 0 | 0.00% | 0.00% | 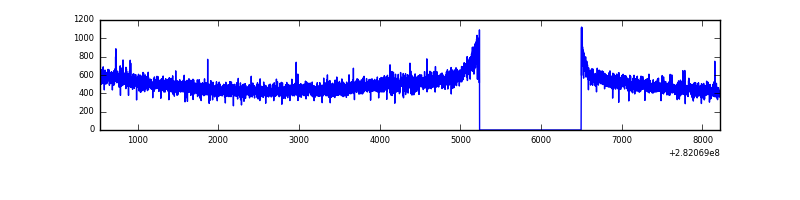 |
| D | 7684 | 6425 | 544 | 544 | 7.08% | 8.47% | 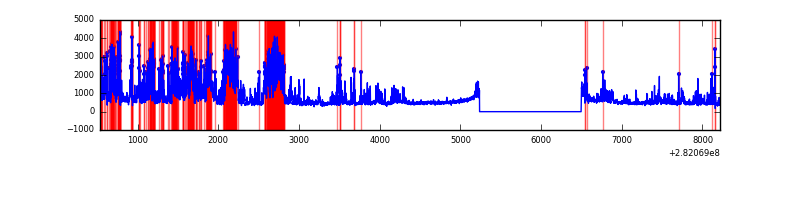 |
Top three noisy pixels from each quadrant. If the there are fewer than three noisy pixels in the level2.evt file, extra rows are filled as -1
| Pixel properties | Quadrant properties | ||||||
|---|---|---|---|---|---|---|---|
| Quadrant | DetID | PixID | Counts | Sigma | Mean | Median | Sigma |
| A | 4 | 2 | 239110 | 1447.66 | 821 | 807 | 164.6 |
| A | 0 | 226 | 7404 | 40.08 | 821 | 807 | 164.6 |
| A | 3 | 137 | 5984 | 31.45 | 821 | 807 | 164.6 |
| B | 12 | 111 | 18164 | 111.73 | 820 | 802 | 155.4 |
| B | 0 | 229 | 16066 | 98.22 | 820 | 802 | 155.4 |
| B | 11 | 111 | 15618 | 95.34 | 820 | 802 | 155.4 |
| C | 14 | 238 | 120277 | 671.65 | 768 | 775 | 177.9 |
| C | 3 | 233 | 36949 | 203.31 | 768 | 775 | 177.9 |
| C | 0 | 79 | 5708 | 27.73 | 768 | 775 | 177.9 |
| D | 13 | 232 | 2249843 | 12251.0 | 756 | 736 | 183.6 |
| D | 10 | 70 | 191726 | 1040.33 | 756 | 736 | 183.6 |
| D | 5 | 222 | 119875 | 648.96 | 756 | 736 | 183.6 |
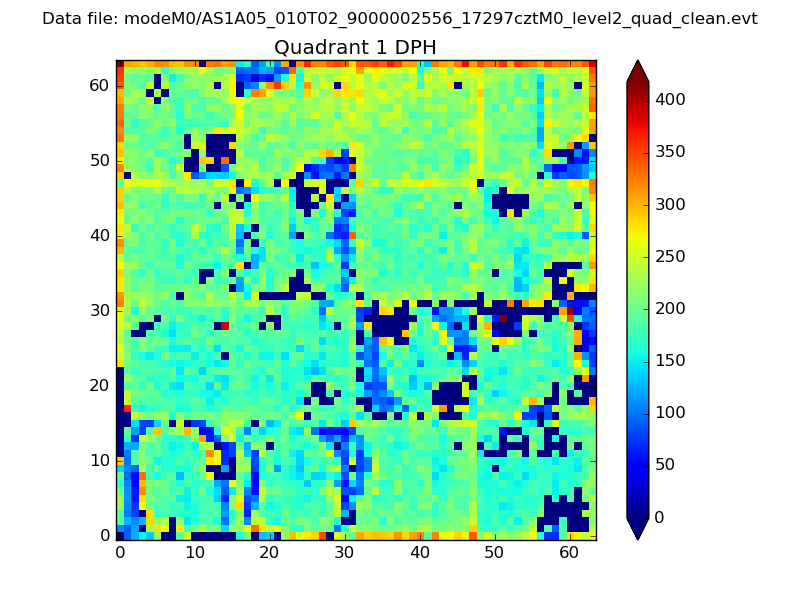
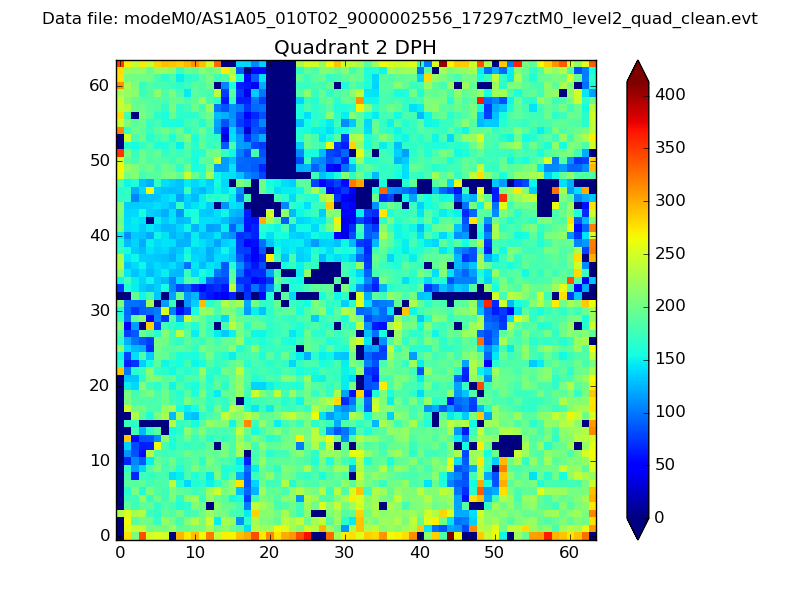
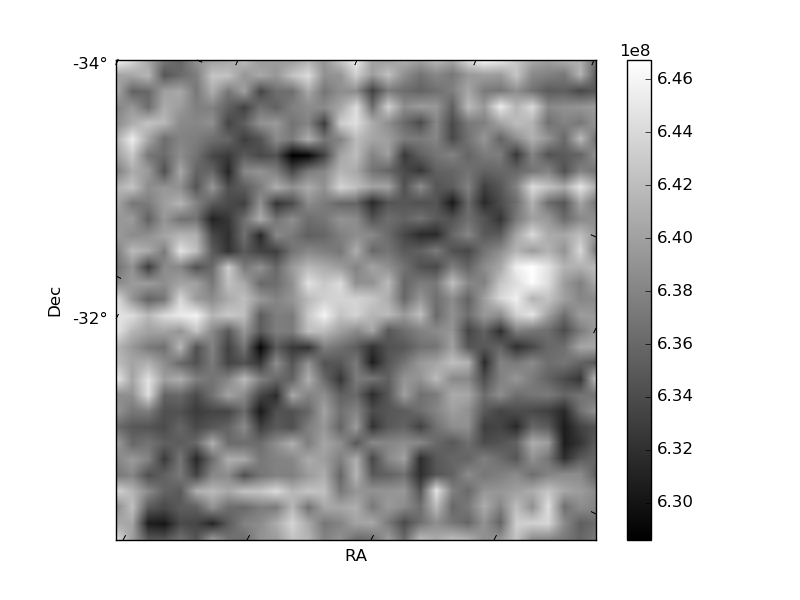
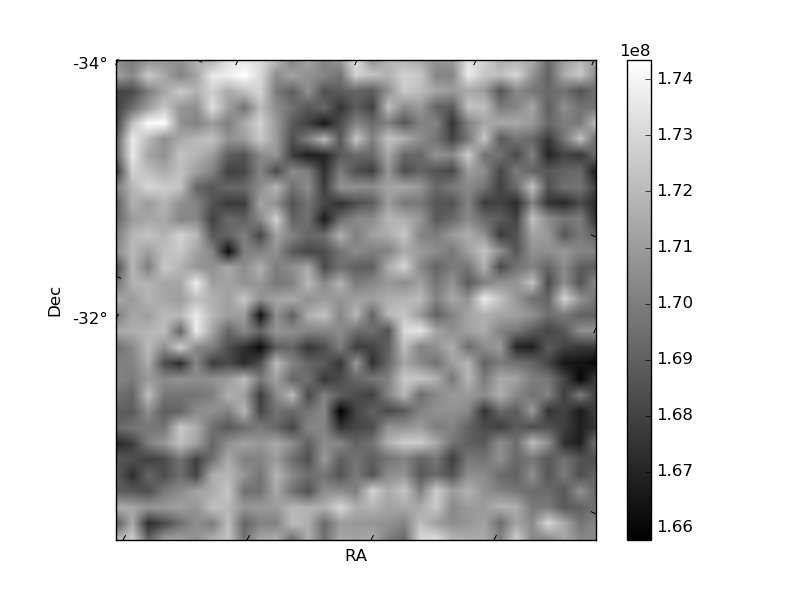
Histogram calculated using DETX and DETY for each event in the final _common_clean file
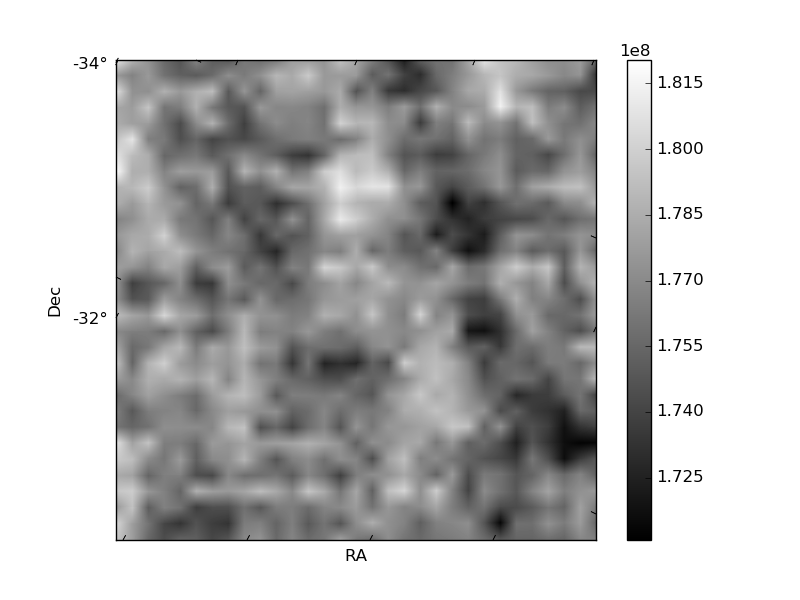
| Quadrant A | 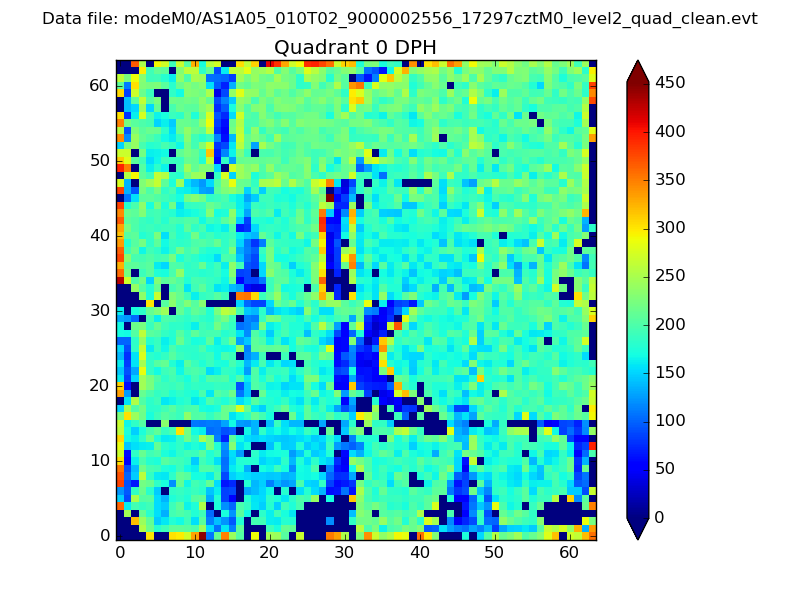 |
 |
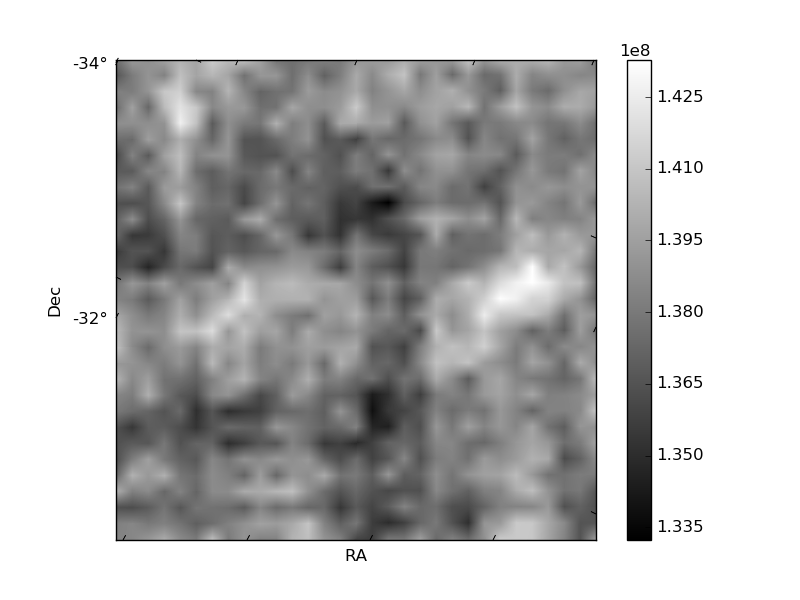
Quadrant B |
|---|---|---|---|
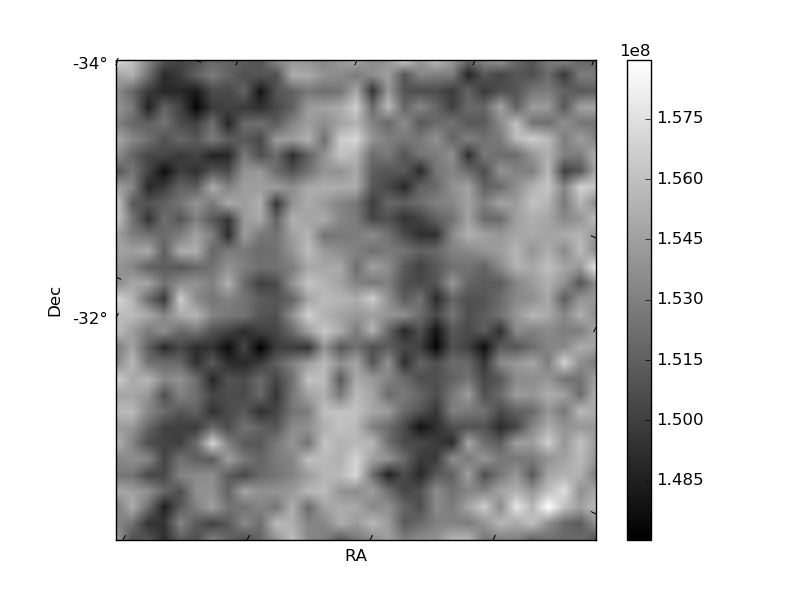
| Quadrant D | 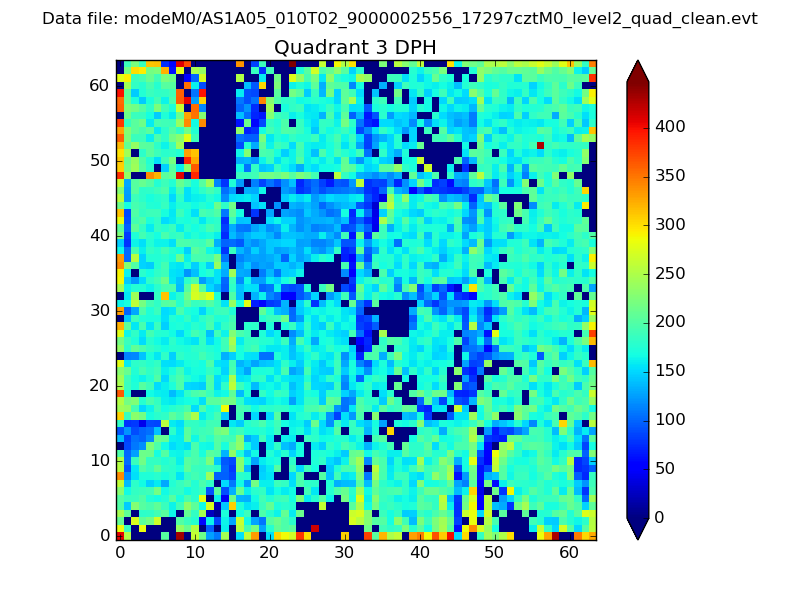 |
 |
Quadrant C |
| Plot type | Count rate plots | Images |
|---|---|---|
| Comparison with Poisson distribution Blue bars denote a histogram of data divided into 1 sec bins. Red curve is a Poisson curve with rate = median count rate of data. |
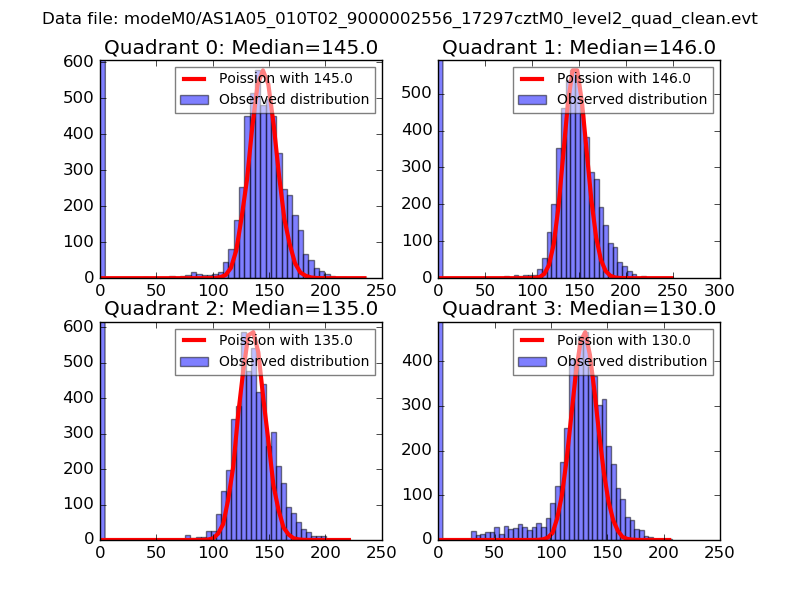 |
 |
| Quadrant-wise count rates Data is divided into 100 sec bins |
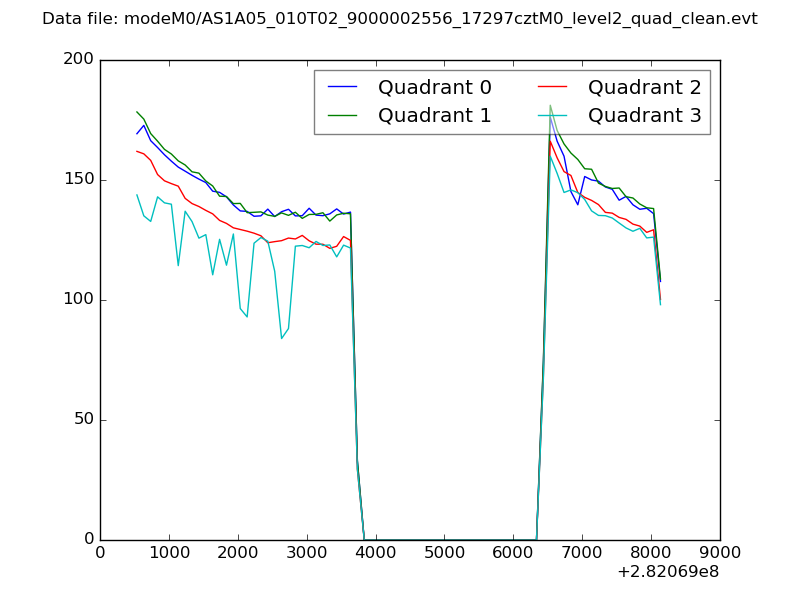 |
|
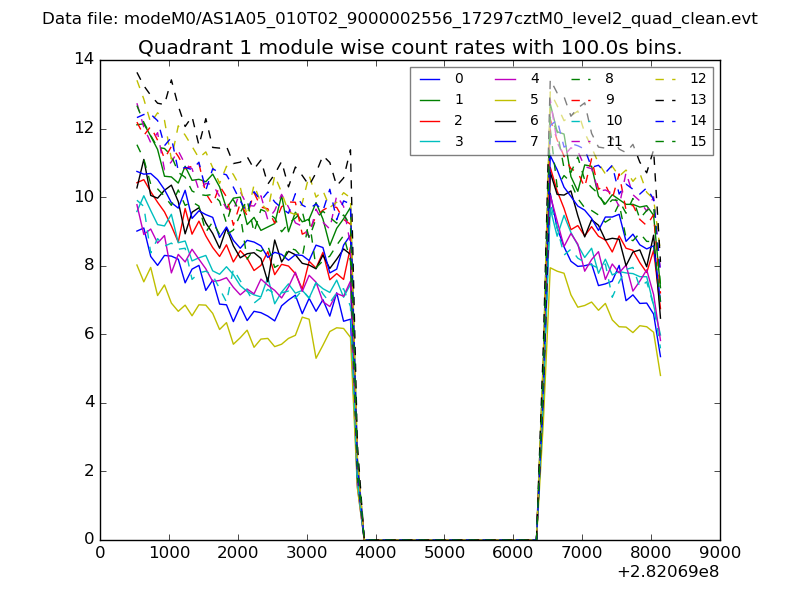
| Module-wise count rates for Quadrant A Data is divided into 100 sec bins |
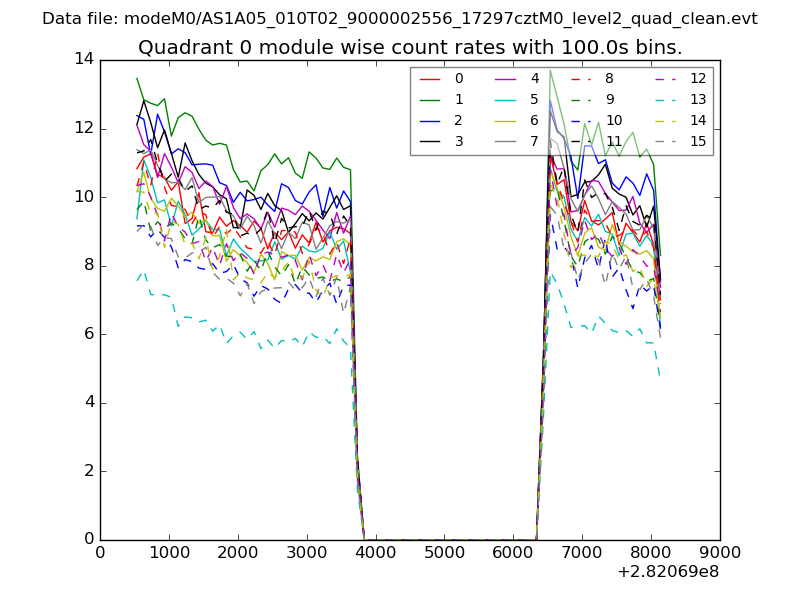 |
 |
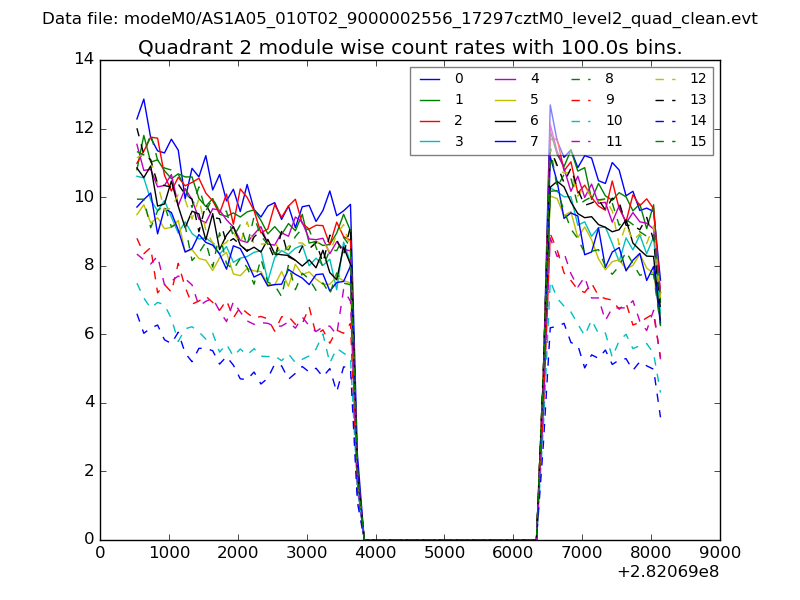
| Module-wise count rates for Quadrant B Data is divided into 100 sec bins |
 |
 |
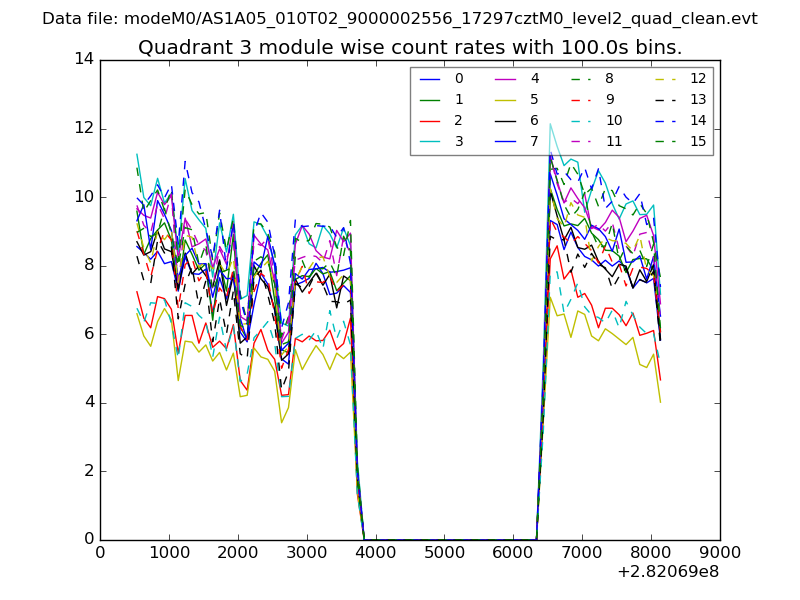
| Module-wise count rates for Quadrant C Data is divided into 100 sec bins |
 |
 |
| Module-wise count rates for Quadrant D Data is divided into 100 sec bins |
 |
 |
| Parameter | Plot |
|---|---|
| CZT HV Monitor |  |
| D_VDD | 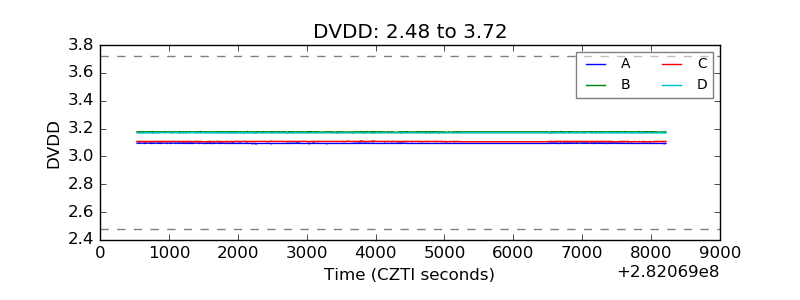 |
| Temperature 1 | 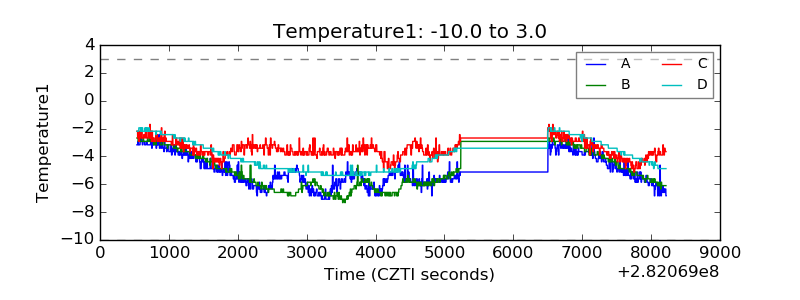 |
| Veto HV Monitor | 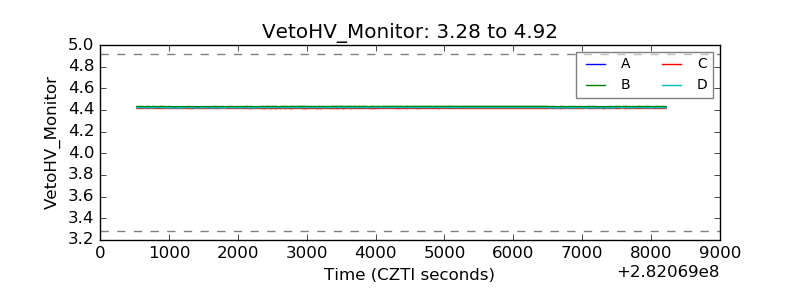 |
| Veto LLD | 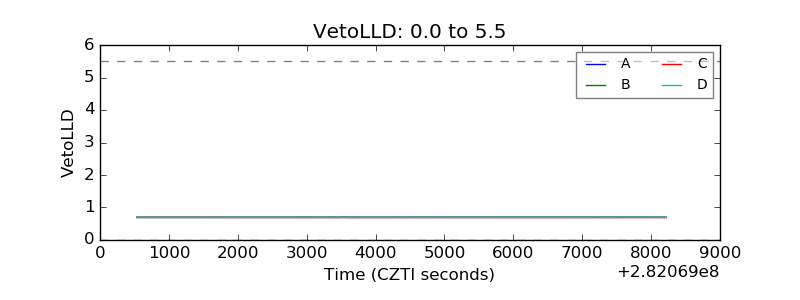 |
| Alpha Counter | 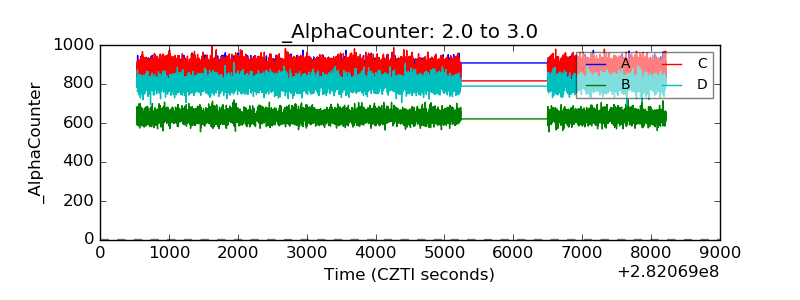 |
| _CPM_Rate | 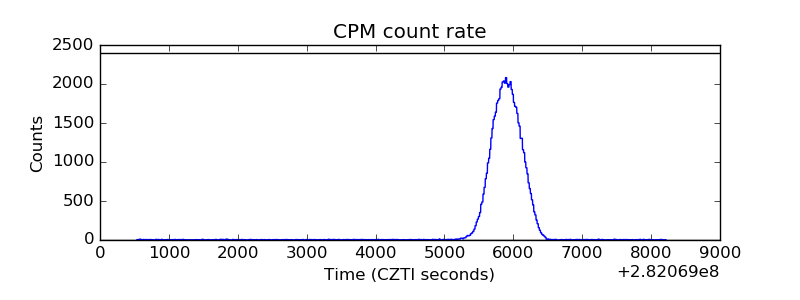 |
| CZT Counter | 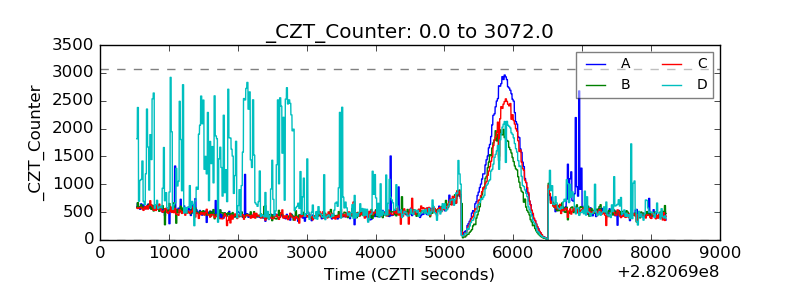 |
| +2.5 Volts monitor |  |
| +5 Volts monitor |  |
| _ROLL_ROT | 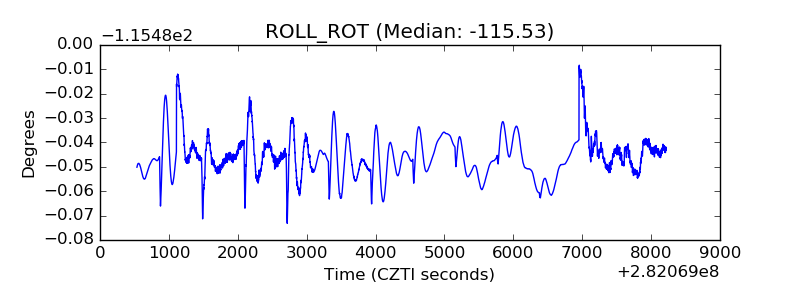 |
| _Roll_DEC | 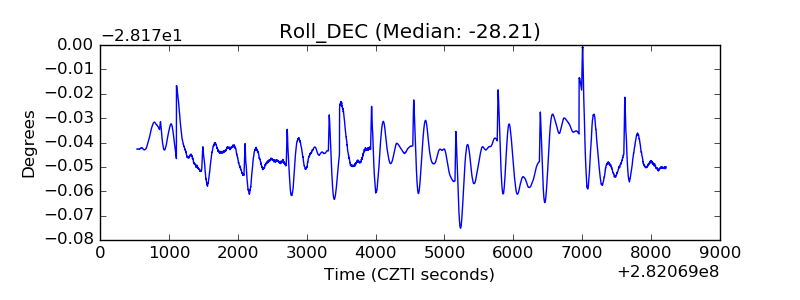 |
| _Roll_RA | 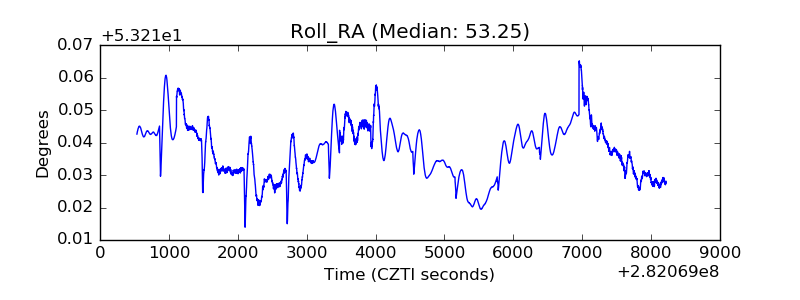 |
| Veto Counter | 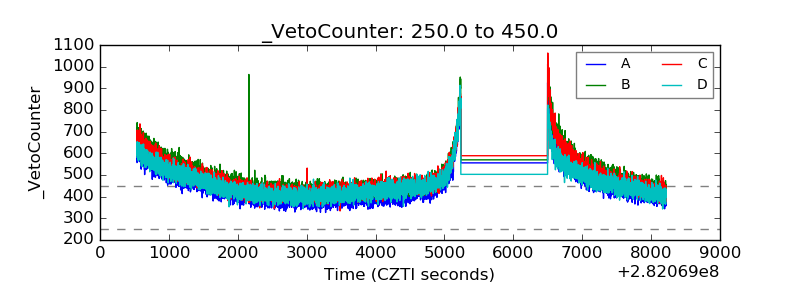 |