| Param | Original file | Final file |
|---|---|---|
| Filename | modeM0/AS1A05_010T02_9000002556_17298cztM0_level2.evt | modeM0/AS1A05_010T02_9000002556_17298cztM0_level2_quad_clean.evt |
| Size (bytes) | 494,988,480 | 98,222,400 |
| Size | 472.1 MB | 93.7 MB |
| Events in quadrant A | 3,342,850 | 647,111 |
| Events in quadrant B | 3,252,535 | 659,352 |
| Events in quadrant C | 3,174,932 | 610,121 |
| Events in quadrant D | 4,773,495 | 599,151 |
| Mode M0 | |||
|---|---|---|---|
| Quadrant | BADHDUFLAG | Total packets | Discarded packets |
| A | 0 | 14349 | 2 |
| B | 0 | 13912 | 2 |
| C | 0 | 13709 | 2 |
| D | 0 | 18679 | 2 |
| Mode M9 | |||
|---|---|---|---|
| Quadrant | BADHDUFLAG | Total packets | Discarded packets |
| A | 0 | 14 | 0 |
| B | 0 | 15 | 0 |
| C | 0 | 15 | 0 |
| D | 0 | 15 | 0 |
| Mode SS | |||
|---|---|---|---|
| Quadrant | BADHDUFLAG | Total packets | Discarded packets |
| A | 0 | 134 | 0 |
| B | 0 | 134 | 0 |
| C | 0 | 134 | 0 |
| D | 0 | 134 | 0 |
| Quadrant | Total seconds | Saturated seconds | Saturation percentage |
|---|---|---|---|
| A | 6580 | 100 | 1.519757% |
| B | 6580 | 76 | 1.155015% |
| C | 6580 | 66 | 1.003040% |
| D | 6580 | 536 | 8.145897% |
Noise dominated data is calculated using 1-second bins in cleaned event files. If a bin has >2000 counts, and if more than 50% of those come from <1% of pixels, then it is considered to be noise-dominated and hence unusable.
| Quadrant | # 1 sec bins | Bins with >0 counts | Bins with >2000 counts | High rate bins dominated by noise | Noise dominated (total time) | Noise dominated (detector-on time) | Marked lightcurve |
|---|---|---|---|---|---|---|---|
| A | 7820 | 6581 | 32 | 32 | 0.41% | 0.49% | 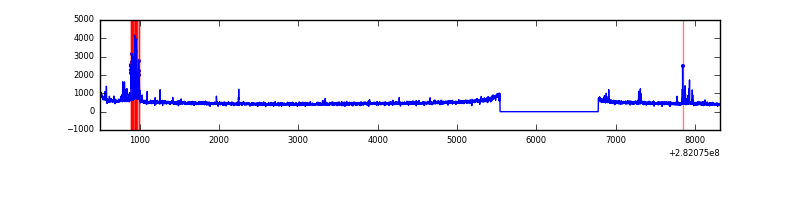 |
| B | 7820 | 6581 | 2 | 2 | 0.03% | 0.03% | 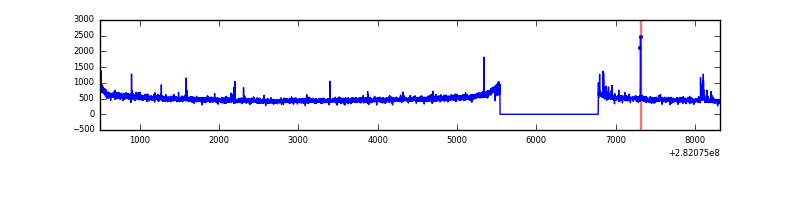 |
| C | 7820 | 6581 | 0 | 0 | 0.00% | 0.00% | 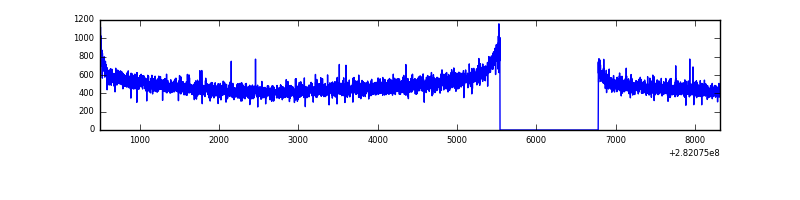 |
| D | 7820 | 6581 | 385 | 385 | 4.92% | 5.85% | 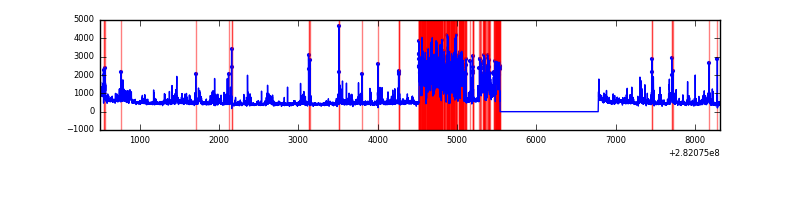 |
Top three noisy pixels from each quadrant. If the there are fewer than three noisy pixels in the level2.evt file, extra rows are filled as -1
| Pixel properties | Quadrant properties | ||||||
|---|---|---|---|---|---|---|---|
| Quadrant | DetID | PixID | Counts | Sigma | Mean | Median | Sigma |
| A | 4 | 2 | 168362 | 1019.33 | 818 | 803 | 164.4 |
| A | 14 | 235 | 32283 | 191.51 | 818 | 803 | 164.4 |
| A | 0 | 226 | 7278 | 39.39 | 818 | 803 | 164.4 |
| B | 0 | 230 | 22171 | 136.63 | 821 | 803 | 156.4 |
| B | 12 | 111 | 18354 | 112.23 | 821 | 803 | 156.4 |
| B | 11 | 111 | 15799 | 95.89 | 821 | 803 | 156.4 |
| C | 14 | 238 | 119848 | 659.49 | 774 | 778 | 180.5 |
| C | 3 | 233 | 31149 | 168.22 | 774 | 778 | 180.5 |
| C | 13 | 61 | 5557 | 26.47 | 774 | 778 | 180.5 |
| D | 13 | 189 | 1234480 | 6797.69 | 752 | 732 | 181.5 |
| D | 13 | 232 | 170741 | 936.71 | 752 | 732 | 181.5 |
| D | 11 | 176 | 139966 | 767.15 | 752 | 732 | 181.5 |
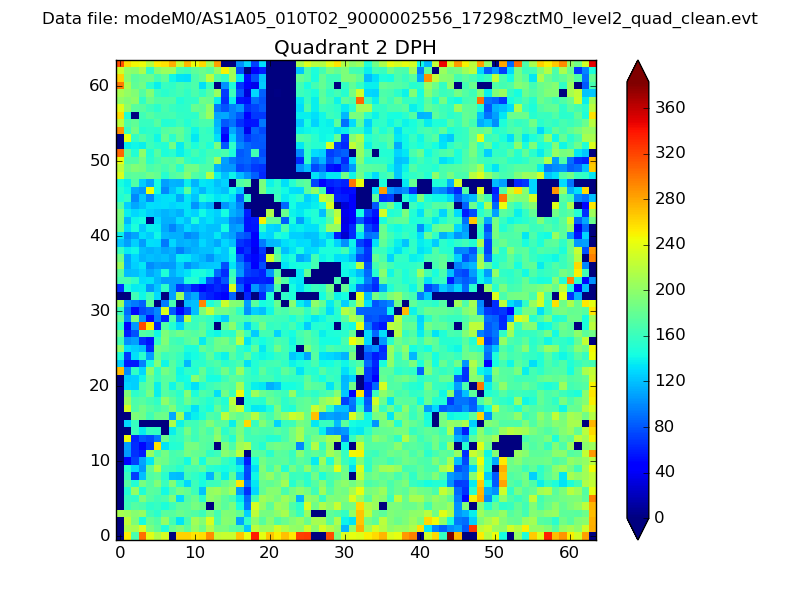
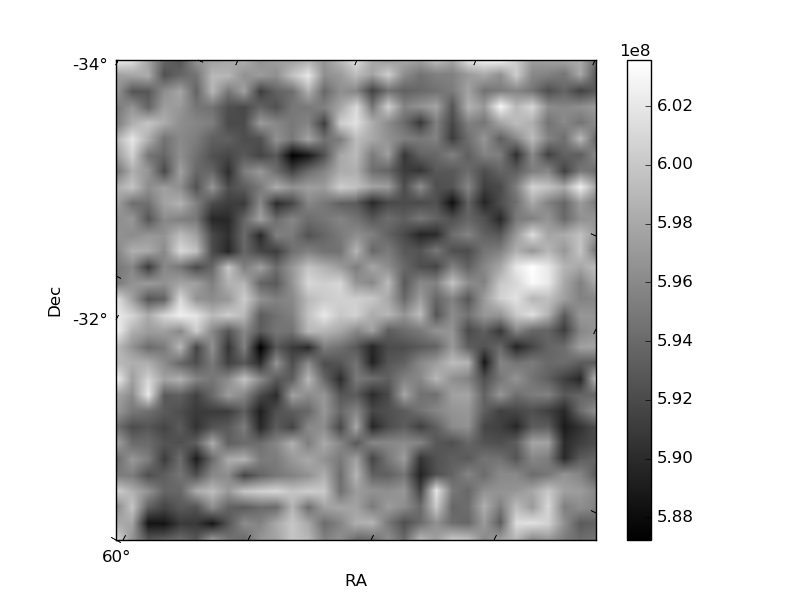
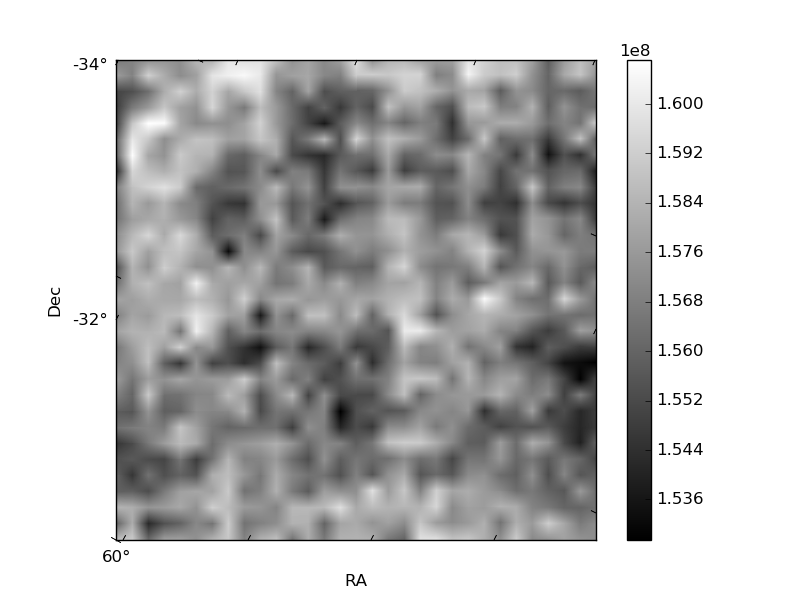
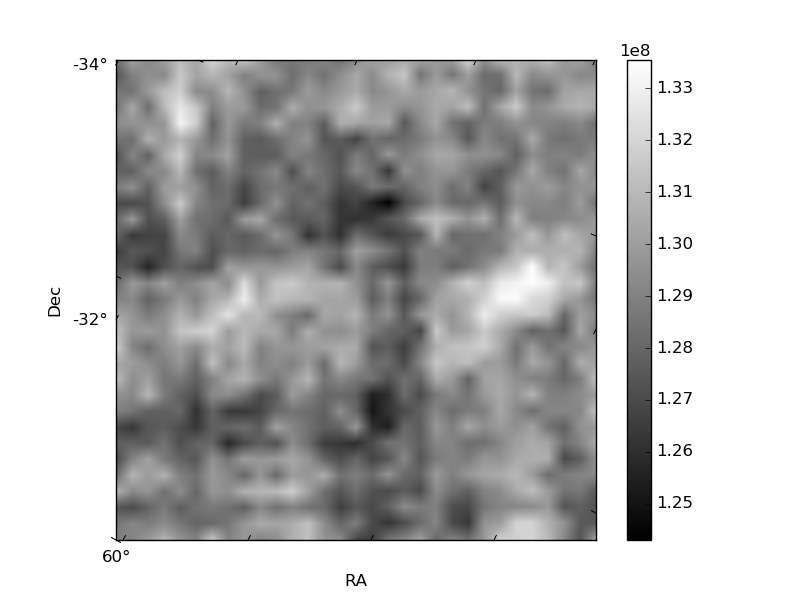
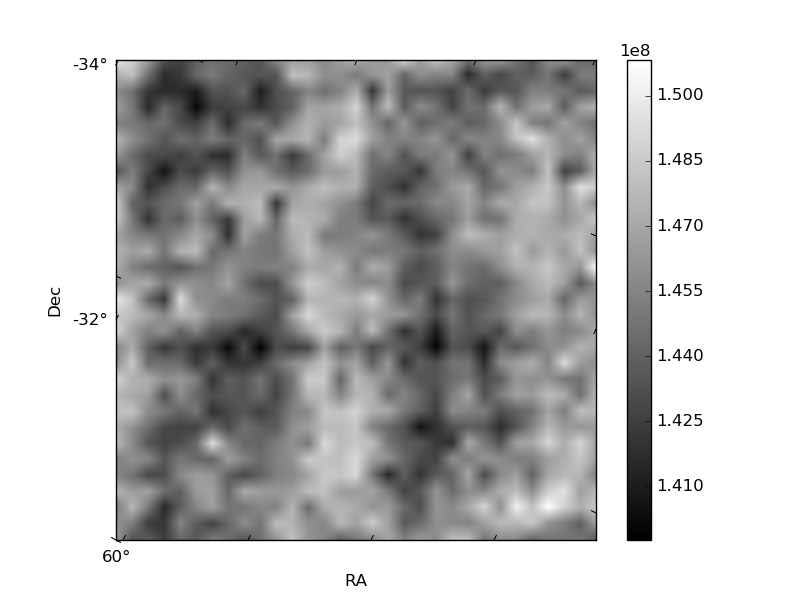
Histogram calculated using DETX and DETY for each event in the final _common_clean file
| Quadrant A | 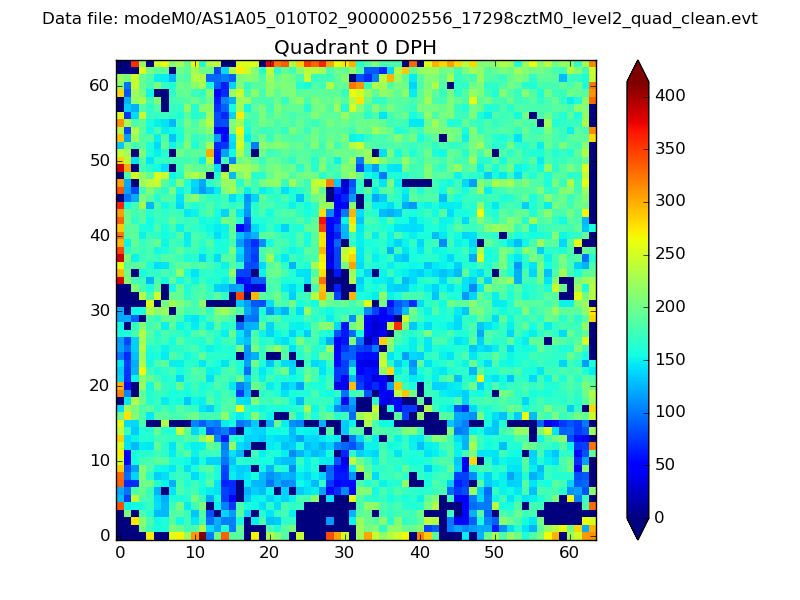 |
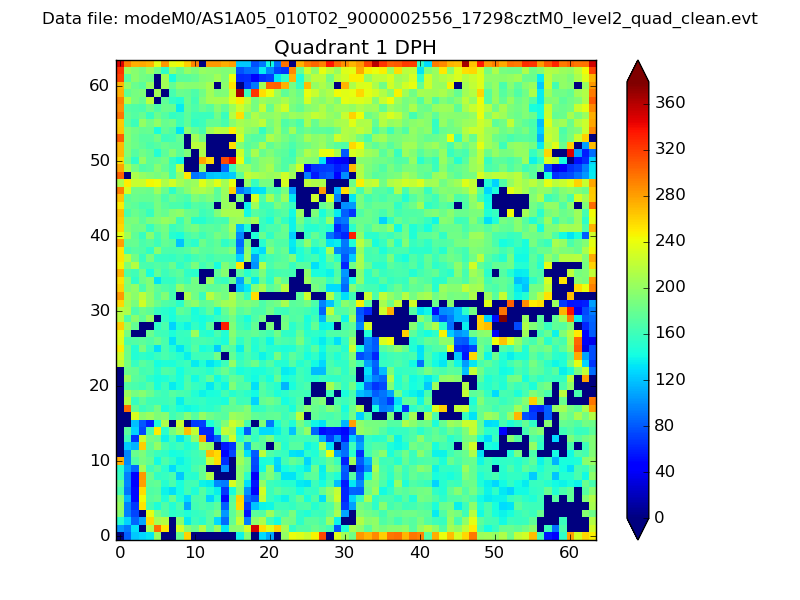 |
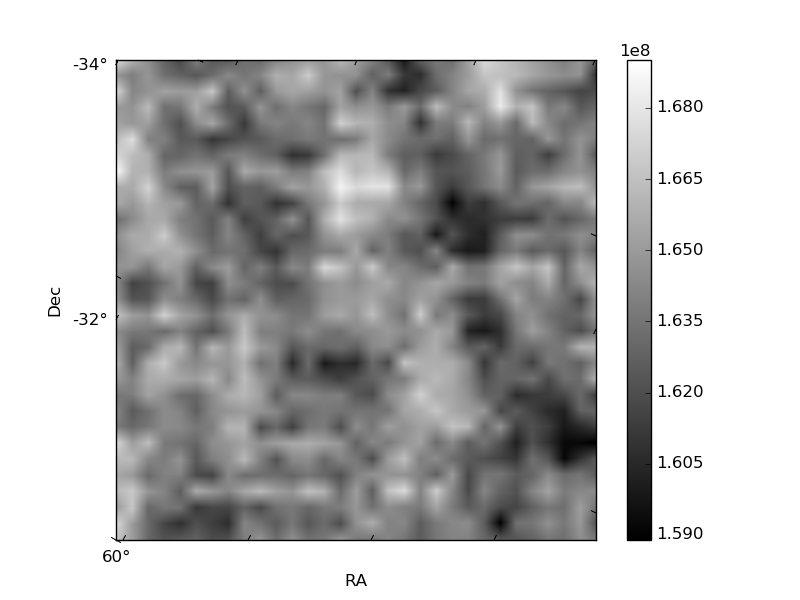
Quadrant B |
|---|---|---|---|
| Quadrant D | 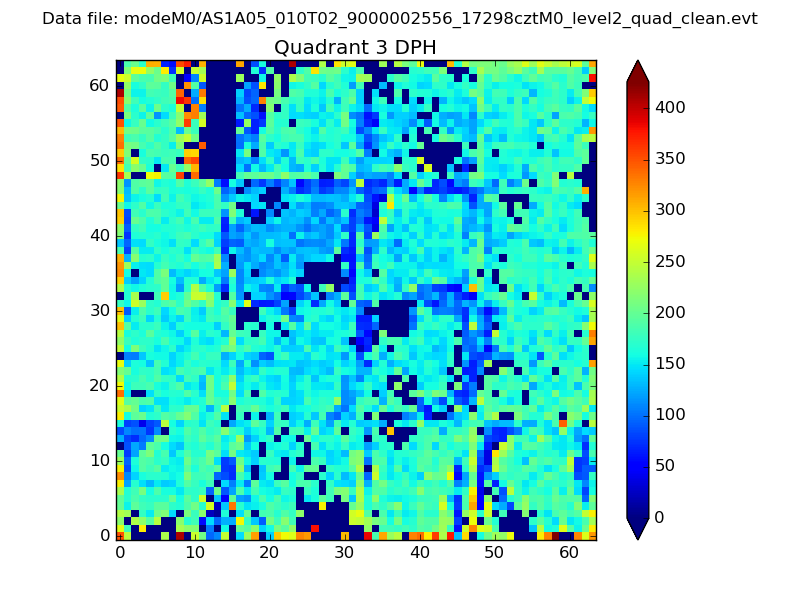 |
 |
Quadrant C |
| Plot type | Count rate plots | Images |
|---|---|---|
| Comparison with Poisson distribution Blue bars denote a histogram of data divided into 1 sec bins. Red curve is a Poisson curve with rate = median count rate of data. |
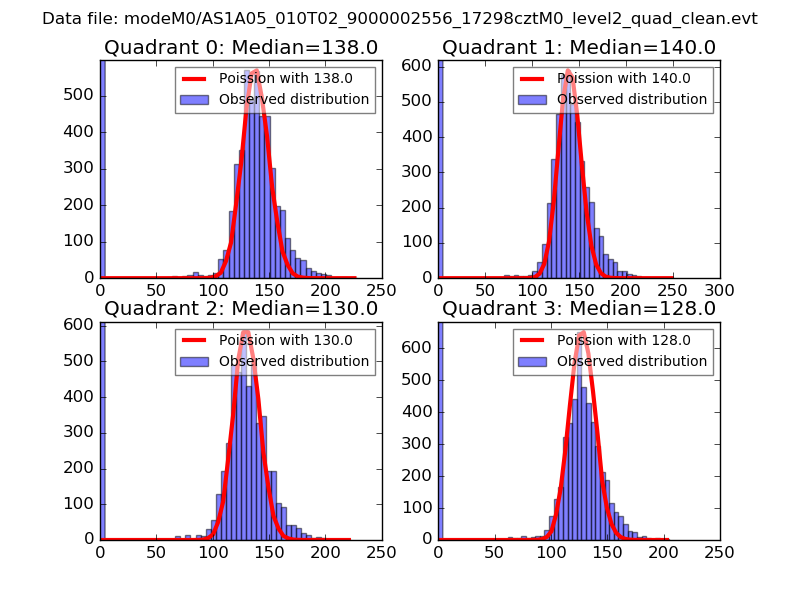 |
 |
| Quadrant-wise count rates Data is divided into 100 sec bins |
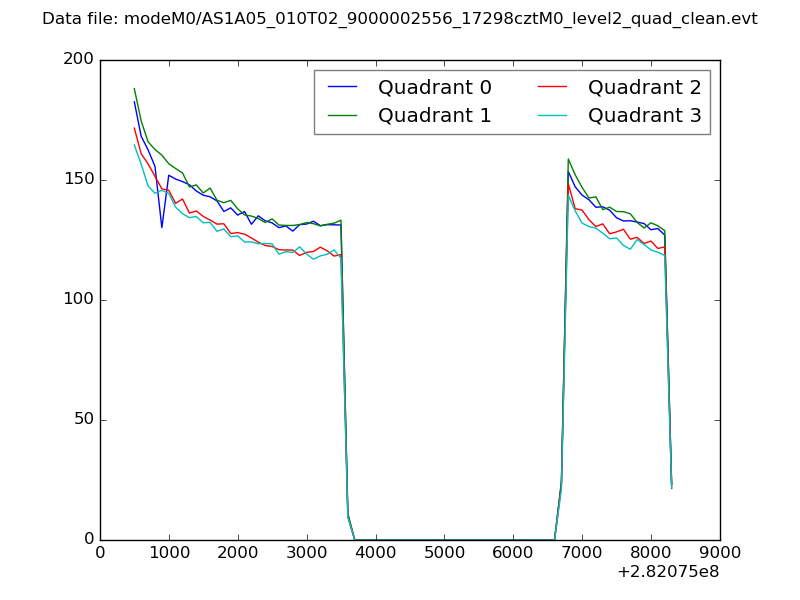 |
|
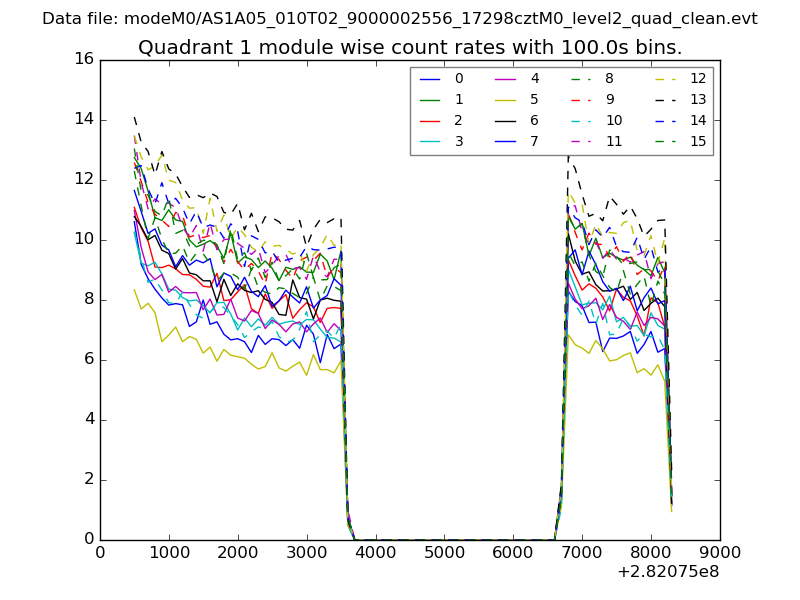
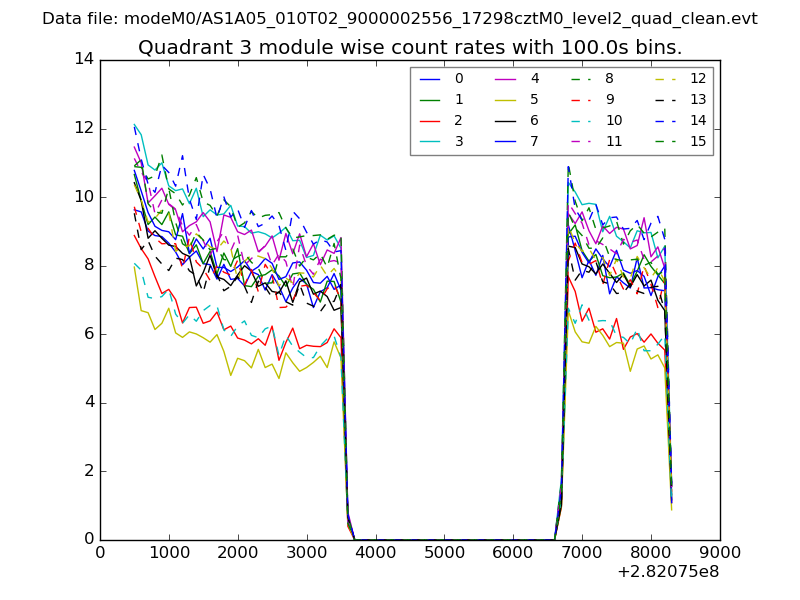
| Module-wise count rates for Quadrant A Data is divided into 100 sec bins |
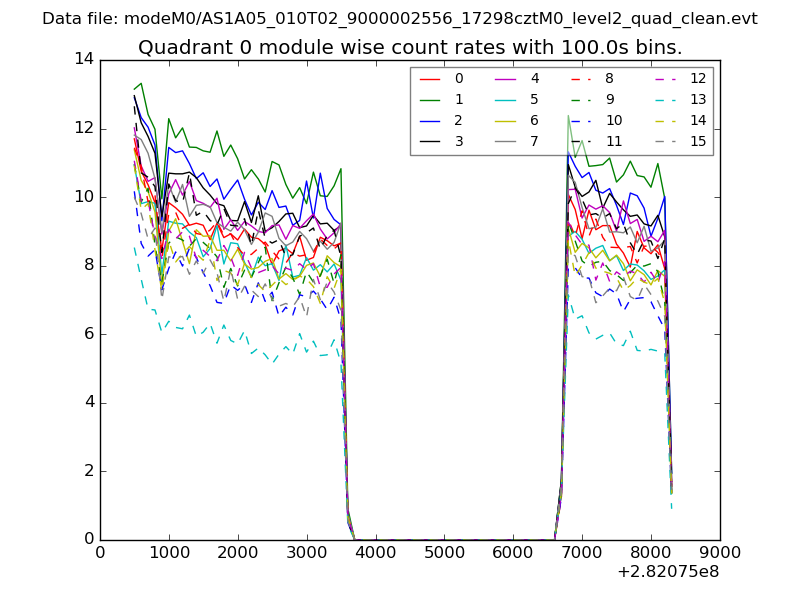 |
 |
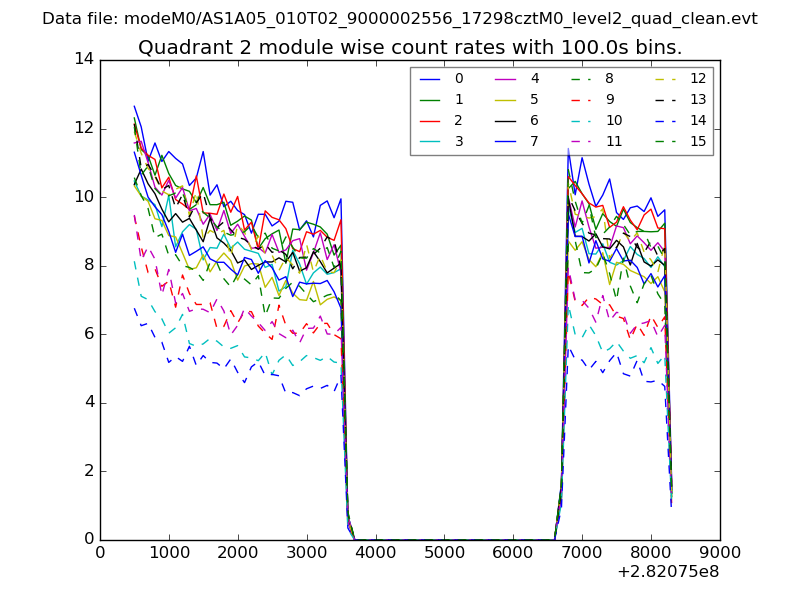
| Module-wise count rates for Quadrant B Data is divided into 100 sec bins |
 |
 |
| Module-wise count rates for Quadrant C Data is divided into 100 sec bins |
 |
 |
| Module-wise count rates for Quadrant D Data is divided into 100 sec bins |
 |
 |
| Parameter | Plot |
|---|---|
| CZT HV Monitor | 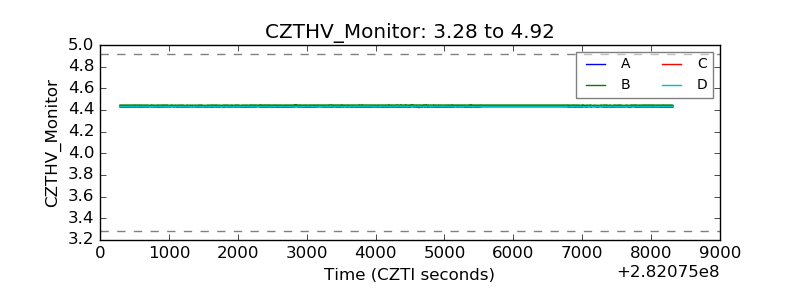 |
| D_VDD | 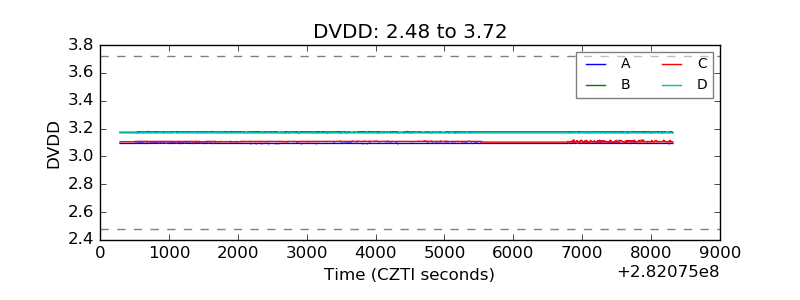 |
| Temperature 1 | 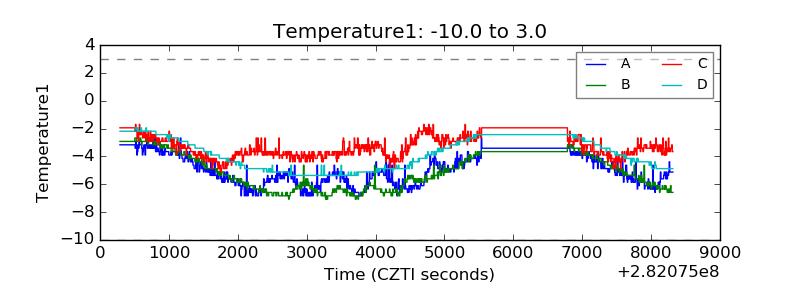 |
| Veto HV Monitor | 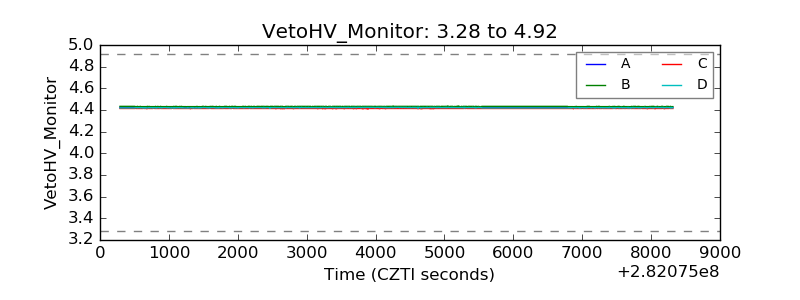 |
| Veto LLD | 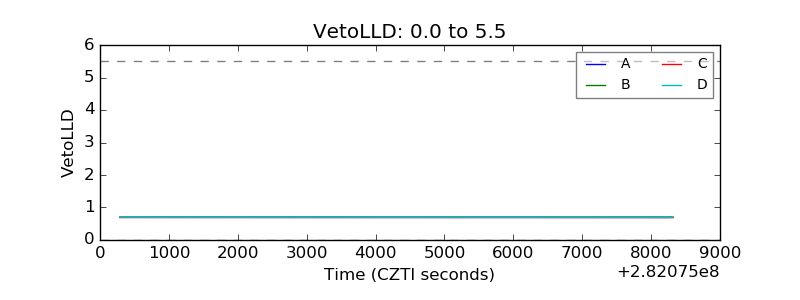 |
| Alpha Counter | 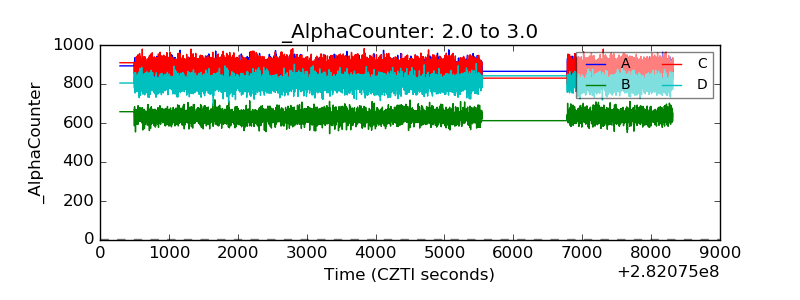 |
| _CPM_Rate | 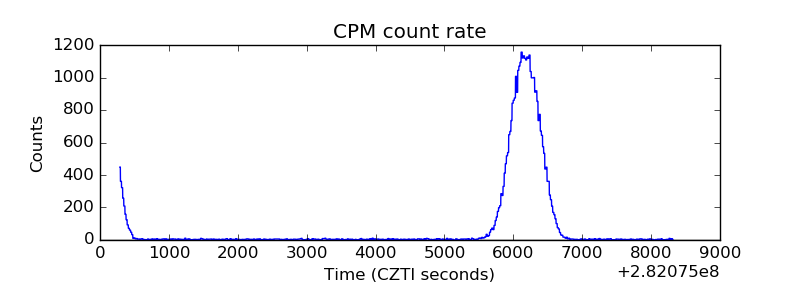 |
| CZT Counter | 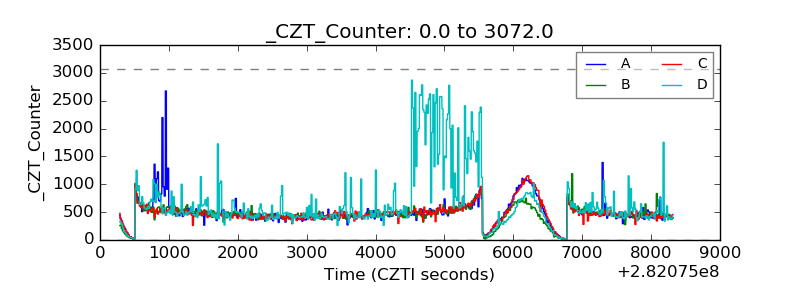 |
| +2.5 Volts monitor |  |
| +5 Volts monitor |  |
| _ROLL_ROT | 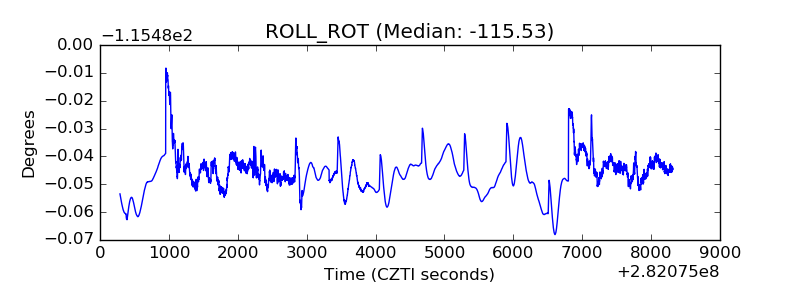 |
| _Roll_DEC | 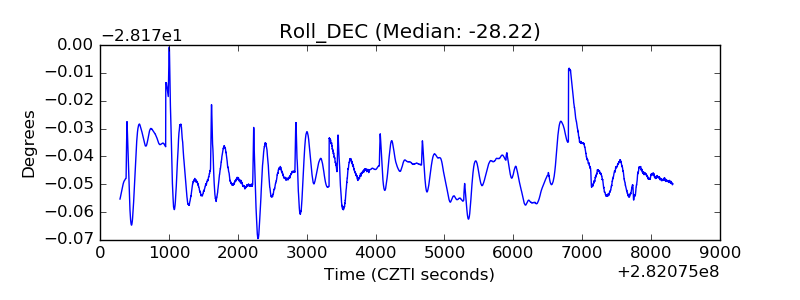 |
| _Roll_RA | 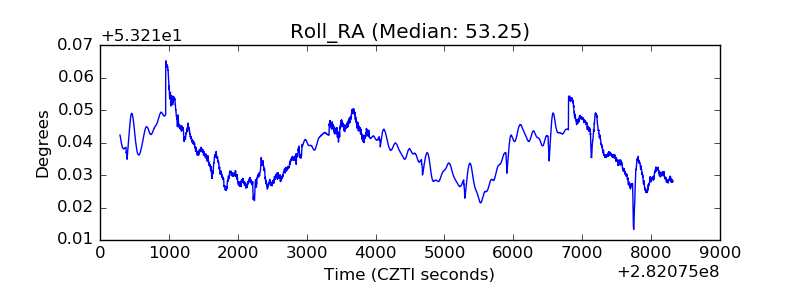 |
| Veto Counter | 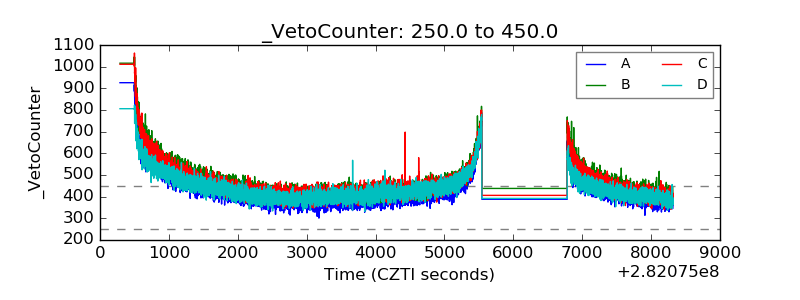 |