| Param | Original file | Final file |
|---|---|---|
| Filename | modeM0/AS1A05_010T02_9000002556_17300cztM0_level2.evt | modeM0/AS1A05_010T02_9000002556_17300cztM0_level2_quad_clean.evt |
| Size (bytes) | 470,064,960 | 100,923,840 |
| Size | 448.3 MB | 96.2 MB |
| Events in quadrant A | 3,378,013 | 655,445 |
| Events in quadrant B | 3,452,131 | 658,868 |
| Events in quadrant C | 3,377,734 | 620,118 |
| Events in quadrant D | 3,534,602 | 616,600 |
| Mode M0 | |||
|---|---|---|---|
| Quadrant | BADHDUFLAG | Total packets | Discarded packets |
| A | 0 | 15020 | 2 |
| B | 0 | 15125 | 2 |
| C | 0 | 14901 | 2 |
| D | 0 | 15616 | 2 |
| Mode M9 | |||
|---|---|---|---|
| Quadrant | BADHDUFLAG | Total packets | Discarded packets |
| A | 0 | 15 | 0 |
| B | 0 | 15 | 0 |
| C | 0 | 15 | 0 |
| D | 0 | 15 | 0 |
| Mode SS | |||
|---|---|---|---|
| Quadrant | BADHDUFLAG | Total packets | Discarded packets |
| A | 0 | 152 | 0 |
| B | 0 | 152 | 0 |
| C | 0 | 152 | 0 |
| D | 0 | 152 | 0 |
| Quadrant | Total seconds | Saturated seconds | Saturation percentage |
|---|---|---|---|
| A | 7249 | 40 | 0.551800% |
| B | 7249 | 71 | 0.979445% |
| C | 7249 | 66 | 0.910470% |
| D | 7250 | 19 | 0.262069% |
Noise dominated data is calculated using 1-second bins in cleaned event files. If a bin has >2000 counts, and if more than 50% of those come from <1% of pixels, then it is considered to be noise-dominated and hence unusable.
| Quadrant | # 1 sec bins | Bins with >0 counts | Bins with >2000 counts | High rate bins dominated by noise | Noise dominated (total time) | Noise dominated (detector-on time) | Marked lightcurve |
|---|---|---|---|---|---|---|---|
| A | 8829 | 7251 | 3 | 3 | 0.03% | 0.04% | 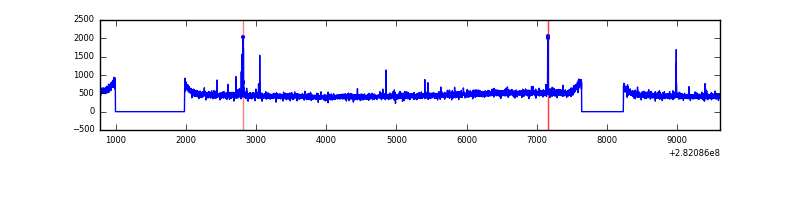 |
| B | 8829 | 7251 | 1 | 1 | 0.01% | 0.01% | 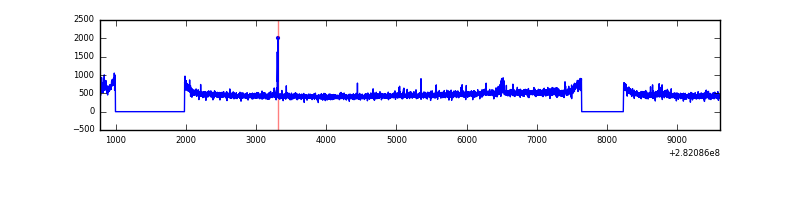 |
| C | 8829 | 7251 | 1 | 1 | 0.01% | 0.01% | 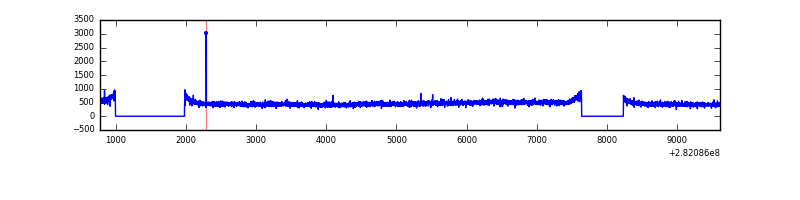 |
| D | 8830 | 7252 | 7 | 7 | 0.08% | 0.10% | 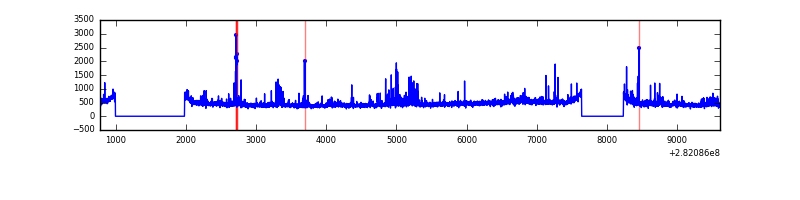 |
Top three noisy pixels from each quadrant. If the there are fewer than three noisy pixels in the level2.evt file, extra rows are filled as -1
| Pixel properties | Quadrant properties | ||||||
|---|---|---|---|---|---|---|---|
| Quadrant | DetID | PixID | Counts | Sigma | Mean | Median | Sigma |
| A | 4 | 2 | 39192 | 218.08 | 865 | 848 | 175.8 |
| A | 14 | 235 | 11563 | 60.94 | 865 | 848 | 175.8 |
| A | 0 | 226 | 7576 | 38.26 | 865 | 848 | 175.8 |
| B | 0 | 230 | 28003 | 161.49 | 869 | 845 | 168.2 |
| B | 12 | 111 | 20629 | 117.64 | 869 | 845 | 168.2 |
| B | 10 | 247 | 19532 | 111.12 | 869 | 845 | 168.2 |
| C | 14 | 238 | 127197 | 646.01 | 825 | 830 | 195.6 |
| C | 3 | 233 | 32758 | 163.22 | 825 | 830 | 195.6 |
| C | 13 | 61 | 5855 | 25.69 | 825 | 830 | 195.6 |
| D | 5 | 222 | 201689 | 996.03 | 835 | 811 | 201.7 |
| D | 2 | 152 | 101536 | 499.43 | 835 | 811 | 201.7 |
| D | 1 | 52 | 70601 | 346.04 | 835 | 811 | 201.7 |
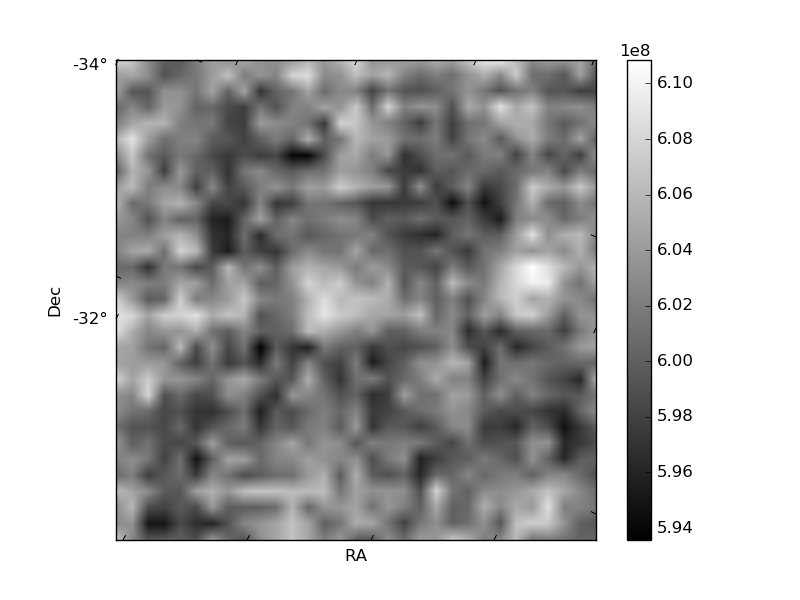
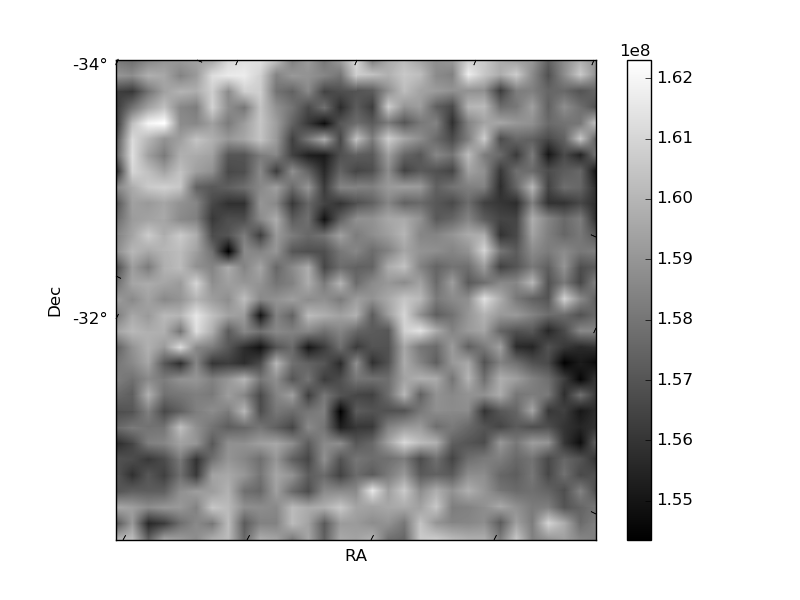
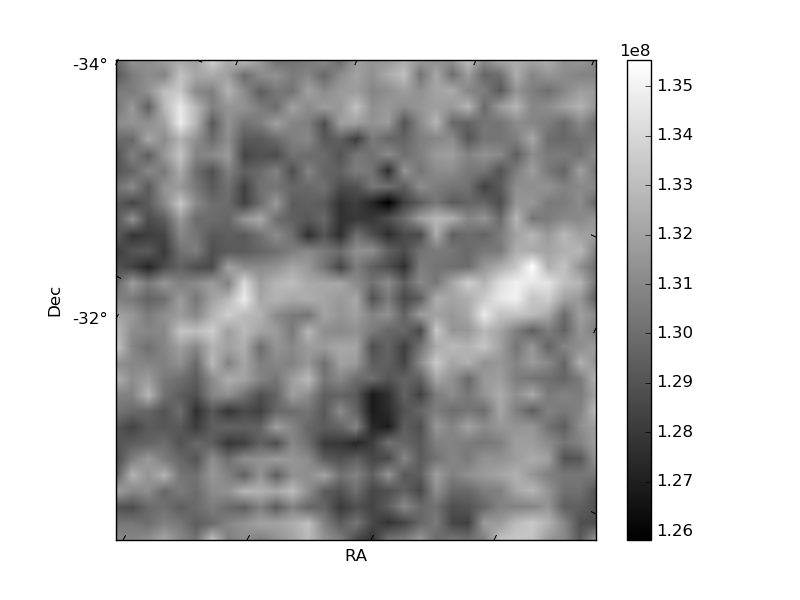
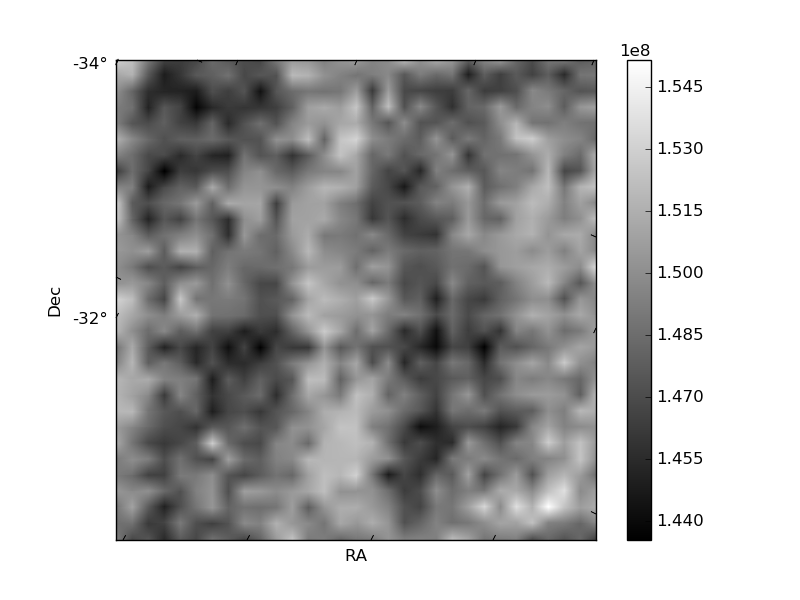
Histogram calculated using DETX and DETY for each event in the final _common_clean file
| Quadrant A | 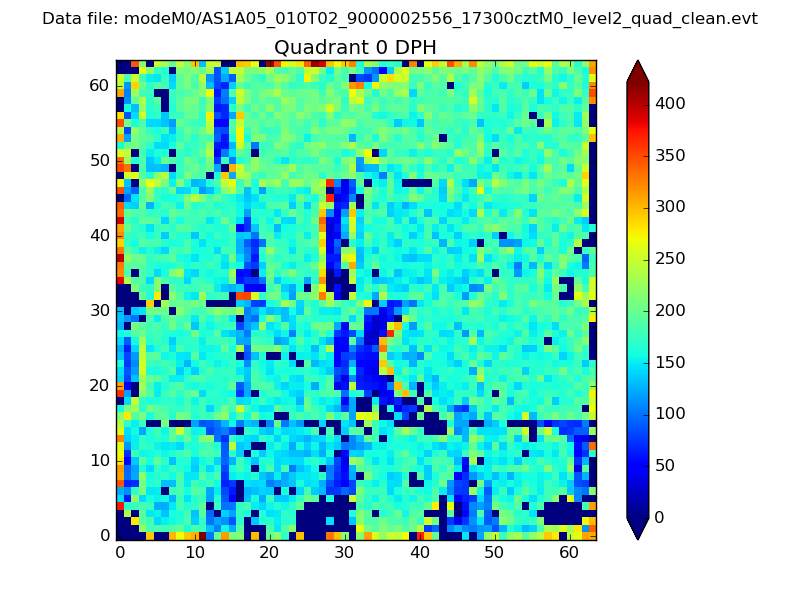 |
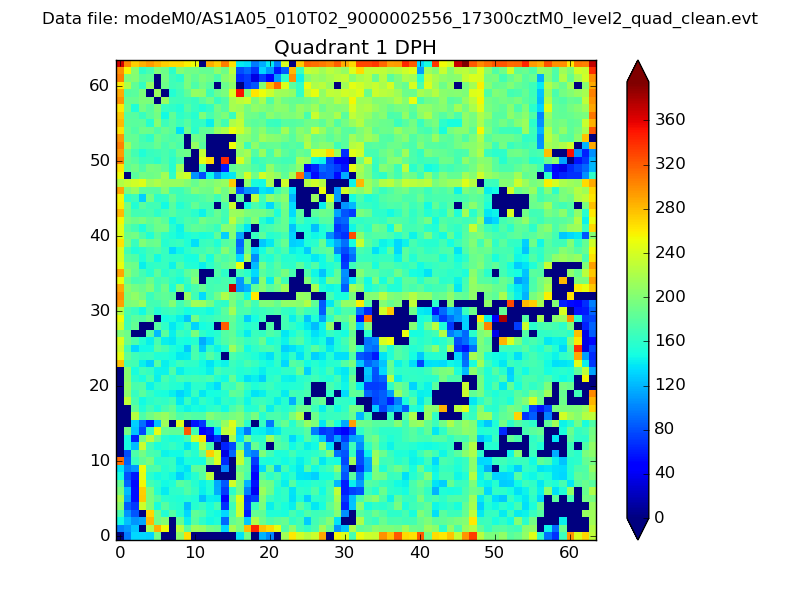 |
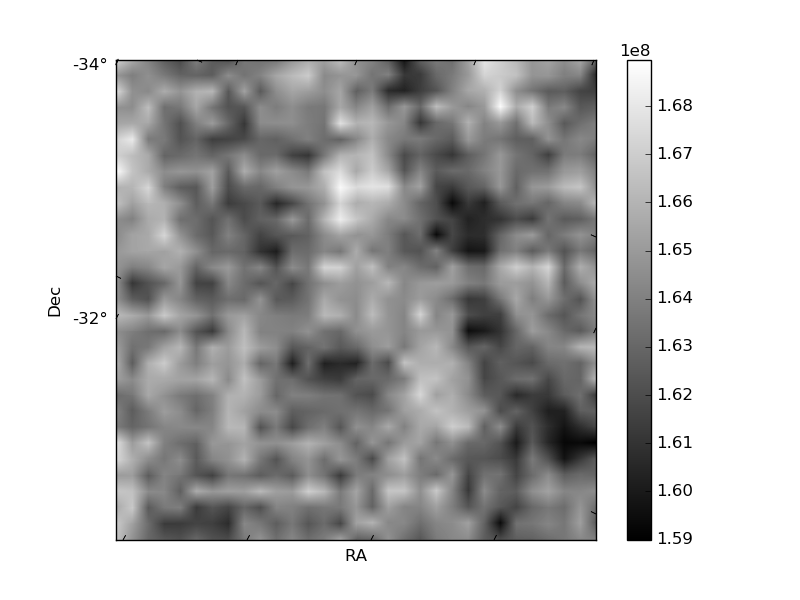
Quadrant B |
|---|---|---|---|
| Quadrant D | 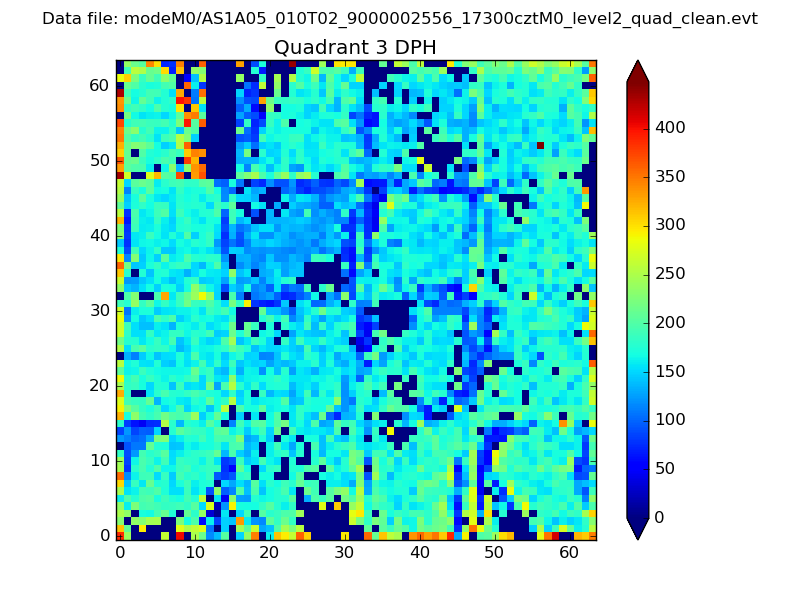 |
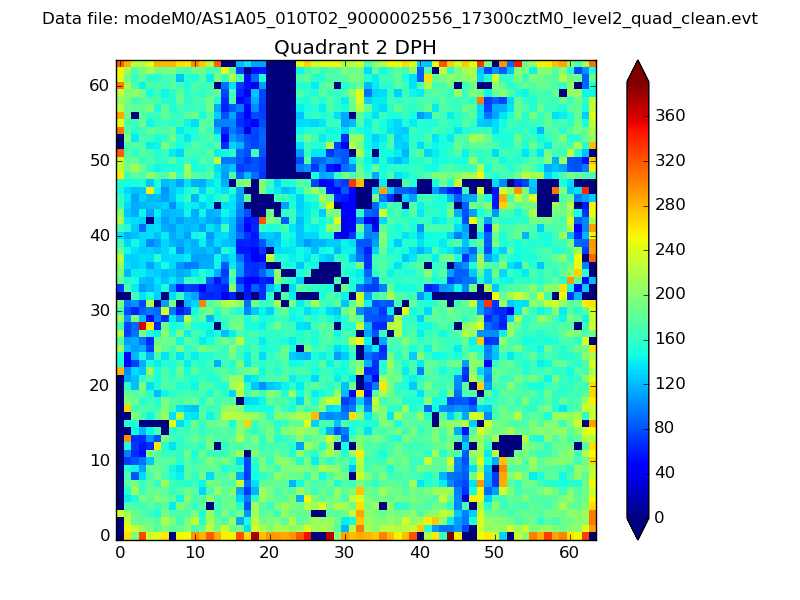 |
Quadrant C |
| Plot type | Count rate plots | Images |
|---|---|---|
| Comparison with Poisson distribution Blue bars denote a histogram of data divided into 1 sec bins. Red curve is a Poisson curve with rate = median count rate of data. |
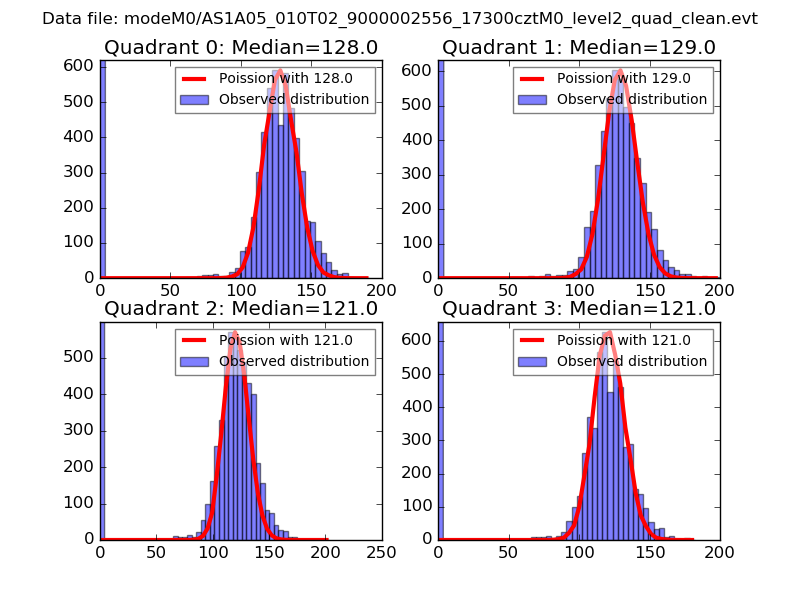 |
 |
| Quadrant-wise count rates Data is divided into 100 sec bins |
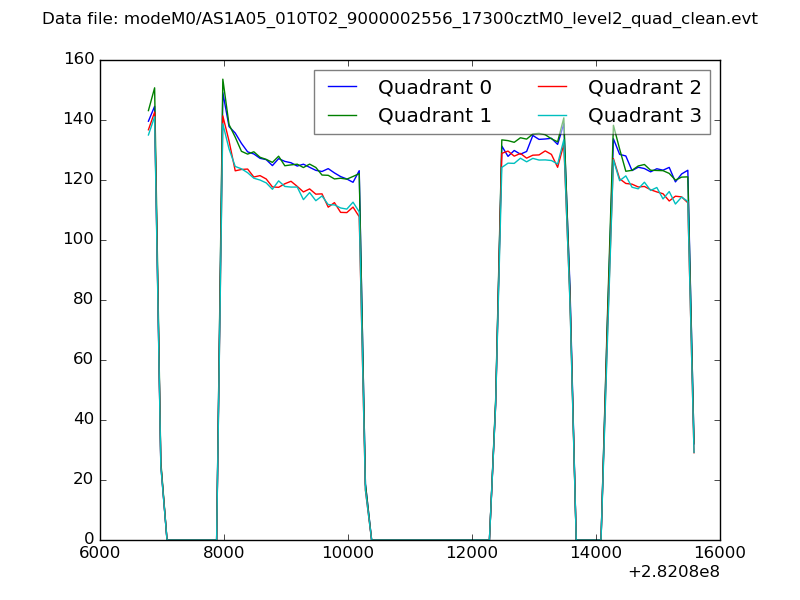 |
|
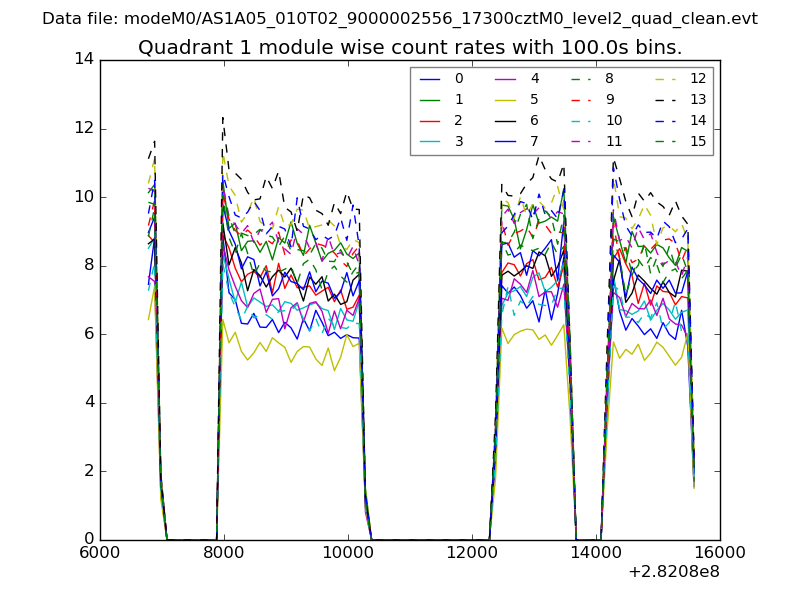
| Module-wise count rates for Quadrant A Data is divided into 100 sec bins |
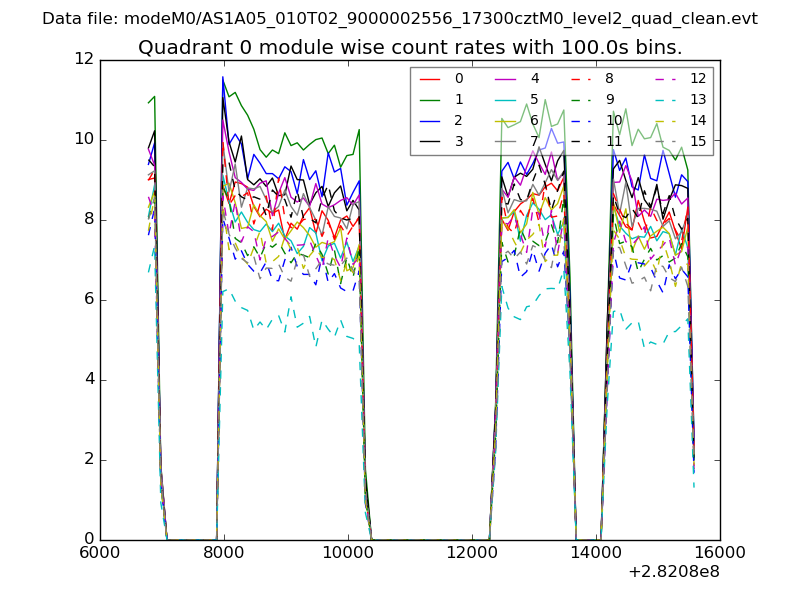 |
 |
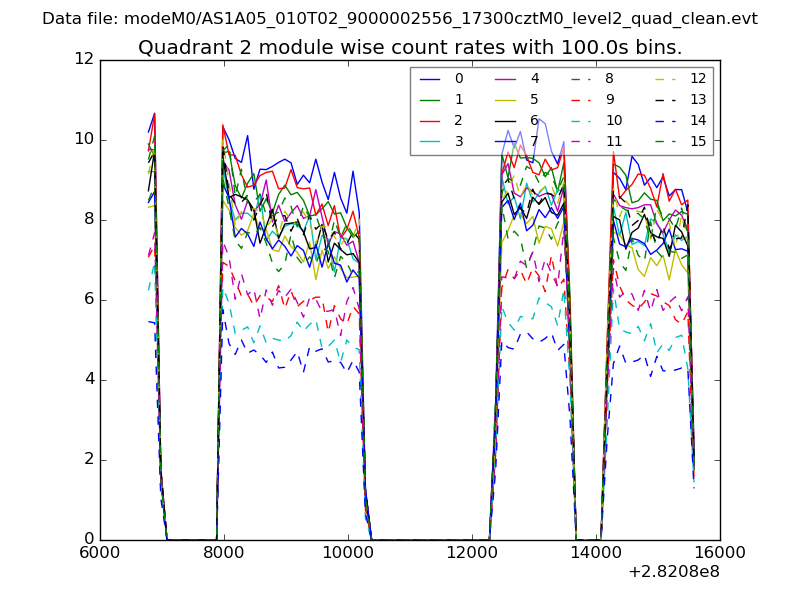
| Module-wise count rates for Quadrant B Data is divided into 100 sec bins |
 |
 |
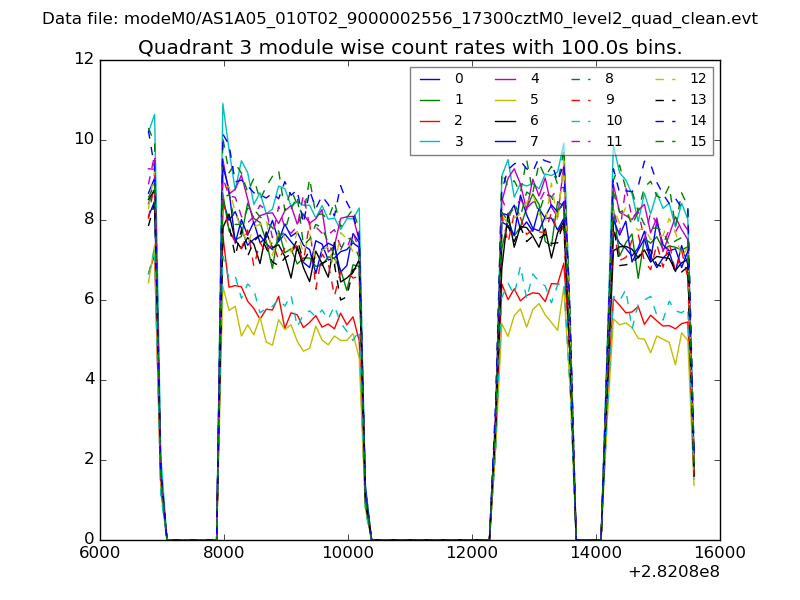
| Module-wise count rates for Quadrant C Data is divided into 100 sec bins |
 |
 |
| Module-wise count rates for Quadrant D Data is divided into 100 sec bins |
 |
 |
| Parameter | Plot |
|---|---|
| CZT HV Monitor | 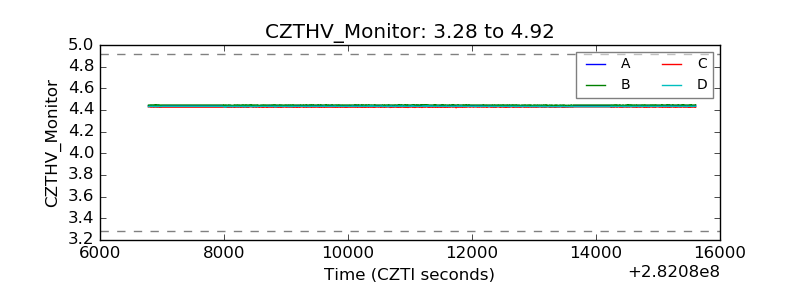 |
| D_VDD | 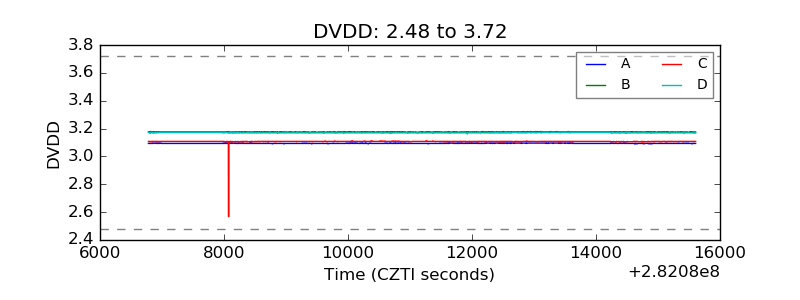 |
| Temperature 1 | 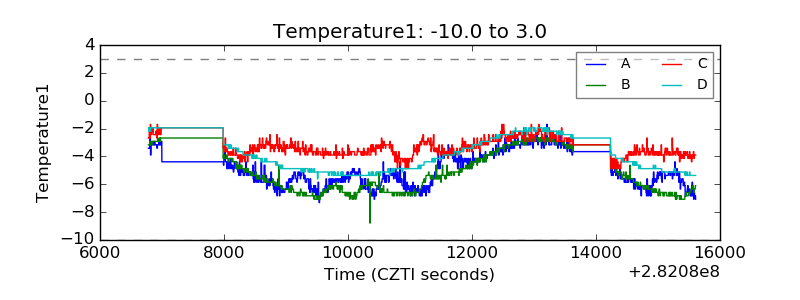 |
| Veto HV Monitor | 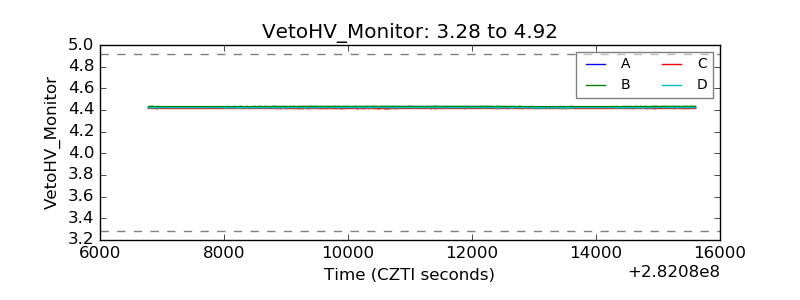 |
| Veto LLD | 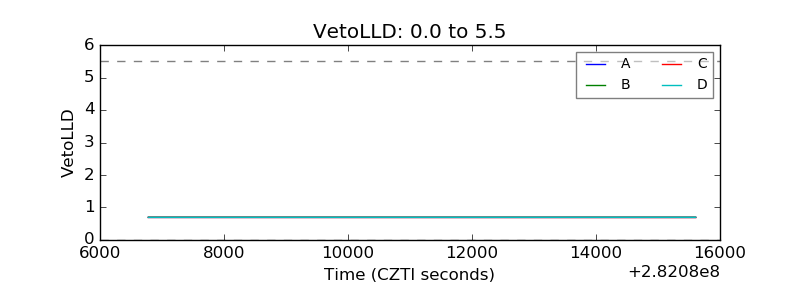 |
| Alpha Counter | 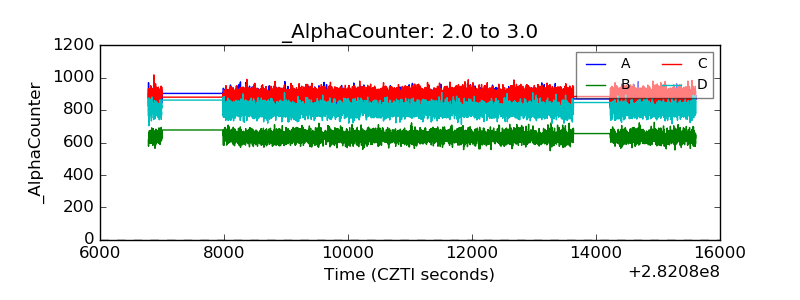 |
| _CPM_Rate |  |
| CZT Counter | 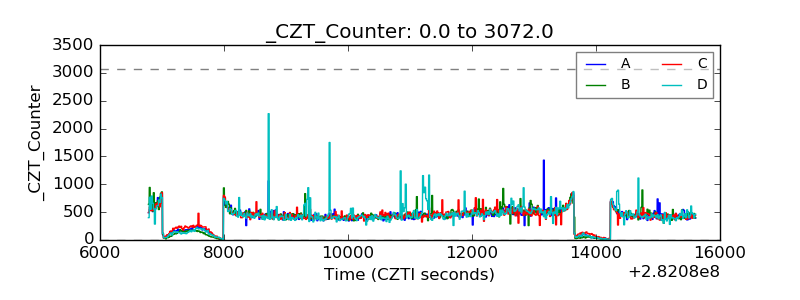 |
| +2.5 Volts monitor |  |
| +5 Volts monitor |  |
| _ROLL_ROT | 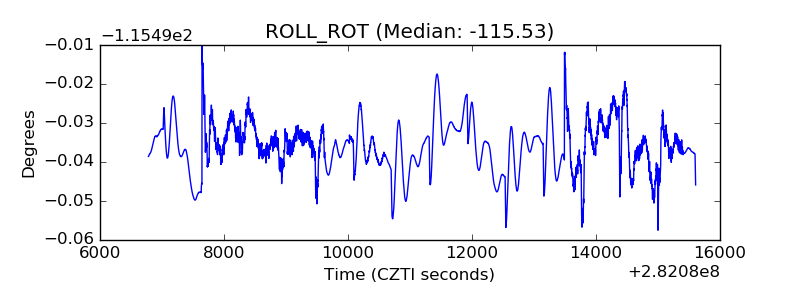 |
| _Roll_DEC | 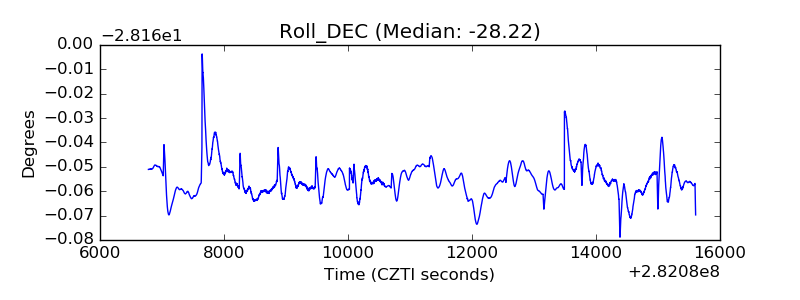 |
| _Roll_RA | 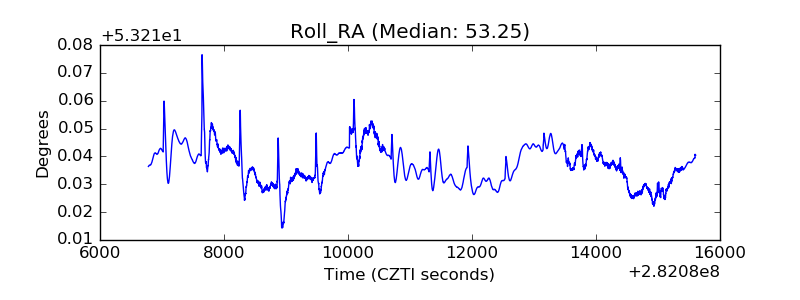 |
| Veto Counter | 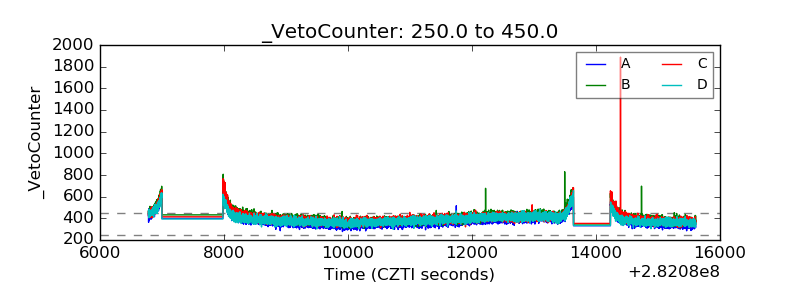 |