| Param | Original file | Final file |
|---|---|---|
| Filename | modeM0/AS1A05_010T02_9000002556_17301cztM0_level2.evt | modeM0/AS1A05_010T02_9000002556_17301cztM0_level2_quad_clean.evt |
| Size (bytes) | 475,231,680 | 103,682,880 |
| Size | 453.2 MB | 98.9 MB |
| Events in quadrant A | 3,397,447 | 674,762 |
| Events in quadrant B | 3,481,930 | 673,298 |
| Events in quadrant C | 3,426,797 | 636,792 |
| Events in quadrant D | 3,577,366 | 634,472 |
| Mode M0 | |||
|---|---|---|---|
| Quadrant | BADHDUFLAG | Total packets | Discarded packets |
| A | 0 | 15319 | 2 |
| B | 0 | 15431 | 2 |
| C | 0 | 15276 | 2 |
| D | 0 | 15857 | 2 |
| Mode M9 | |||
|---|---|---|---|
| Quadrant | BADHDUFLAG | Total packets | Discarded packets |
| A | 0 | 9 | 0 |
| B | 0 | 9 | 0 |
| C | 0 | 9 | 0 |
| D | 0 | 9 | 0 |
| Mode SS | |||
|---|---|---|---|
| Quadrant | BADHDUFLAG | Total packets | Discarded packets |
| A | 0 | 152 | 0 |
| B | 0 | 152 | 0 |
| C | 0 | 152 | 0 |
| D | 0 | 152 | 0 |
| Quadrant | Total seconds | Saturated seconds | Saturation percentage |
|---|---|---|---|
| A | 7491 | 40 | 0.533974% |
| B | 7491 | 80 | 1.067948% |
| C | 7491 | 82 | 1.094647% |
| D | 7491 | 55 | 0.734214% |
Noise dominated data is calculated using 1-second bins in cleaned event files. If a bin has >2000 counts, and if more than 50% of those come from <1% of pixels, then it is considered to be noise-dominated and hence unusable.
| Quadrant | # 1 sec bins | Bins with >0 counts | Bins with >2000 counts | High rate bins dominated by noise | Noise dominated (total time) | Noise dominated (detector-on time) | Marked lightcurve |
|---|---|---|---|---|---|---|---|
| A | 8381 | 7493 | 0 | 0 | 0.00% | 0.00% | 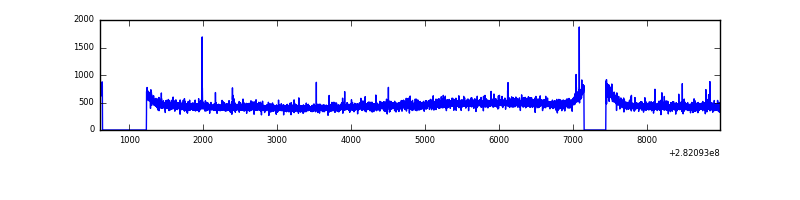 |
| B | 8381 | 7493 | 0 | 0 | 0.00% | 0.00% |  |
| C | 8381 | 7493 | 0 | 0 | 0.00% | 0.00% | 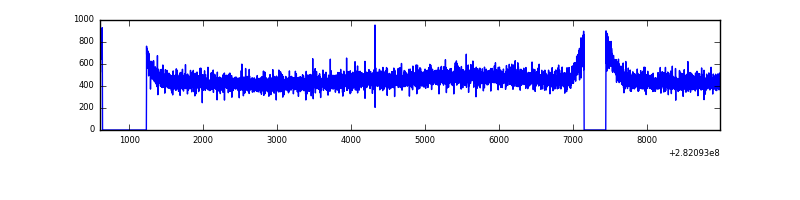 |
| D | 8381 | 7493 | 7 | 7 | 0.08% | 0.09% | 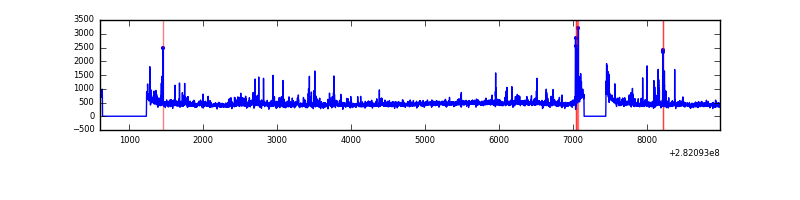 |
Top three noisy pixels from each quadrant. If the there are fewer than three noisy pixels in the level2.evt file, extra rows are filled as -1
| Pixel properties | Quadrant properties | ||||||
|---|---|---|---|---|---|---|---|
| Quadrant | DetID | PixID | Counts | Sigma | Mean | Median | Sigma |
| A | 4 | 2 | 13747 | 73.02 | 877 | 860 | 176.5 |
| A | 14 | 235 | 9267 | 47.63 | 877 | 860 | 176.5 |
| A | 0 | 226 | 7572 | 38.03 | 877 | 860 | 176.5 |
| B | 0 | 230 | 32946 | 188.97 | 879 | 857 | 169.8 |
| B | 12 | 111 | 20877 | 117.9 | 879 | 857 | 169.8 |
| B | 11 | 111 | 17978 | 100.83 | 879 | 857 | 169.8 |
| C | 14 | 238 | 129135 | 649.33 | 839 | 841 | 197.6 |
| C | 3 | 233 | 27438 | 134.61 | 839 | 841 | 197.6 |
| C | 13 | 61 | 6013 | 26.18 | 839 | 841 | 197.6 |
| D | 1 | 52 | 141829 | 689.05 | 847 | 822 | 204.6 |
| D | 2 | 152 | 114927 | 557.59 | 847 | 822 | 204.6 |
| D | 5 | 222 | 95513 | 462.72 | 847 | 822 | 204.6 |
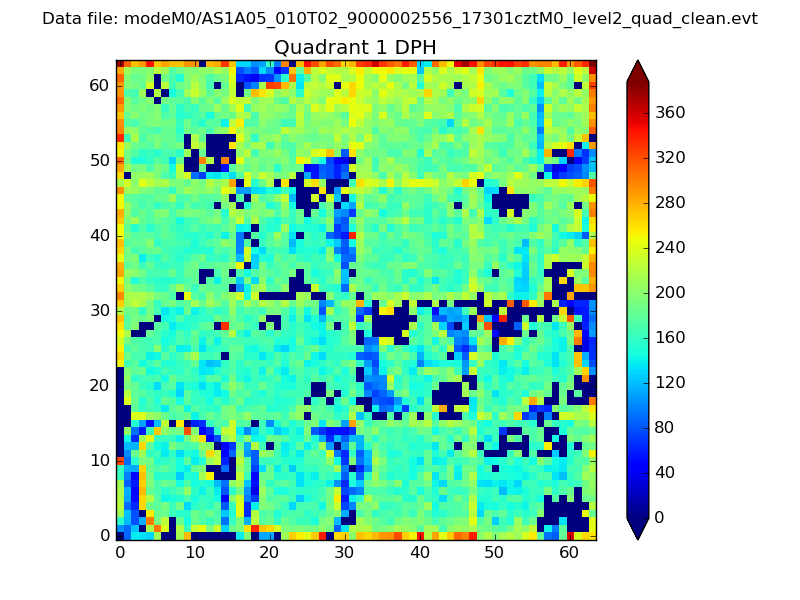
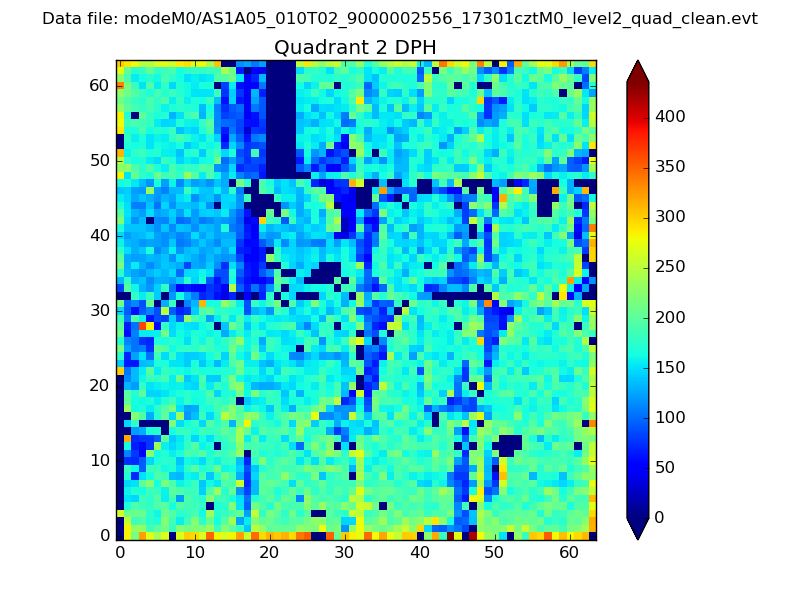
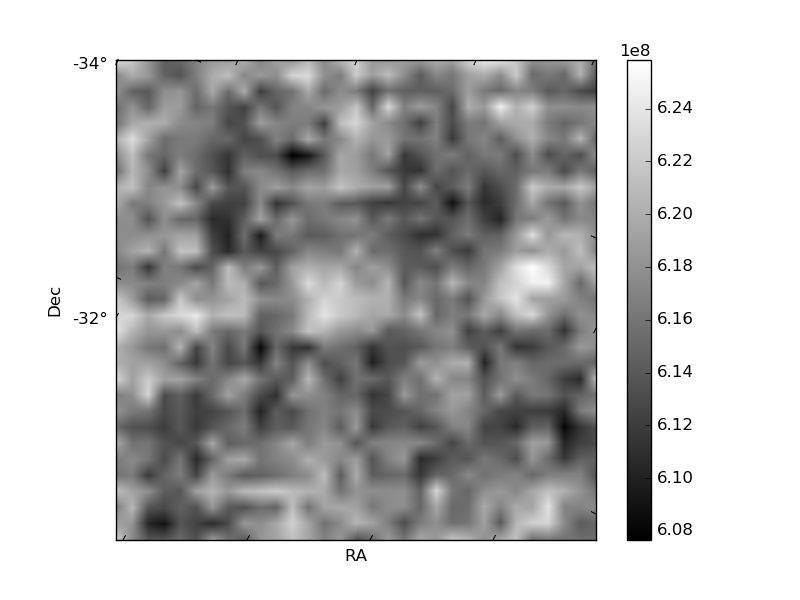
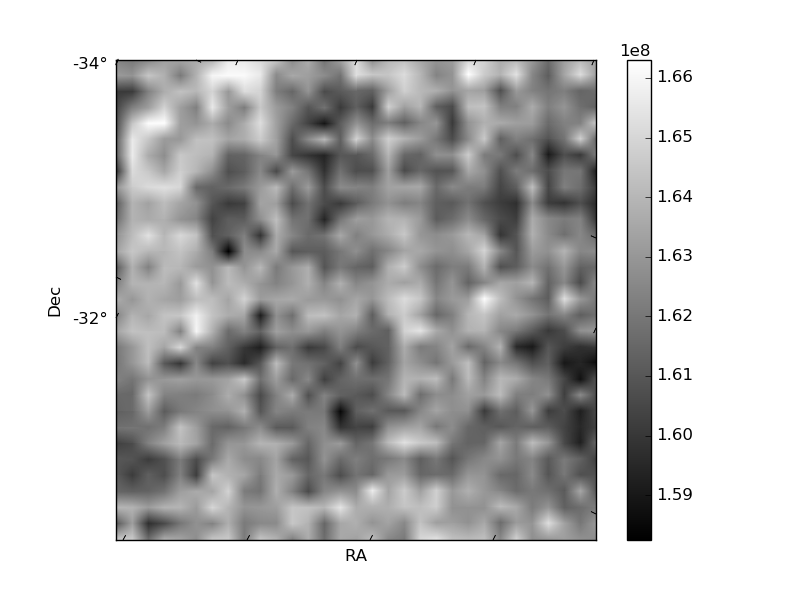
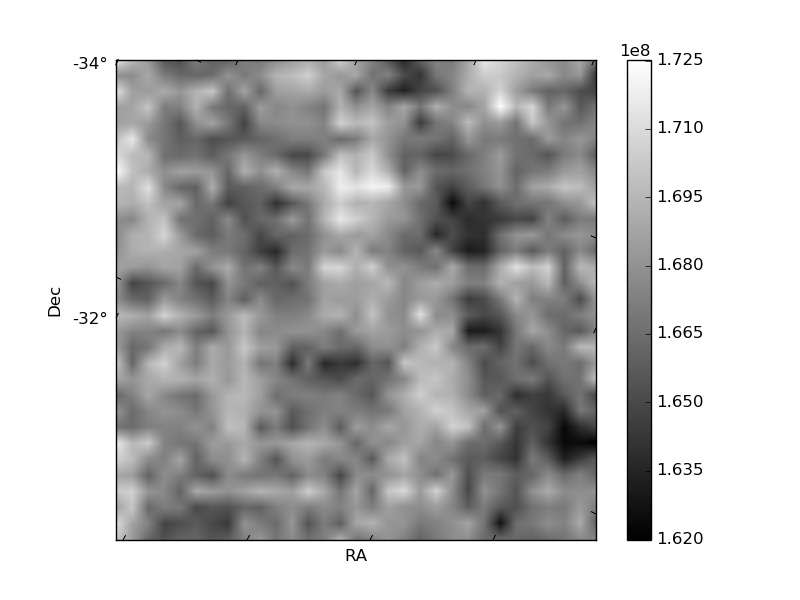
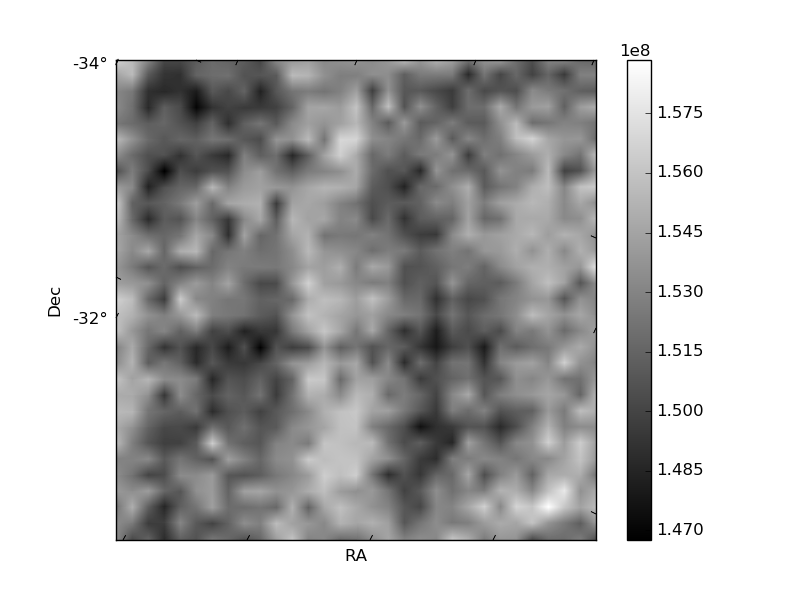
Histogram calculated using DETX and DETY for each event in the final _common_clean file
| Quadrant A | 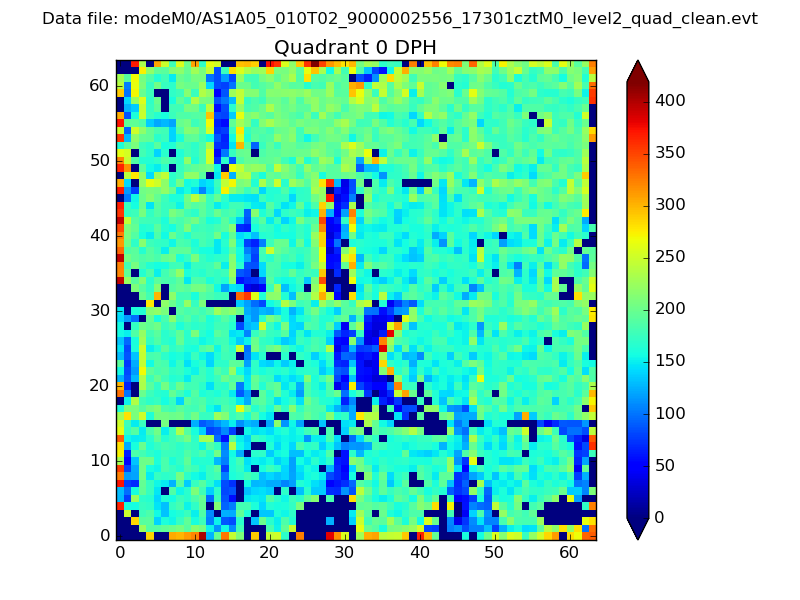 |
 |
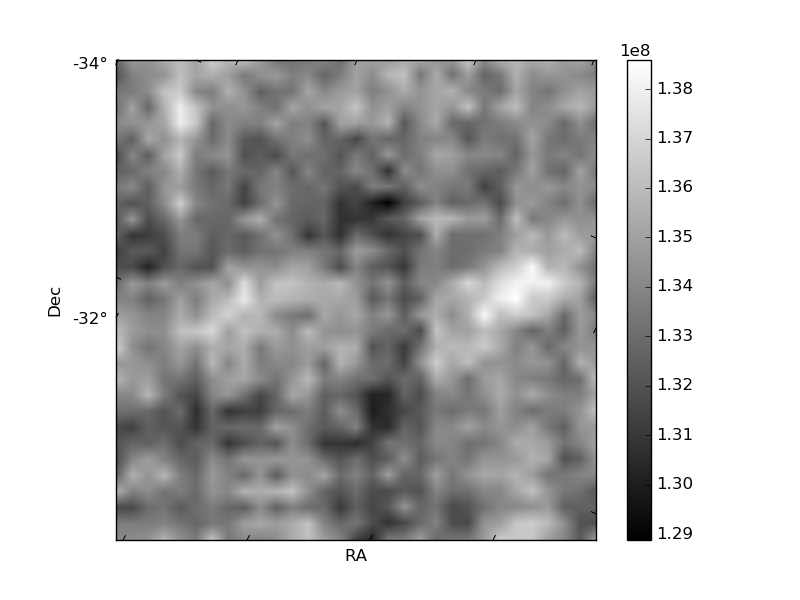
Quadrant B |
|---|---|---|---|
| Quadrant D | 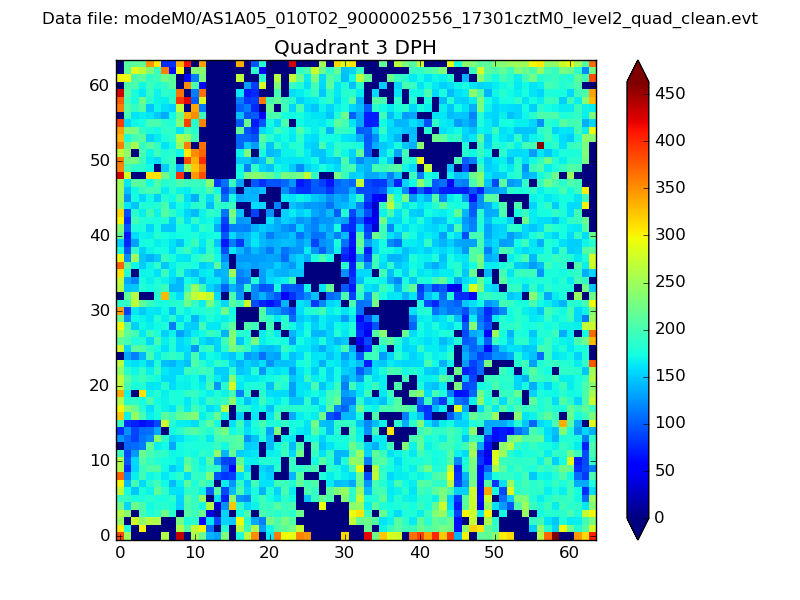 |
 |
Quadrant C |
| Plot type | Count rate plots | Images |
|---|---|---|
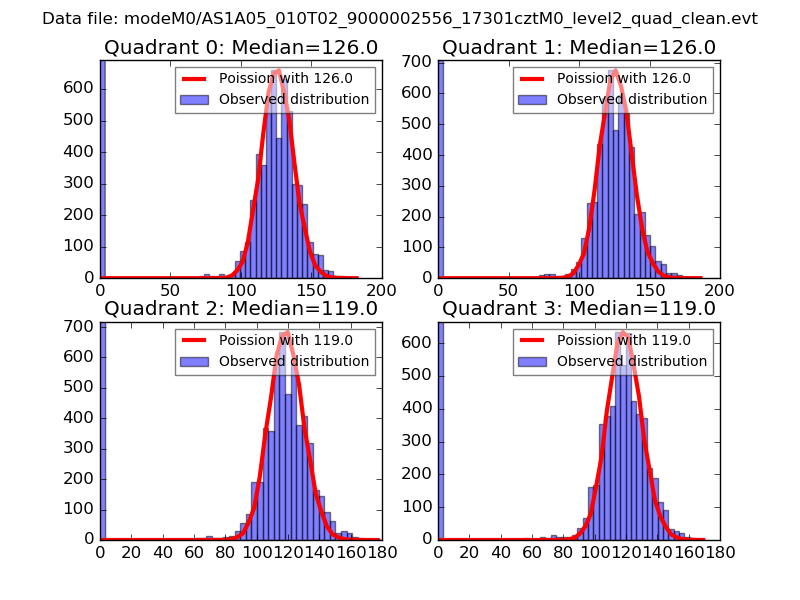
| Comparison with Poisson distribution Blue bars denote a histogram of data divided into 1 sec bins. Red curve is a Poisson curve with rate = median count rate of data. |
 |
 |
| Quadrant-wise count rates Data is divided into 100 sec bins |
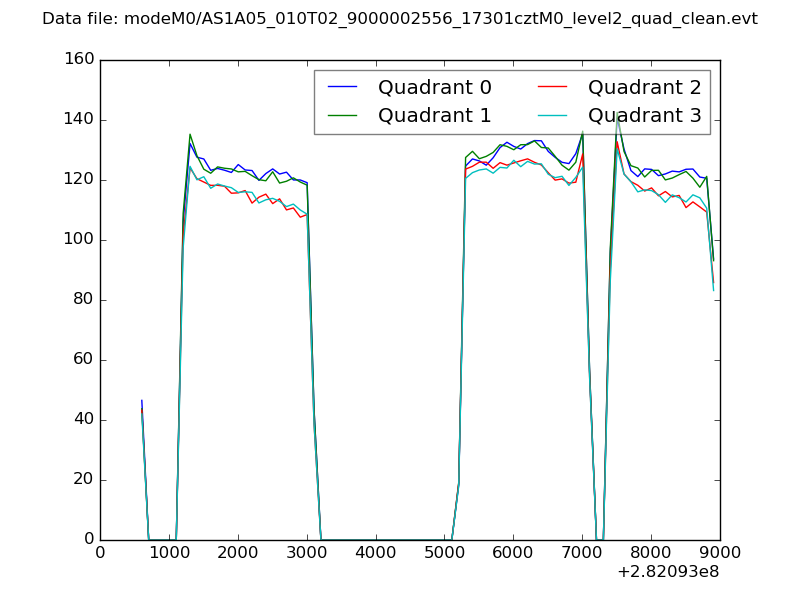 |
|
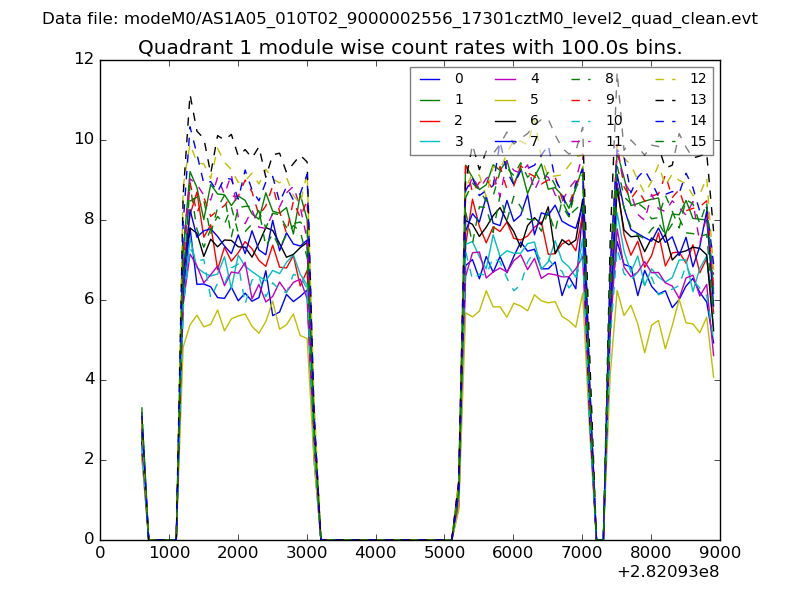
| Module-wise count rates for Quadrant A Data is divided into 100 sec bins |
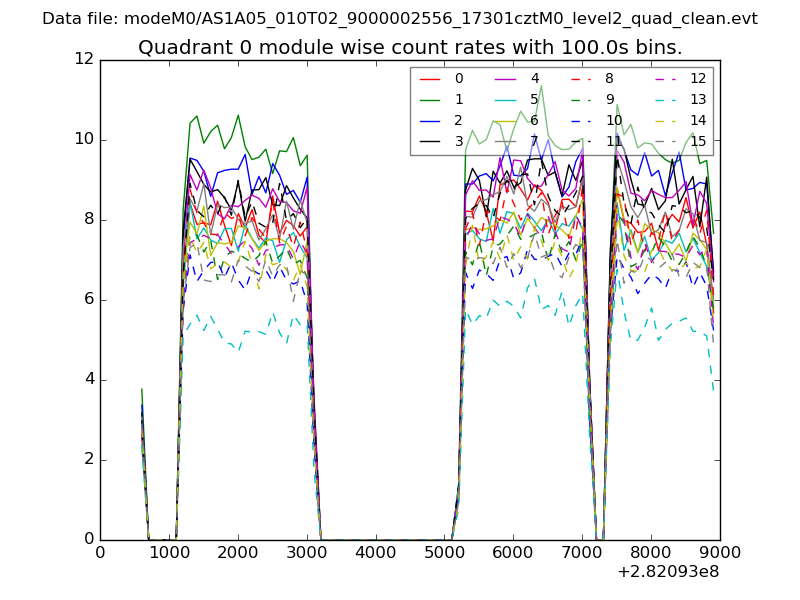 |
 |
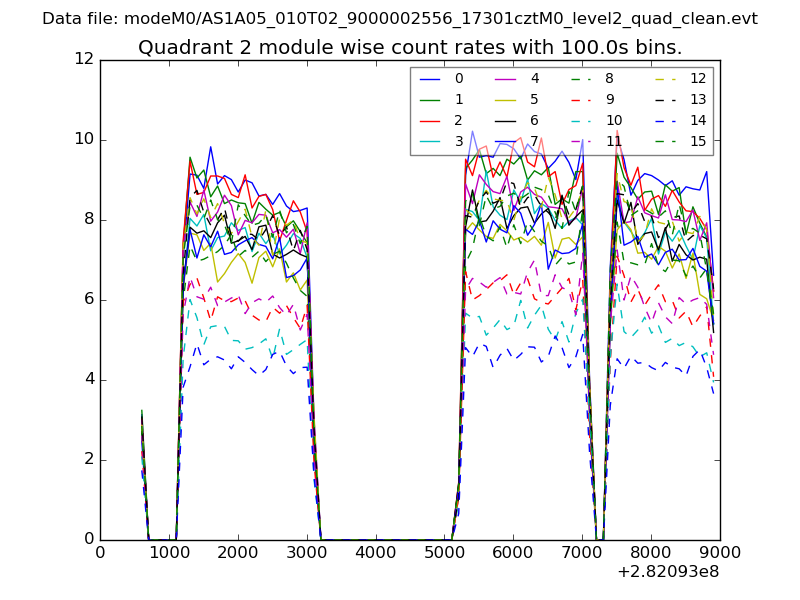
| Module-wise count rates for Quadrant B Data is divided into 100 sec bins |
 |
 |
| Module-wise count rates for Quadrant C Data is divided into 100 sec bins |
 |
 |
| Module-wise count rates for Quadrant D Data is divided into 100 sec bins |
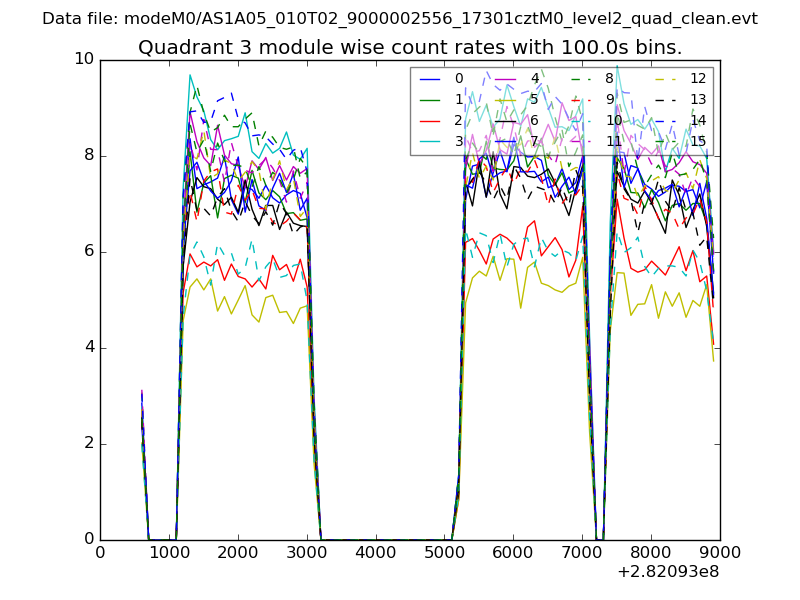 |
 |
| Parameter | Plot |
|---|---|
| CZT HV Monitor | 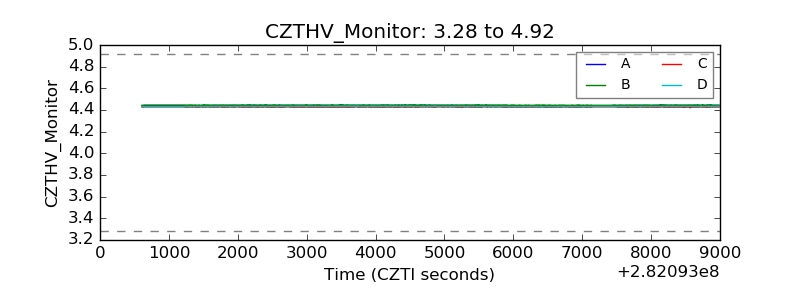 |
| D_VDD | 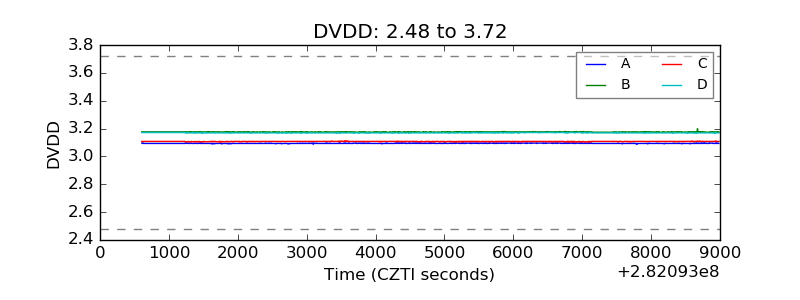 |
| Temperature 1 | 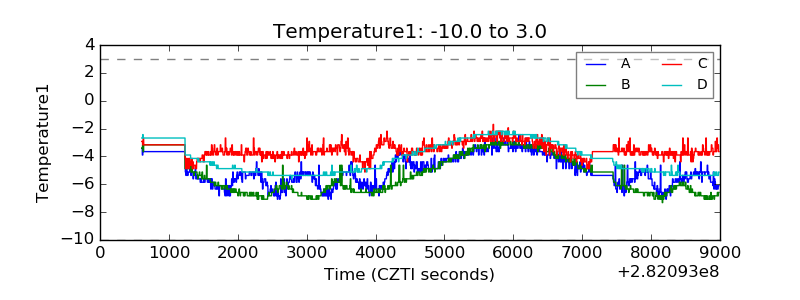 |
| Veto HV Monitor |  |
| Veto LLD | 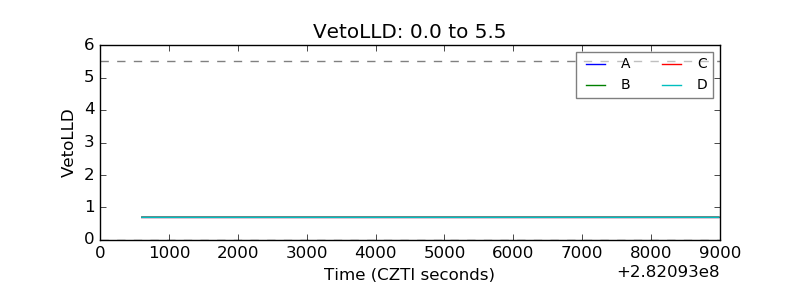 |
| Alpha Counter | 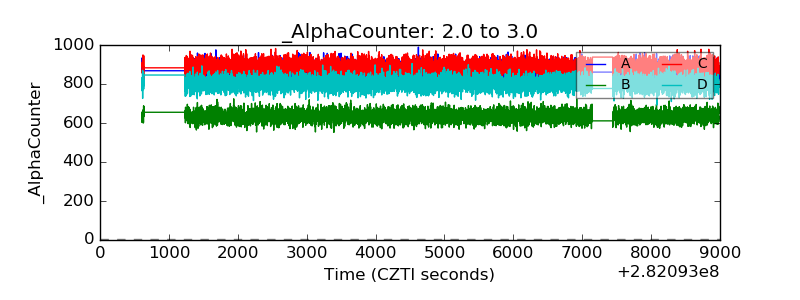 |
| _CPM_Rate | 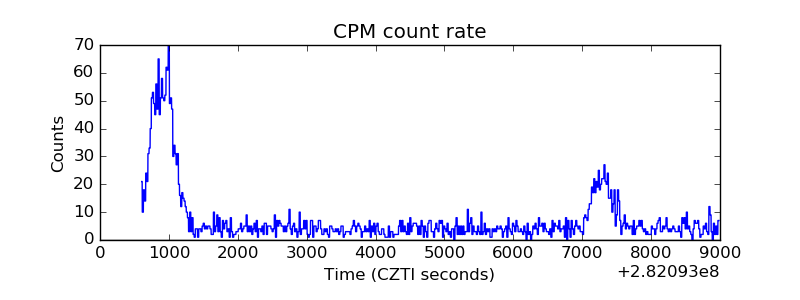 |
| CZT Counter | 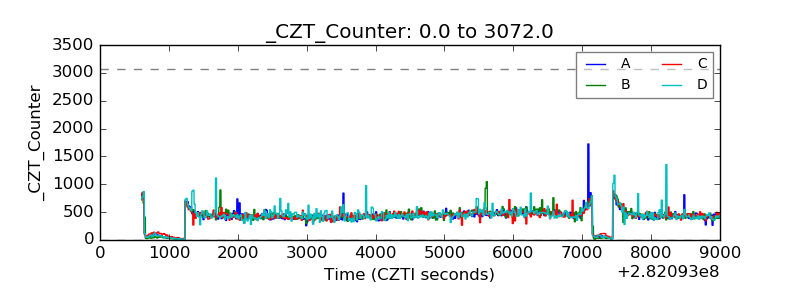 |
| +2.5 Volts monitor |  |
| +5 Volts monitor |  |
| _ROLL_ROT | 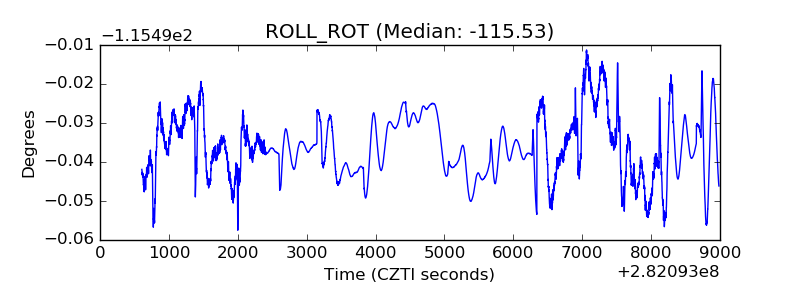 |
| _Roll_DEC | 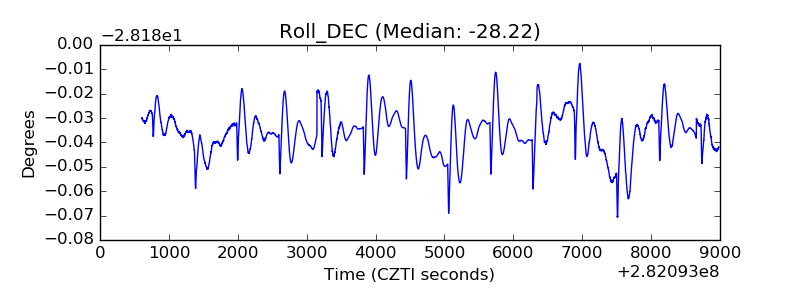 |
| _Roll_RA | 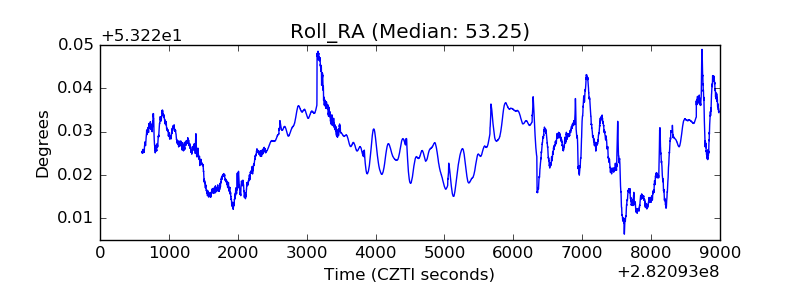 |
| Veto Counter | 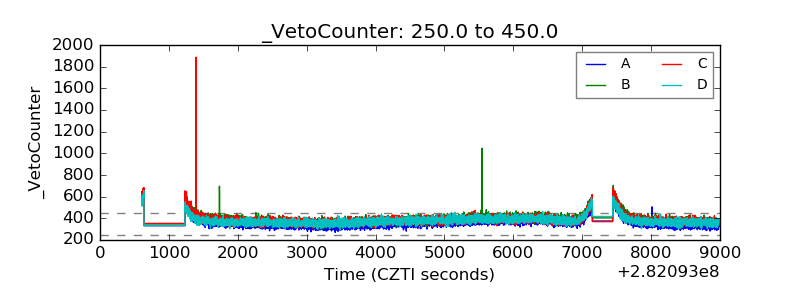 |