| Param | Original file | Final file |
|---|---|---|
| Filename | modeM0/AS1A05_010T02_9000002556_17302cztM0_level2.evt | modeM0/AS1A05_010T02_9000002556_17302cztM0_level2_quad_clean.evt |
| Size (bytes) | 530,588,160 | 110,105,280 |
| Size | 506.0 MB | 105.0 MB |
| Events in quadrant A | 3,811,195 | 708,321 |
| Events in quadrant B | 3,842,425 | 709,824 |
| Events in quadrant C | 3,833,015 | 671,623 |
| Events in quadrant D | 4,018,919 | 668,679 |
| Mode M0 | |||
|---|---|---|---|
| Quadrant | BADHDUFLAG | Total packets | Discarded packets |
| A | 0 | 17075 | 2 |
| B | 0 | 17035 | 2 |
| C | 0 | 16980 | 2 |
| D | 0 | 17823 | 2 |
| Mode M9 | |||
|---|---|---|---|
| Quadrant | BADHDUFLAG | Total packets | Discarded packets |
| A | 0 | 7 | 0 |
| B | 0 | 7 | 0 |
| C | 0 | 7 | 0 |
| D | 0 | 7 | 0 |
| Mode SS | |||
|---|---|---|---|
| Quadrant | BADHDUFLAG | Total packets | Discarded packets |
| A | 0 | 168 | 0 |
| B | 0 | 168 | 0 |
| C | 0 | 168 | 0 |
| D | 0 | 168 | 0 |
| Quadrant | Total seconds | Saturated seconds | Saturation percentage |
|---|---|---|---|
| A | 8298 | 75 | 0.903832% |
| B | 8299 | 101 | 1.217014% |
| C | 8299 | 120 | 1.445957% |
| D | 8299 | 95 | 1.144716% |
Noise dominated data is calculated using 1-second bins in cleaned event files. If a bin has >2000 counts, and if more than 50% of those come from <1% of pixels, then it is considered to be noise-dominated and hence unusable.
| Quadrant | # 1 sec bins | Bins with >0 counts | Bins with >2000 counts | High rate bins dominated by noise | Noise dominated (total time) | Noise dominated (detector-on time) | Marked lightcurve |
|---|---|---|---|---|---|---|---|
| A | 8973 | 8300 | 3 | 3 | 0.03% | 0.04% | 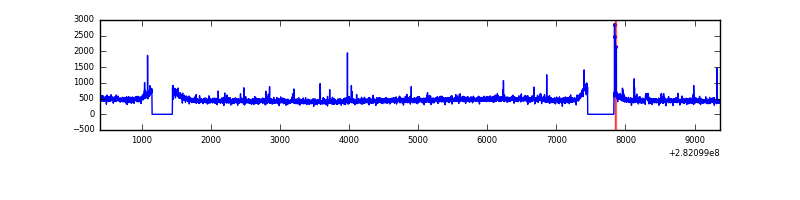 |
| B | 8974 | 8301 | 0 | 0 | 0.00% | 0.00% | 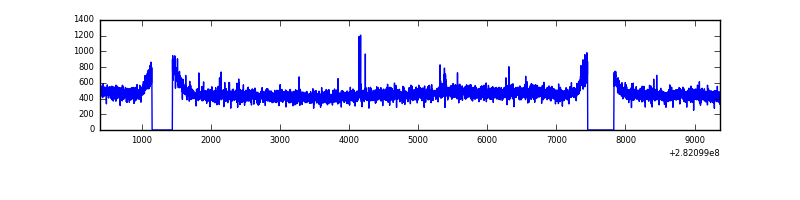 |
| C | 8974 | 8301 | 0 | 0 | 0.00% | 0.00% | 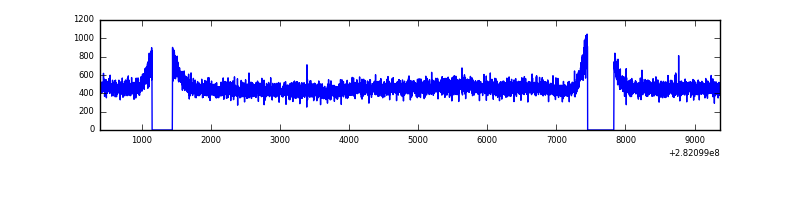 |
| D | 8974 | 8301 | 18 | 18 | 0.20% | 0.22% | 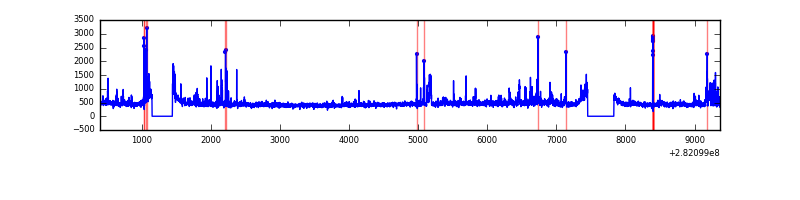 |
Top three noisy pixels from each quadrant. If the there are fewer than three noisy pixels in the level2.evt file, extra rows are filled as -1
| Pixel properties | Quadrant properties | ||||||
|---|---|---|---|---|---|---|---|
| Quadrant | DetID | PixID | Counts | Sigma | Mean | Median | Sigma |
| A | 4 | 2 | 36396 | 179.2 | 977 | 956 | 197.8 |
| A | 14 | 235 | 19598 | 94.26 | 977 | 956 | 197.8 |
| A | 0 | 226 | 8499 | 38.14 | 977 | 956 | 197.8 |
| B | 12 | 111 | 23596 | 119.61 | 979 | 953 | 189.3 |
| B | 11 | 111 | 20456 | 103.02 | 979 | 953 | 189.3 |
| B | 14 | 111 | 17687 | 88.39 | 979 | 953 | 189.3 |
| C | 14 | 238 | 141799 | 639.76 | 935 | 938 | 220.2 |
| C | 3 | 233 | 41364 | 183.61 | 935 | 938 | 220.2 |
| C | 13 | 61 | 6648 | 25.93 | 935 | 938 | 220.2 |
| D | 5 | 222 | 196883 | 850.48 | 946 | 916 | 230.4 |
| D | 11 | 176 | 88891 | 381.8 | 946 | 916 | 230.4 |
| D | 1 | 52 | 86750 | 372.51 | 946 | 916 | 230.4 |
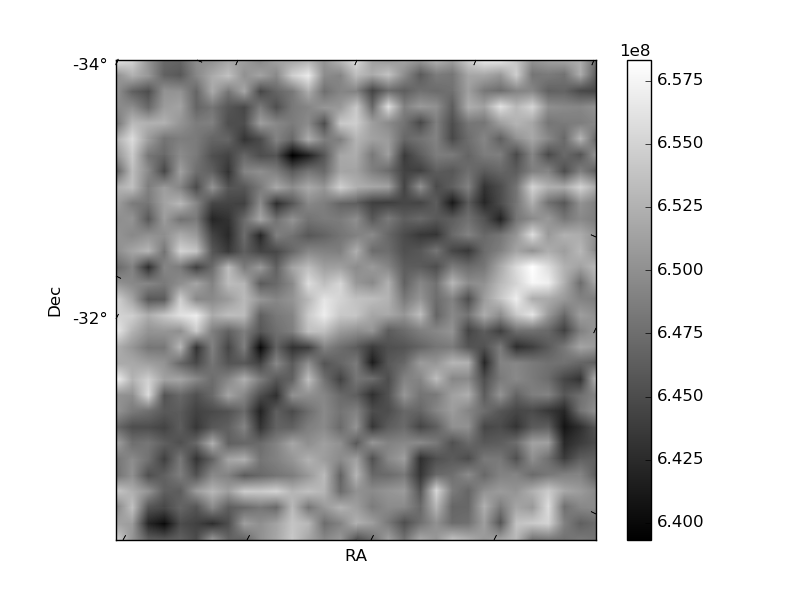
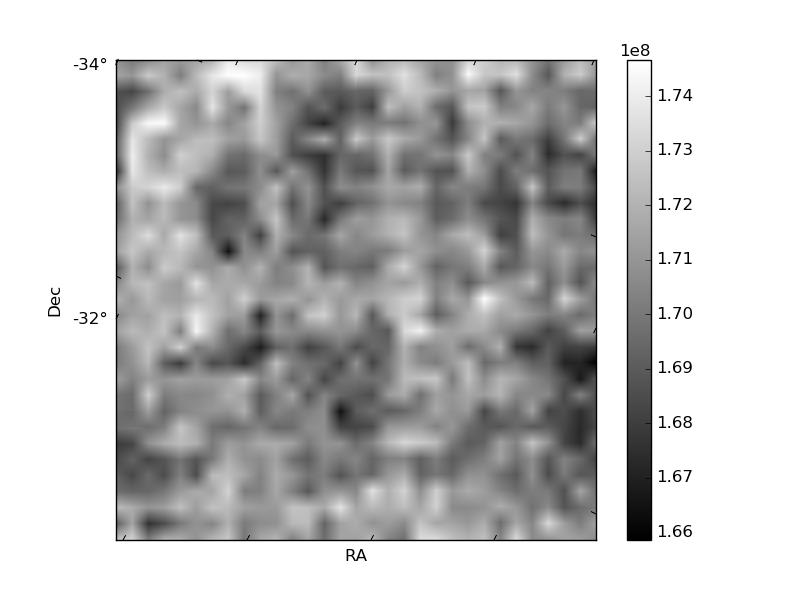
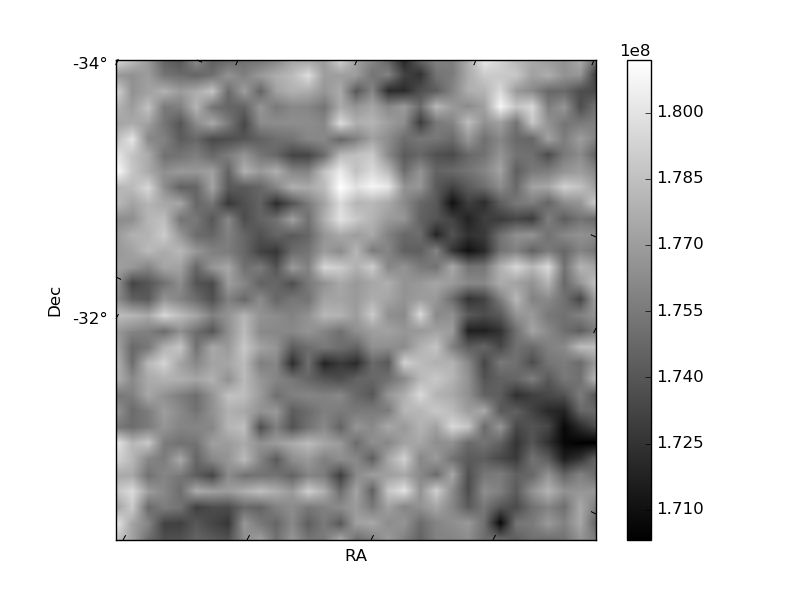
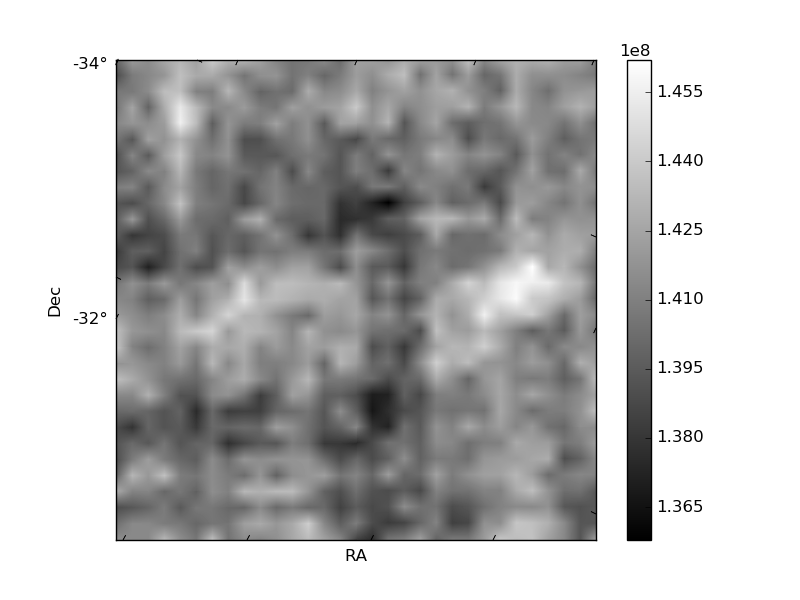
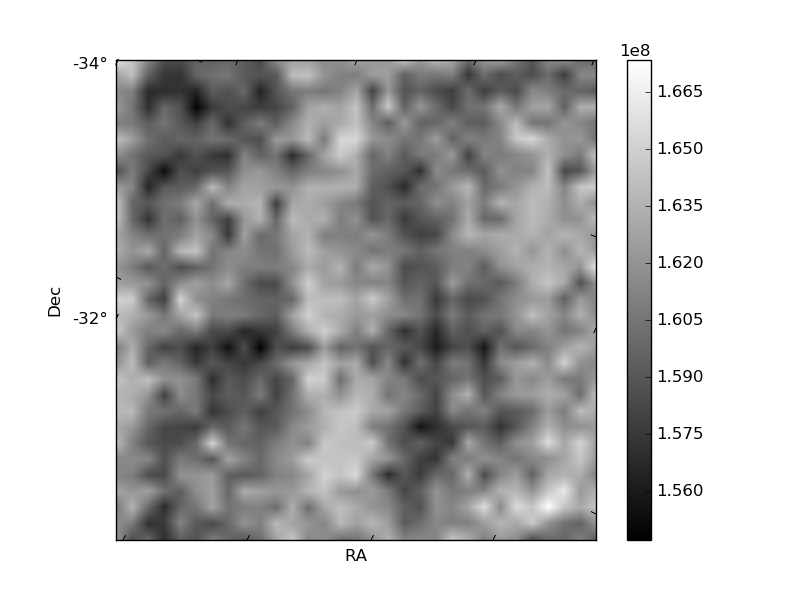
Histogram calculated using DETX and DETY for each event in the final _common_clean file
| Quadrant A | 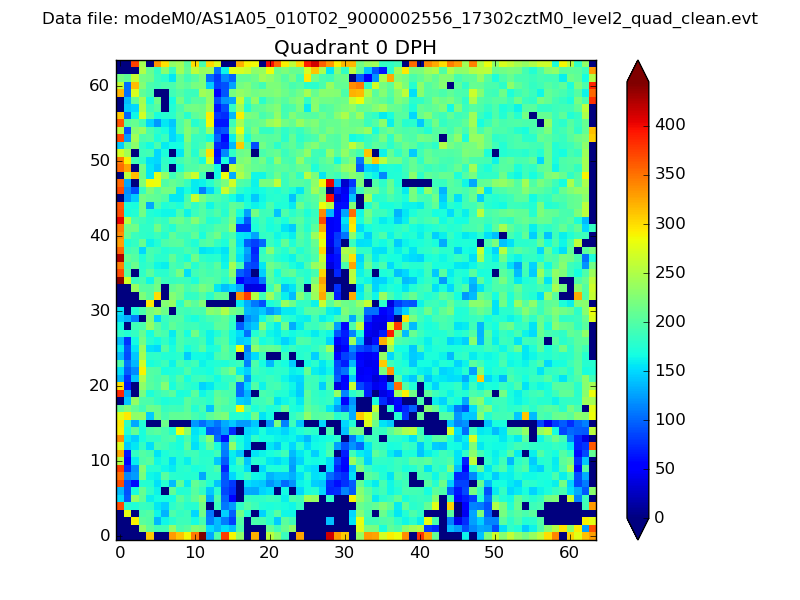 |
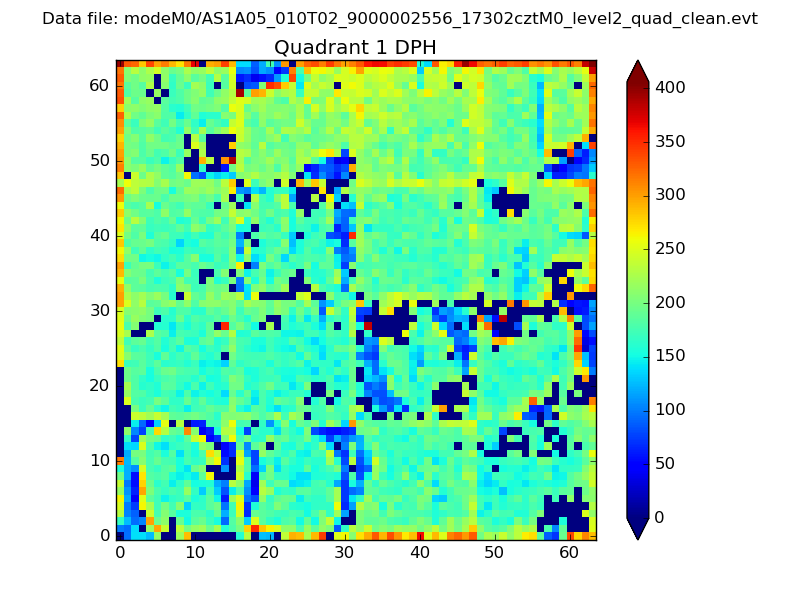 |
Quadrant B |
|---|---|---|---|
| Quadrant D | 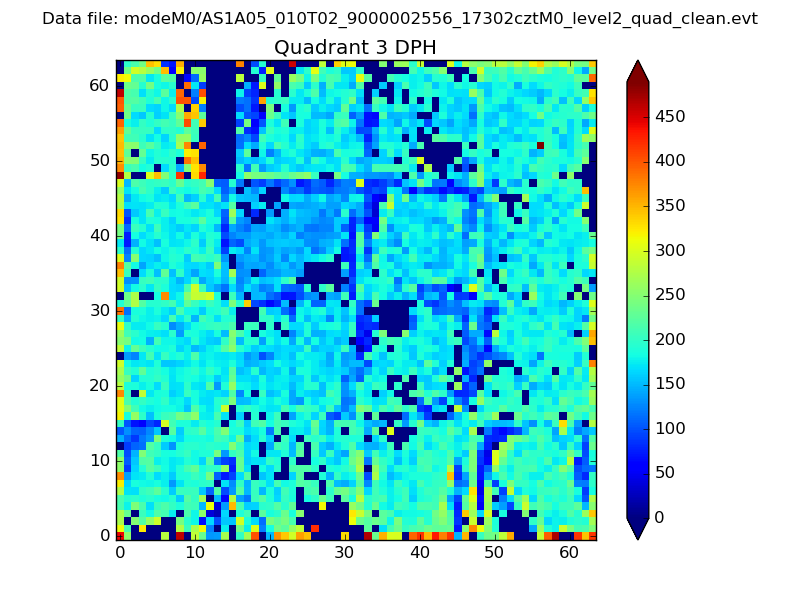 |
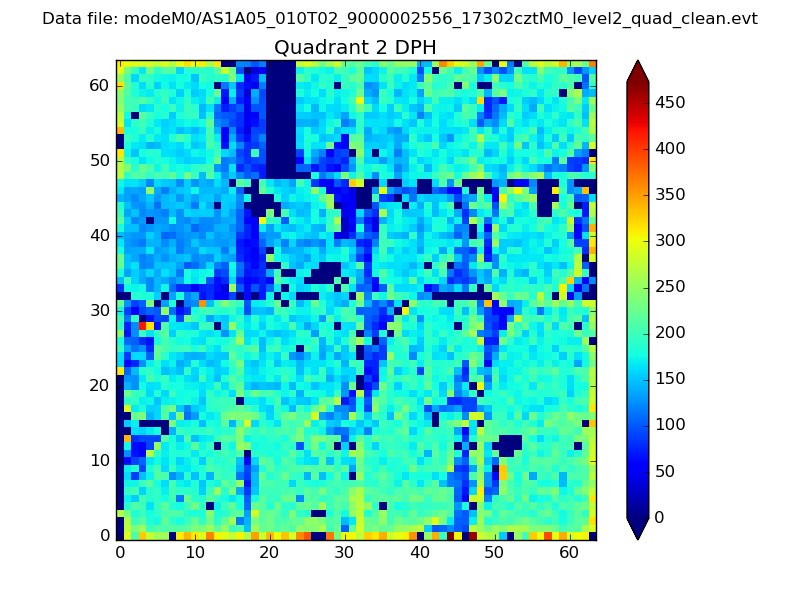 |
Quadrant C |
| Plot type | Count rate plots | Images |
|---|---|---|
| Comparison with Poisson distribution Blue bars denote a histogram of data divided into 1 sec bins. Red curve is a Poisson curve with rate = median count rate of data. |
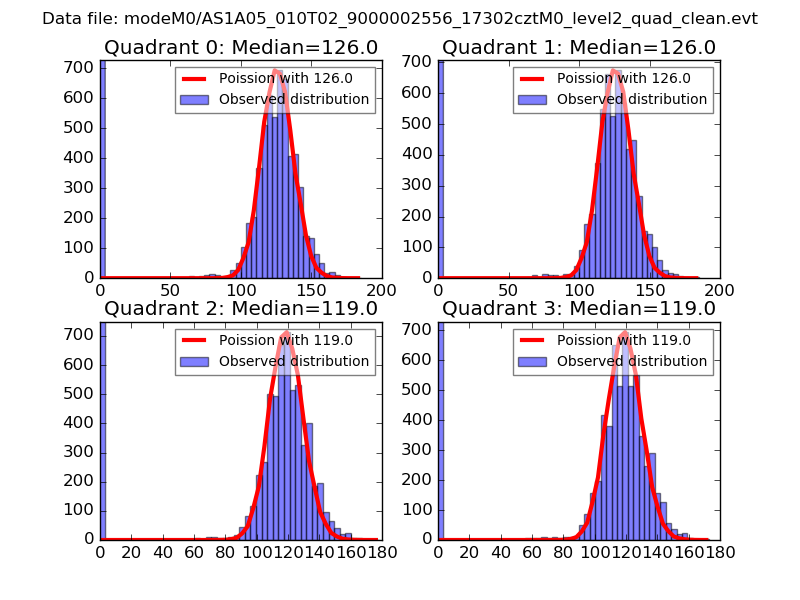 |
 |
| Quadrant-wise count rates Data is divided into 100 sec bins |
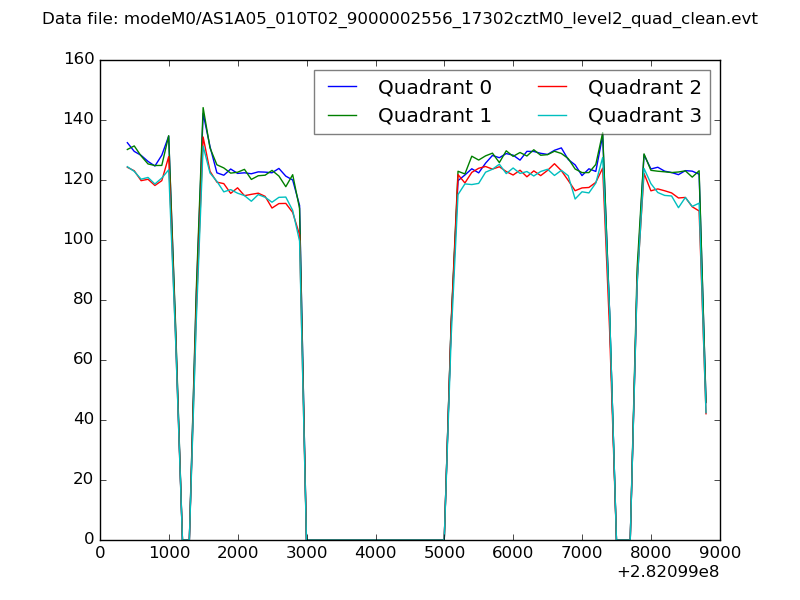 |
|
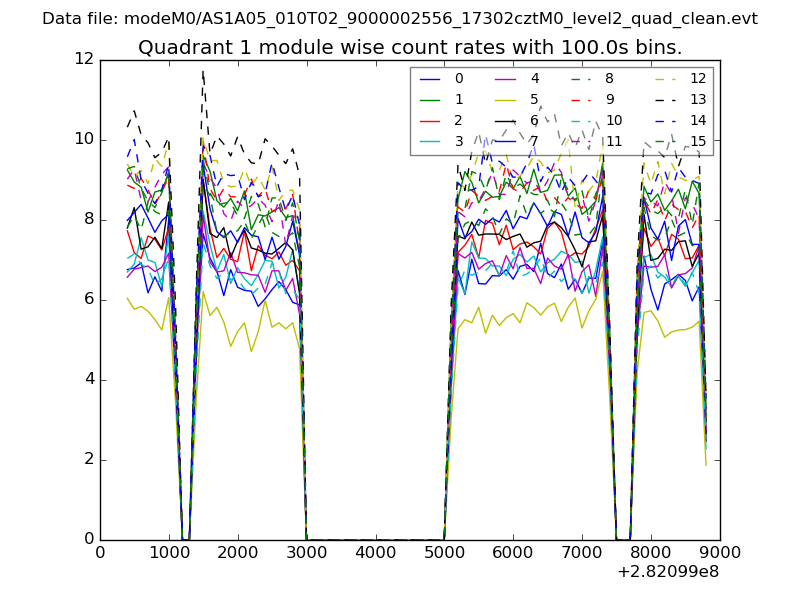
| Module-wise count rates for Quadrant A Data is divided into 100 sec bins |
 |
 |
| Module-wise count rates for Quadrant B Data is divided into 100 sec bins |
 |
 |
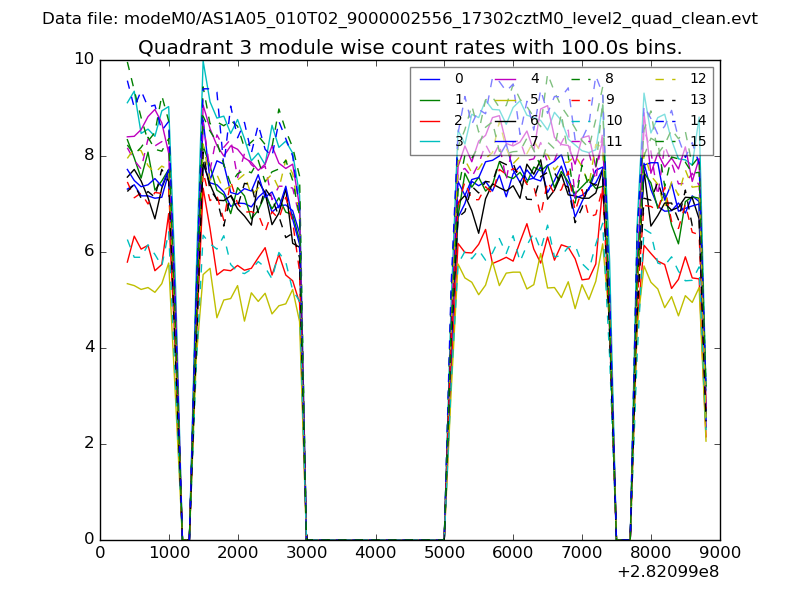
| Module-wise count rates for Quadrant C Data is divided into 100 sec bins |
 |
 |
| Module-wise count rates for Quadrant D Data is divided into 100 sec bins |
 |
 |
| Parameter | Plot |
|---|---|
| CZT HV Monitor | 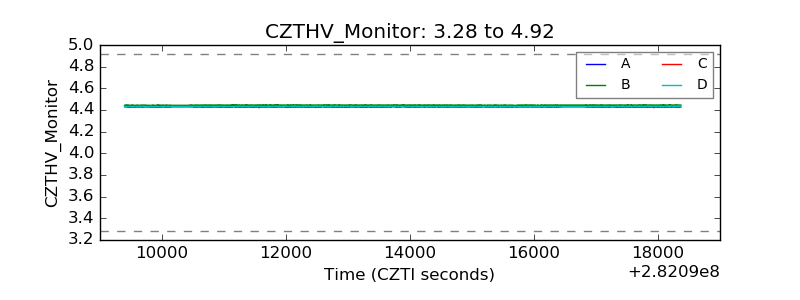 |
| D_VDD | 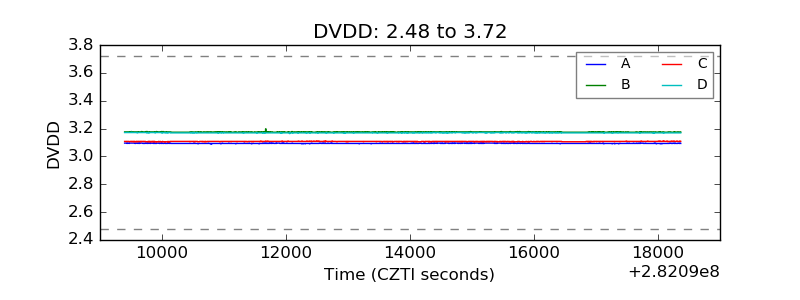 |
| Temperature 1 |  |
| Veto HV Monitor | 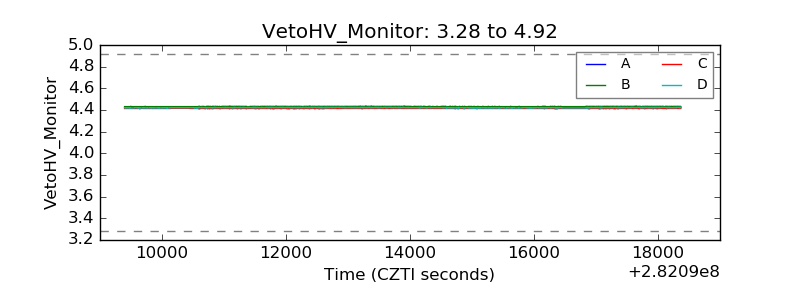 |
| Veto LLD | 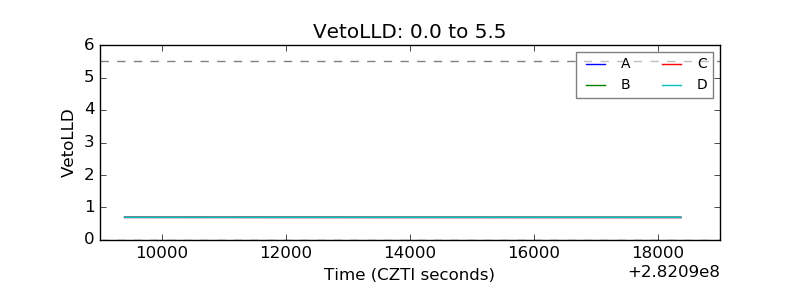 |
| Alpha Counter | 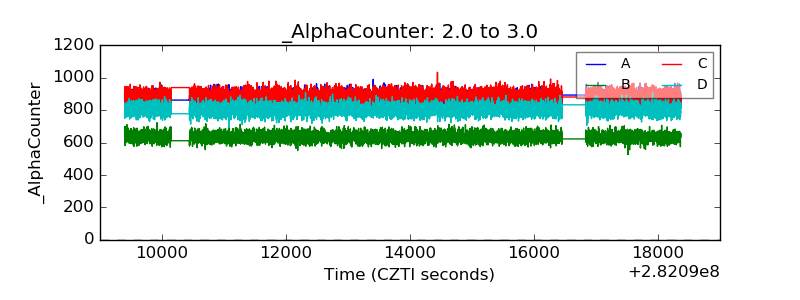 |
| _CPM_Rate | 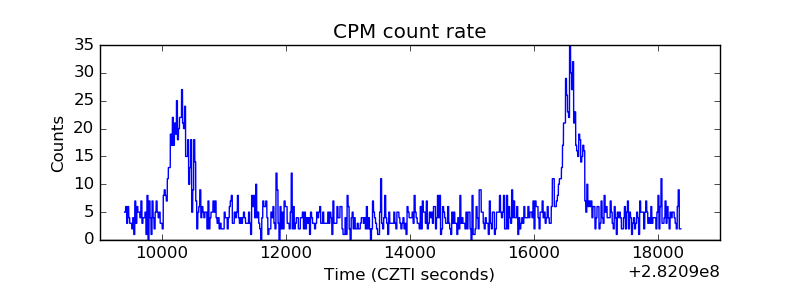 |
| CZT Counter | 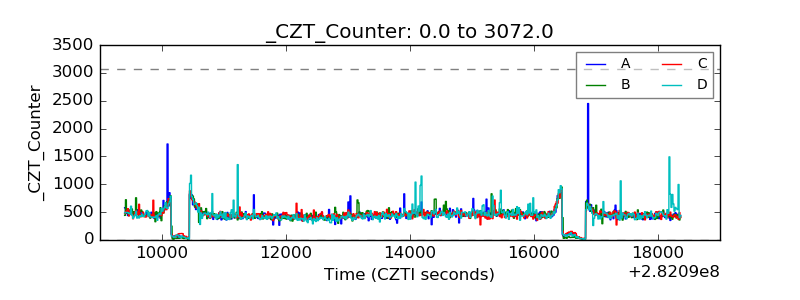 |
| +2.5 Volts monitor |  |
| +5 Volts monitor |  |
| _ROLL_ROT |  |
| _Roll_DEC | 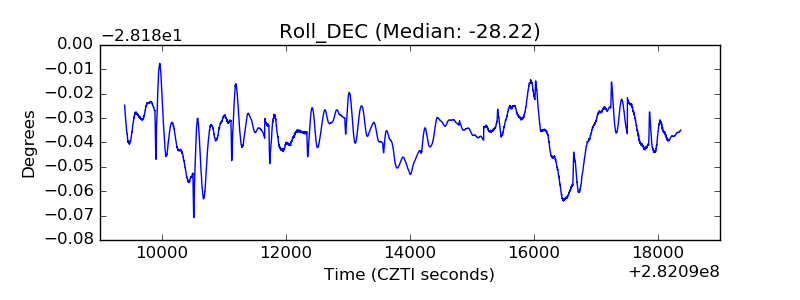 |
| _Roll_RA | 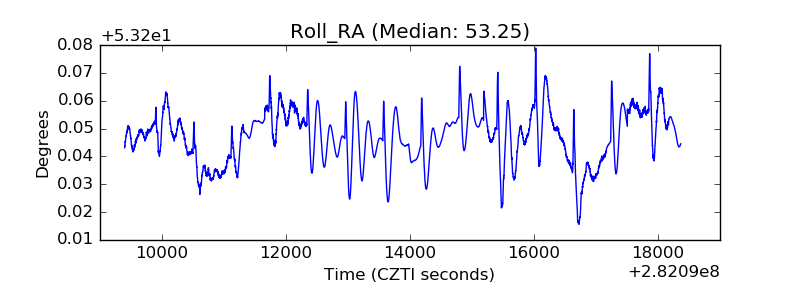 |
| Veto Counter |  |