| Param | Original file | Final file |
|---|---|---|
| Filename | modeM0/AS1A05_010T02_9000002556_17305cztM0_level2.evt | modeM0/AS1A05_010T02_9000002556_17305cztM0_level2_quad_clean.evt |
| Size (bytes) | 1,245,170,880 | 206,467,200 |
| Size | 1.2 GB | 196.9 MB |
| Events in quadrant A | 8,431,068 | 1,277,526 |
| Events in quadrant B | 8,382,842 | 1,282,826 |
| Events in quadrant C | 8,405,173 | 1,223,131 |
| Events in quadrant D | 11,255,163 | 1,210,089 |
| Mode M0 | |||
|---|---|---|---|
| Quadrant | BADHDUFLAG | Total packets | Discarded packets |
| A | 0 | 37515 | 3 |
| B | 0 | 37189 | 3 |
| C | 0 | 37163 | 3 |
| D | 0 | 46355 | 8 |
| Mode M9 | |||
|---|---|---|---|
| Quadrant | BADHDUFLAG | Total packets | Discarded packets |
| A | 0 | 20 | 0 |
| B | 0 | 20 | 0 |
| C | 0 | 20 | 0 |
| D | 0 | 20 | 0 |
| Mode SS | |||
|---|---|---|---|
| Quadrant | BADHDUFLAG | Total packets | Discarded packets |
| A | 0 | 370 | 0 |
| B | 0 | 370 | 0 |
| C | 0 | 370 | 0 |
| D | 0 | 370 | 0 |
| Quadrant | Total seconds | Saturated seconds | Saturation percentage |
|---|---|---|---|
| A | 18276 | 139 | 0.760560% |
| B | 18277 | 158 | 0.864474% |
| C | 18277 | 206 | 1.127100% |
| D | 18276 | 635 | 3.474502% |
Noise dominated data is calculated using 1-second bins in cleaned event files. If a bin has >2000 counts, and if more than 50% of those come from <1% of pixels, then it is considered to be noise-dominated and hence unusable.
| Quadrant | # 1 sec bins | Bins with >0 counts | Bins with >2000 counts | High rate bins dominated by noise | Noise dominated (total time) | Noise dominated (detector-on time) | Marked lightcurve |
|---|---|---|---|---|---|---|---|
| A | 20206 | 18278 | 17 | 17 | 0.08% | 0.09% | 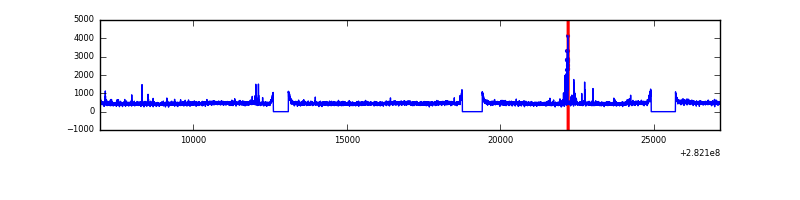 |
| B | 20207 | 18279 | 1 | 1 | 0.00% | 0.01% | 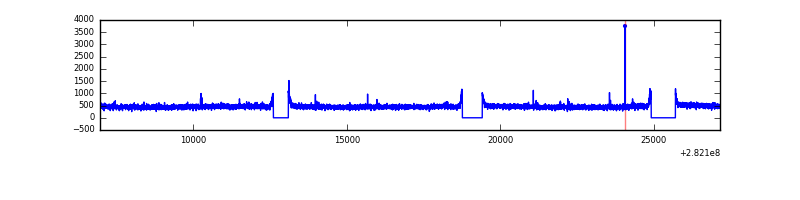 |
| C | 20207 | 18278 | 0 | 0 | 0.00% | 0.00% | 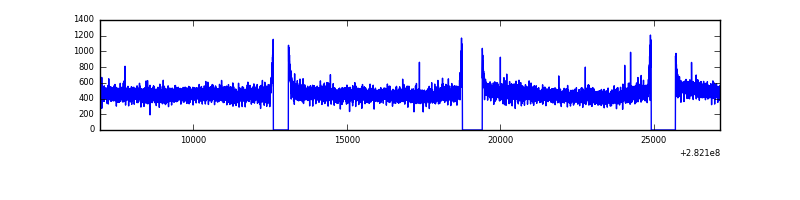 |
| D | 20206 | 18277 | 405 | 405 | 2.00% | 2.22% | 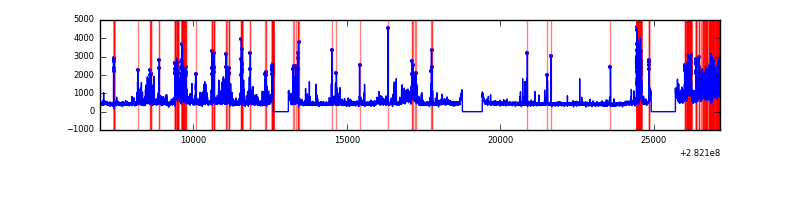 |
Top three noisy pixels from each quadrant. If the there are fewer than three noisy pixels in the level2.evt file, extra rows are filled as -1
| Pixel properties | Quadrant properties | ||||||
|---|---|---|---|---|---|---|---|
| Quadrant | DetID | PixID | Counts | Sigma | Mean | Median | Sigma |
| A | 4 | 2 | 135370 | 310.62 | 2138 | 2092 | 429.1 |
| A | 0 | 23 | 66381 | 149.83 | 2138 | 2092 | 429.1 |
| A | 0 | 226 | 22143 | 46.73 | 2138 | 2092 | 429.1 |
| B | 12 | 111 | 51190 | 119.37 | 2135 | 2078 | 411.4 |
| B | 11 | 111 | 45057 | 104.47 | 2135 | 2078 | 411.4 |
| B | 14 | 111 | 39468 | 90.88 | 2135 | 2078 | 411.4 |
| C | 14 | 238 | 315916 | 652.96 | 2052 | 2066 | 480.7 |
| C | 3 | 233 | 89721 | 182.37 | 2052 | 2066 | 480.7 |
| C | 13 | 61 | 14560 | 25.99 | 2052 | 2066 | 480.7 |
| D | 5 | 222 | 2100065 | 4202.68 | 2056 | 1995 | 499.2 |
| D | 11 | 176 | 994345 | 1987.79 | 2056 | 1995 | 499.2 |
| D | 2 | 152 | 167123 | 330.77 | 2056 | 1995 | 499.2 |
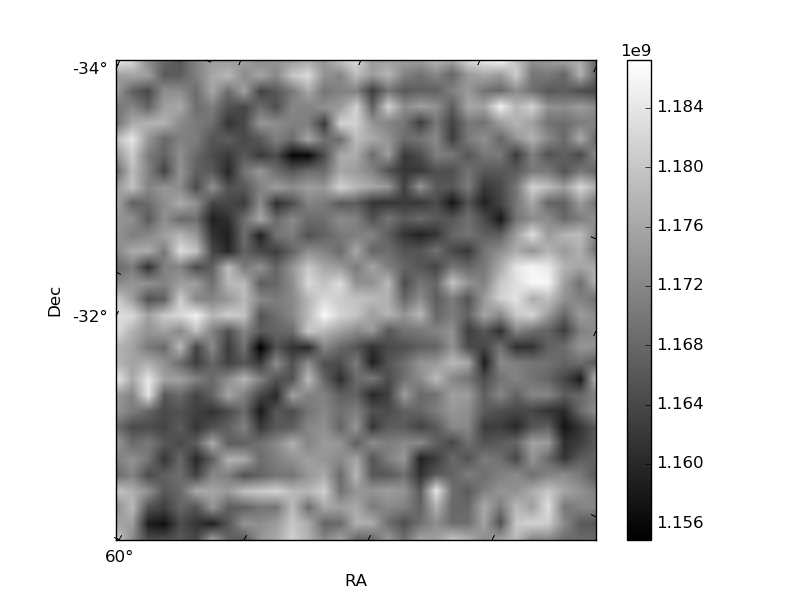
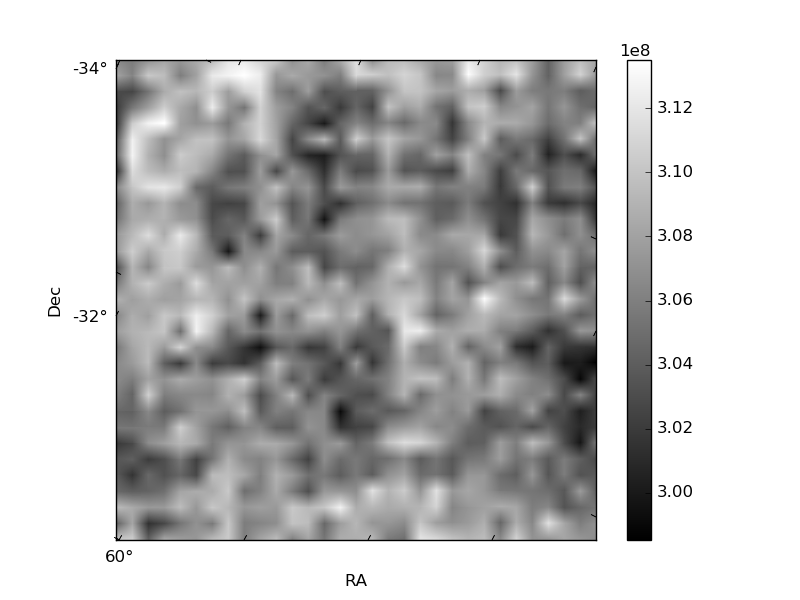
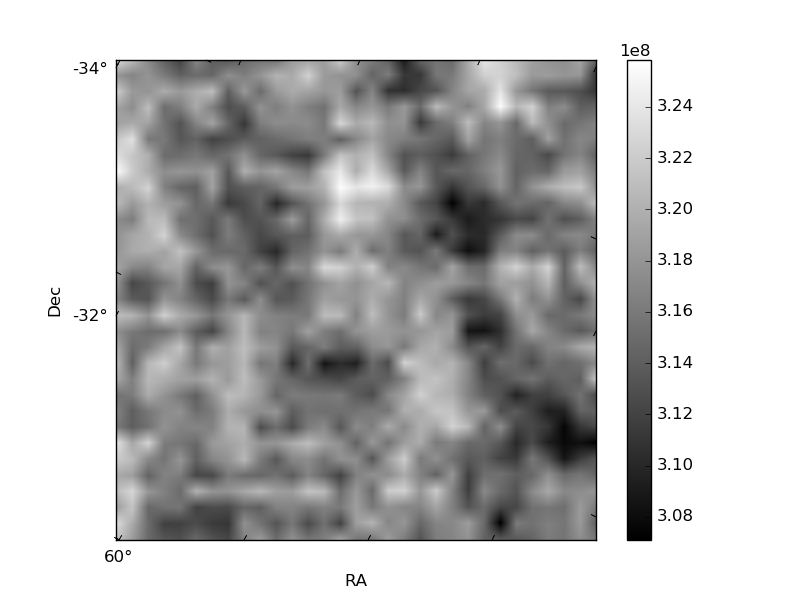
Histogram calculated using DETX and DETY for each event in the final _common_clean file
| Quadrant A | 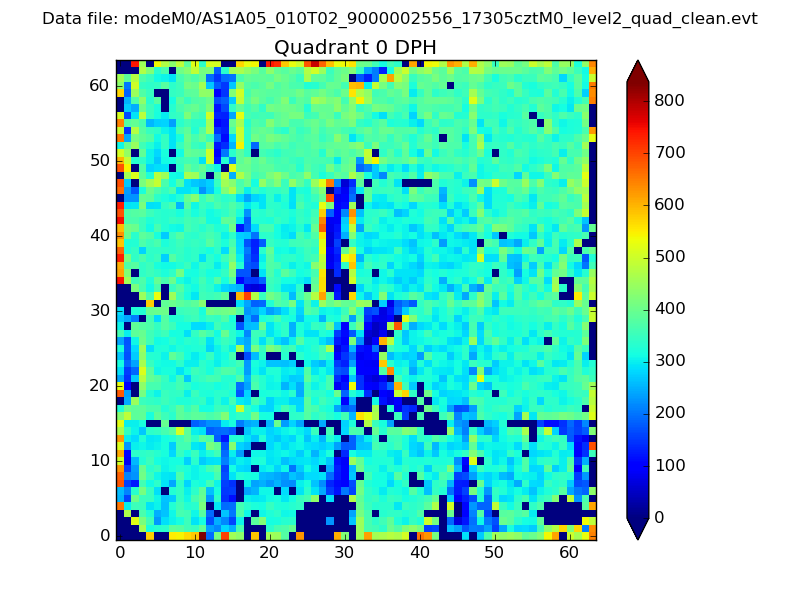 |
 |
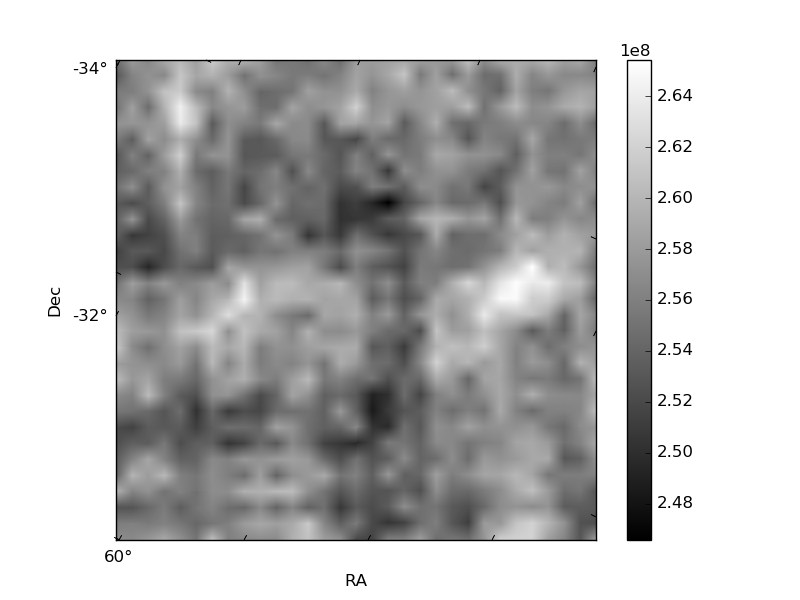
Quadrant B |
|---|---|---|---|
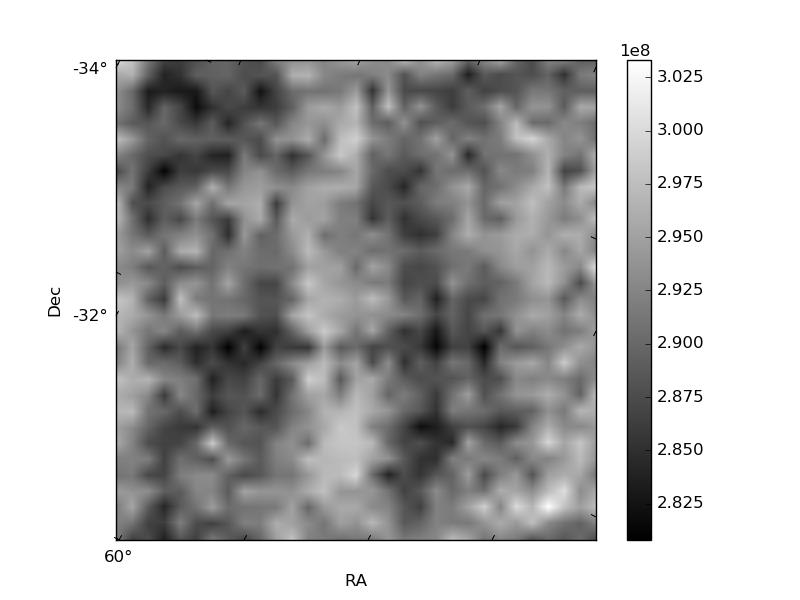
| Quadrant D | 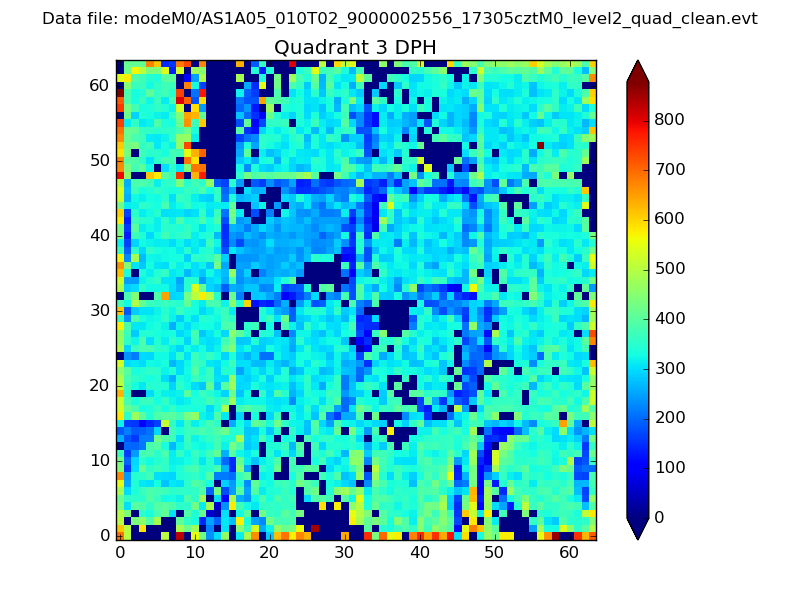 |
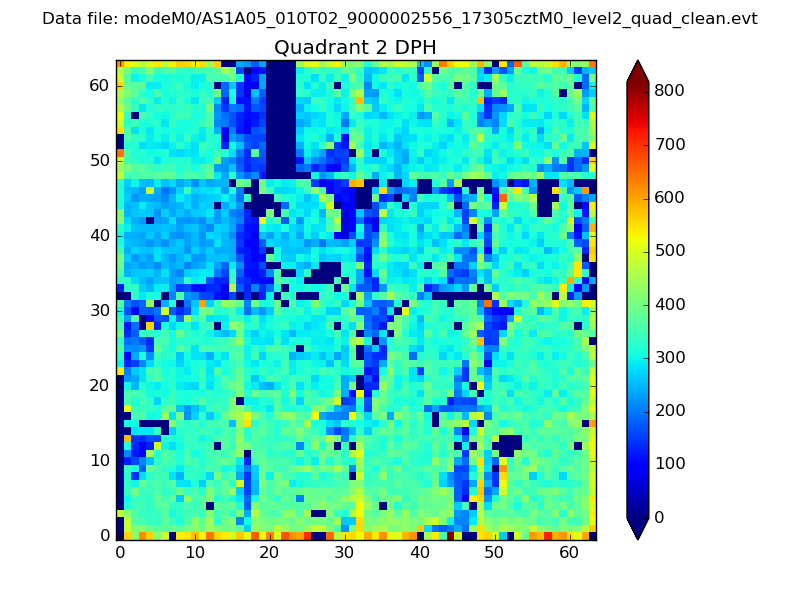 |
Quadrant C |
| Plot type | Count rate plots | Images |
|---|---|---|
| Comparison with Poisson distribution Blue bars denote a histogram of data divided into 1 sec bins. Red curve is a Poisson curve with rate = median count rate of data. |
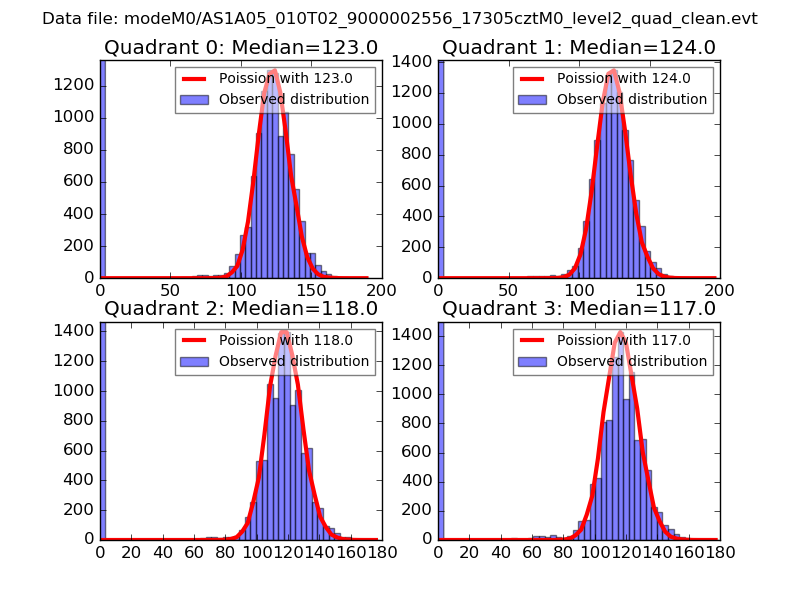 |
 |
| Quadrant-wise count rates Data is divided into 100 sec bins |
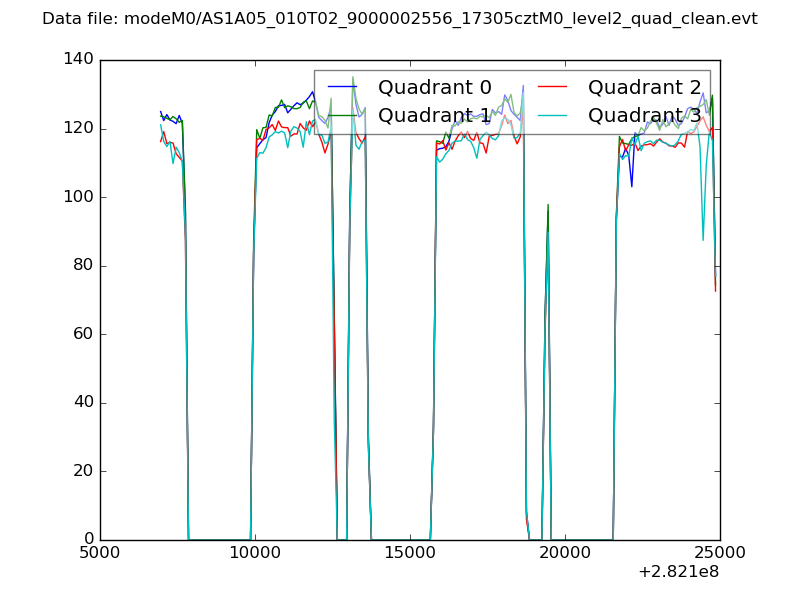 |
|
| Module-wise count rates for Quadrant A Data is divided into 100 sec bins |
 |
 |
| Module-wise count rates for Quadrant B Data is divided into 100 sec bins |
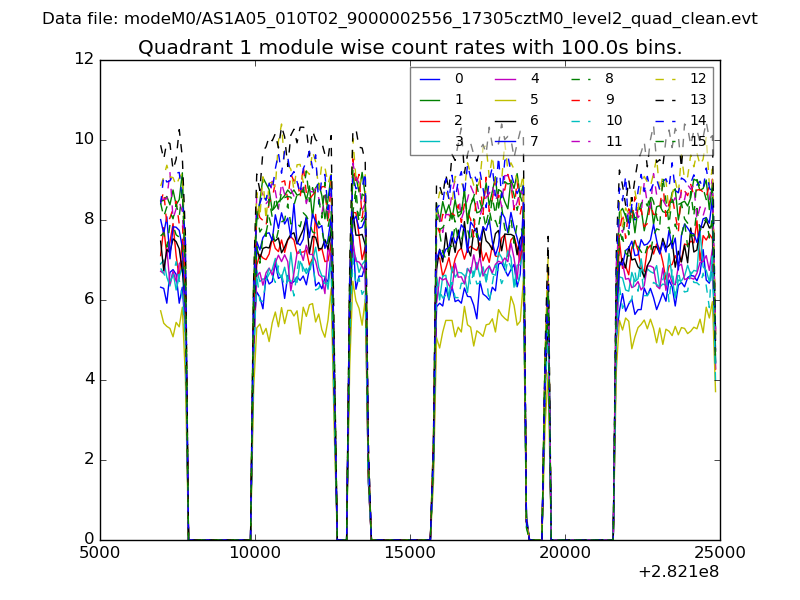 |
 |
| Module-wise count rates for Quadrant C Data is divided into 100 sec bins |
 |
 |
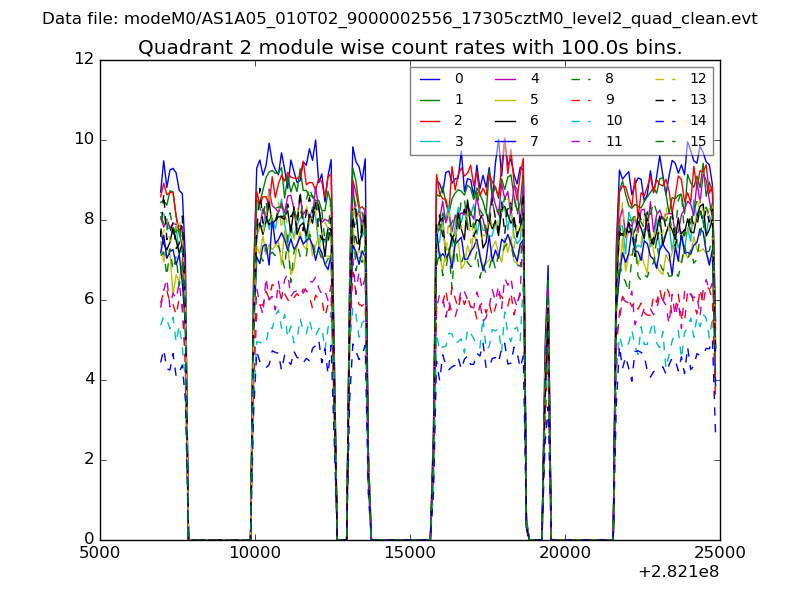
| Module-wise count rates for Quadrant D Data is divided into 100 sec bins |
 |
 |
| Parameter | Plot |
|---|---|
| CZT HV Monitor |  |
| D_VDD | 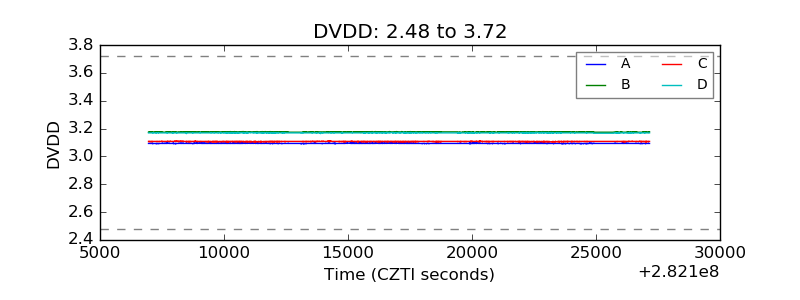 |
| Temperature 1 |  |
| Veto HV Monitor | 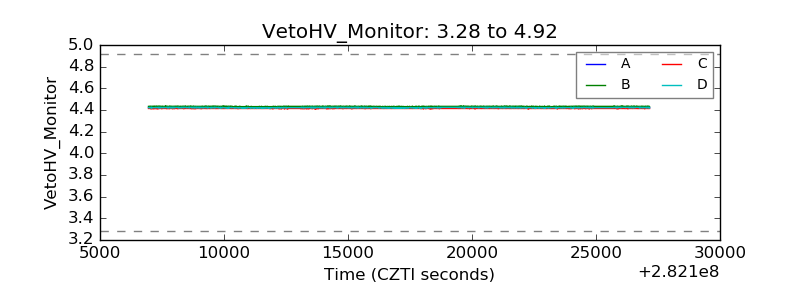 |
| Veto LLD | 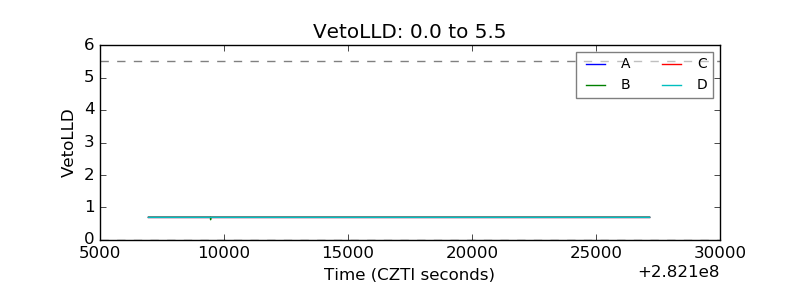 |
| Alpha Counter | 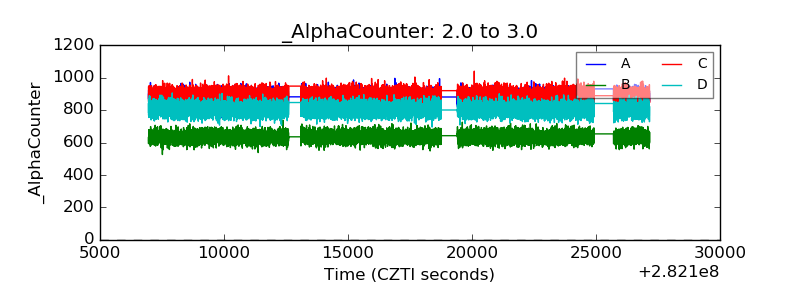 |
| _CPM_Rate | 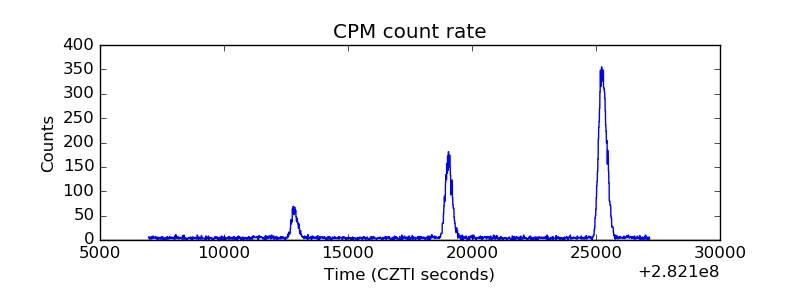 |
| CZT Counter | 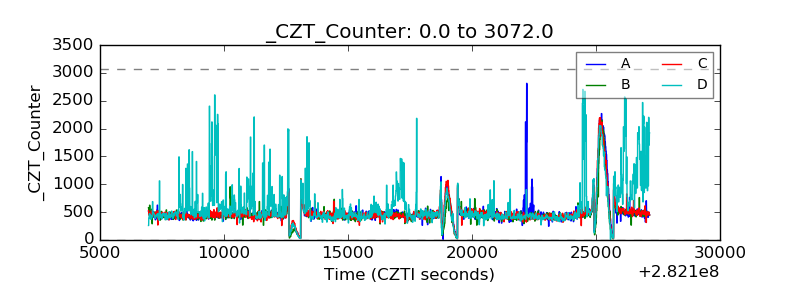 |
| +2.5 Volts monitor |  |
| +5 Volts monitor |  |
| _ROLL_ROT | 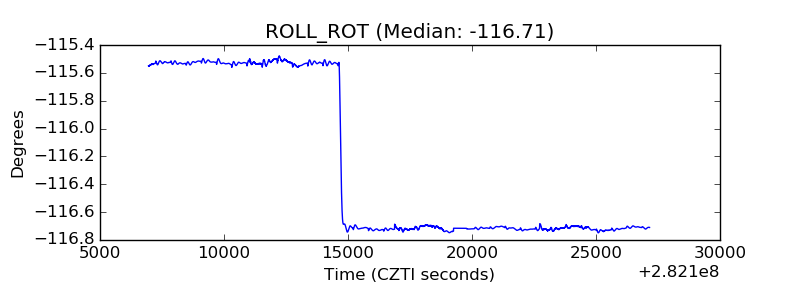 |
| _Roll_DEC | 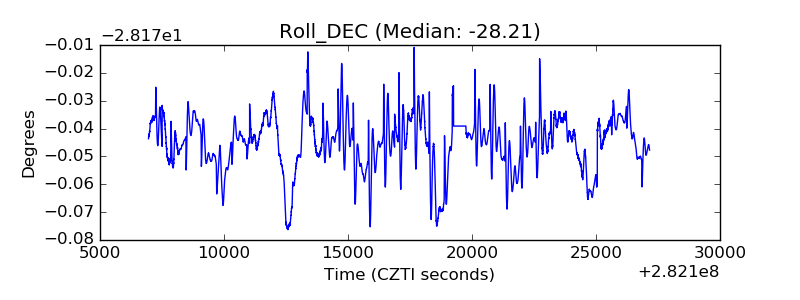 |
| _Roll_RA | 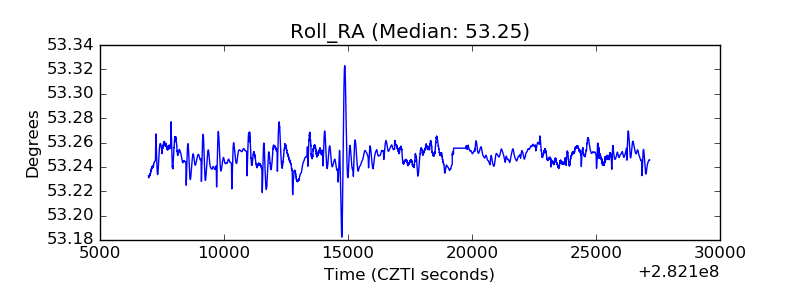 |
| Veto Counter | 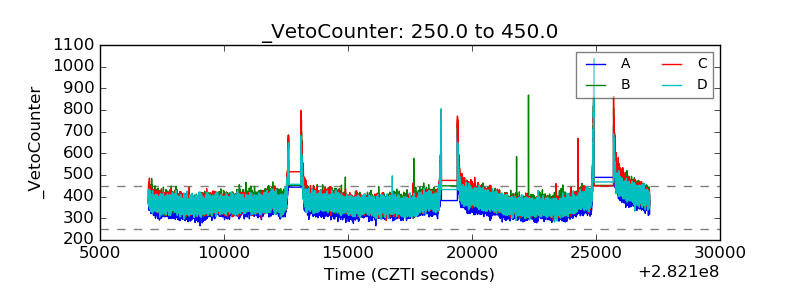 |