| Param | Original file | Final file |
|---|---|---|
| Filename | modeM0/AS1A05_010T02_9000002556_17306cztM0_level2.evt | modeM0/AS1A05_010T02_9000002556_17306cztM0_level2_quad_clean.evt |
| Size (bytes) | 576,020,160 | 71,069,760 |
| Size | 549.3 MB | 67.8 MB |
| Events in quadrant A | 3,238,644 | 436,905 |
| Events in quadrant B | 3,243,623 | 439,394 |
| Events in quadrant C | 3,231,748 | 418,529 |
| Events in quadrant D | 7,272,503 | 385,406 |
| Mode M0 | |||
|---|---|---|---|
| Quadrant | BADHDUFLAG | Total packets | Discarded packets |
| A | 0 | 14017 | 2 |
| B | 0 | 13992 | 2 |
| C | 0 | 14014 | 2 |
| D | 0 | 26353 | 2 |
| Mode M9 | |||
|---|---|---|---|
| Quadrant | BADHDUFLAG | Total packets | Discarded packets |
| A | 0 | 13 | 0 |
| B | 0 | 14 | 0 |
| C | 0 | 14 | 0 |
| D | 0 | 14 | 0 |
| Mode SS | |||
|---|---|---|---|
| Quadrant | BADHDUFLAG | Total packets | Discarded packets |
| A | 0 | 136 | 0 |
| B | 0 | 136 | 0 |
| C | 0 | 136 | 0 |
| D | 0 | 136 | 0 |
| Quadrant | Total seconds | Saturated seconds | Saturation percentage |
|---|---|---|---|
| A | 6766 | 98 | 1.448419% |
| B | 6766 | 101 | 1.492758% |
| C | 6766 | 122 | 1.803133% |
| D | 6766 | 899 | 13.287023% |
Noise dominated data is calculated using 1-second bins in cleaned event files. If a bin has >2000 counts, and if more than 50% of those come from <1% of pixels, then it is considered to be noise-dominated and hence unusable.
| Quadrant | # 1 sec bins | Bins with >0 counts | Bins with >2000 counts | High rate bins dominated by noise | Noise dominated (total time) | Noise dominated (detector-on time) | Marked lightcurve |
|---|---|---|---|---|---|---|---|
| A | 7697 | 6767 | 3 | 3 | 0.04% | 0.04% | 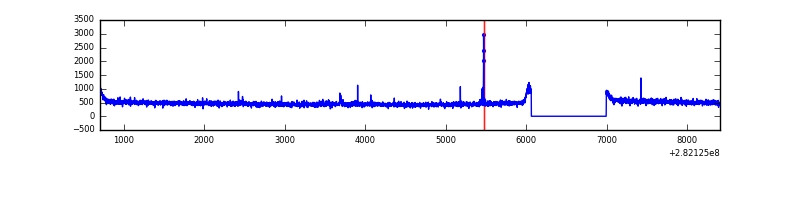 |
| B | 7697 | 6767 | 0 | 0 | 0.00% | 0.00% | 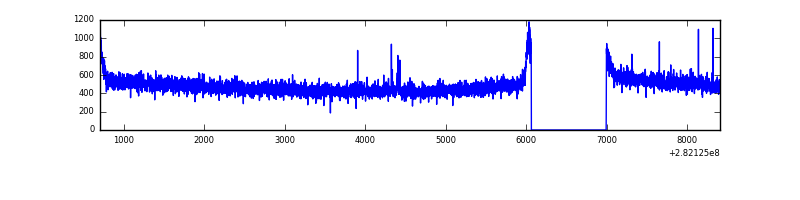 |
| C | 7697 | 6767 | 1 | 1 | 0.01% | 0.01% | 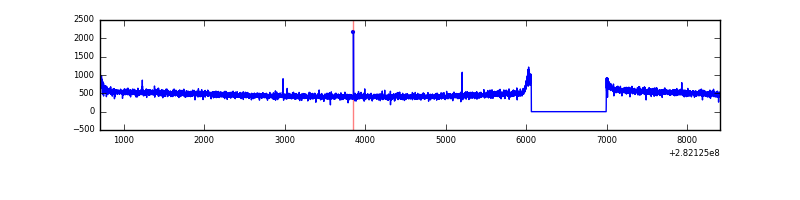 |
| D | 7697 | 6767 | 682 | 682 | 8.86% | 10.08% | 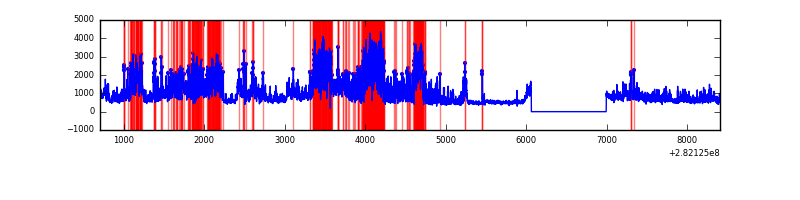 |
Top three noisy pixels from each quadrant. If the there are fewer than three noisy pixels in the level2.evt file, extra rows are filled as -1
| Pixel properties | Quadrant properties | ||||||
|---|---|---|---|---|---|---|---|
| Quadrant | DetID | PixID | Counts | Sigma | Mean | Median | Sigma |
| A | 4 | 2 | 34527 | 201.99 | 827 | 808 | 166.9 |
| A | 0 | 23 | 22885 | 132.25 | 827 | 808 | 166.9 |
| A | 0 | 226 | 8368 | 45.29 | 827 | 808 | 166.9 |
| B | 12 | 111 | 19762 | 119.2 | 825 | 802 | 159.1 |
| B | 11 | 111 | 17205 | 103.13 | 825 | 802 | 159.1 |
| B | 14 | 111 | 15168 | 90.32 | 825 | 802 | 159.1 |
| C | 14 | 238 | 123127 | 656.21 | 791 | 796 | 186.4 |
| C | 3 | 233 | 20086 | 103.48 | 791 | 796 | 186.4 |
| C | 13 | 61 | 5436 | 24.89 | 791 | 796 | 186.4 |
| D | 5 | 222 | 3813679 | 20372.78 | 774 | 751 | 187.2 |
| D | 11 | 176 | 376670 | 2008.57 | 774 | 751 | 187.2 |
| D | 13 | 170 | 86426 | 457.77 | 774 | 751 | 187.2 |
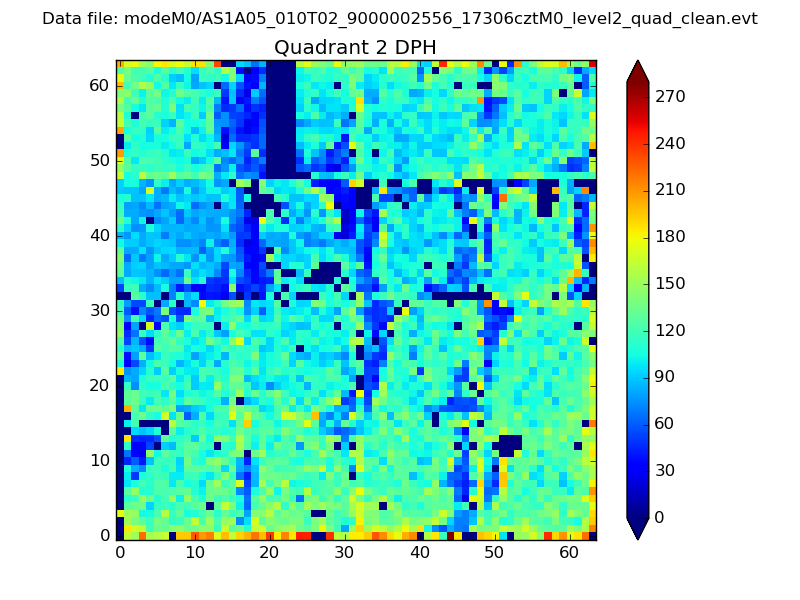
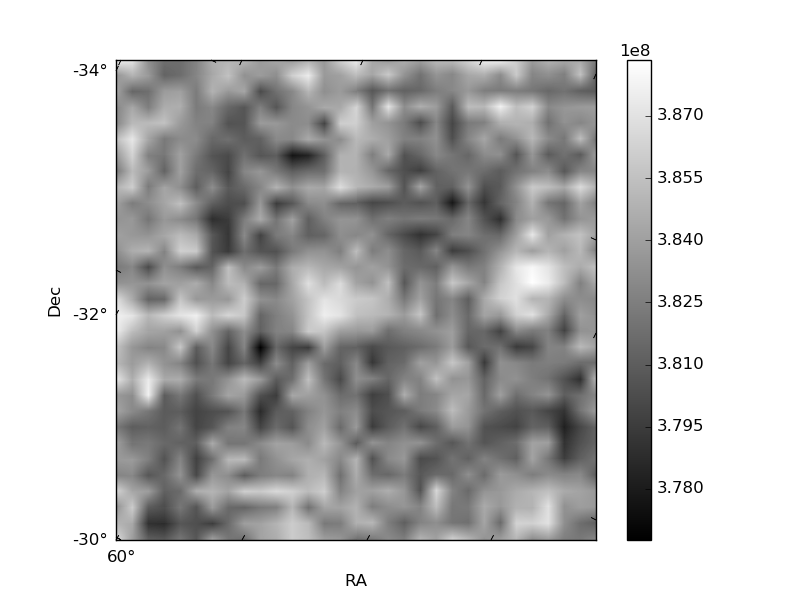
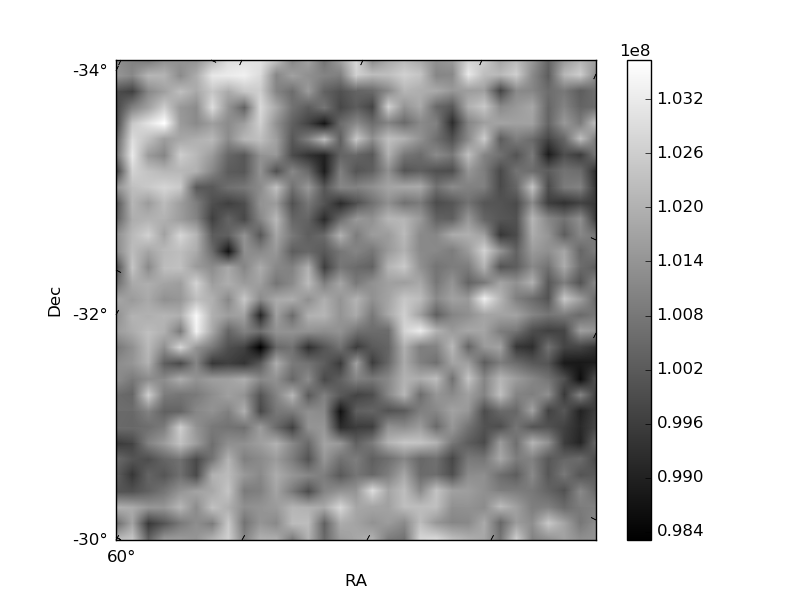
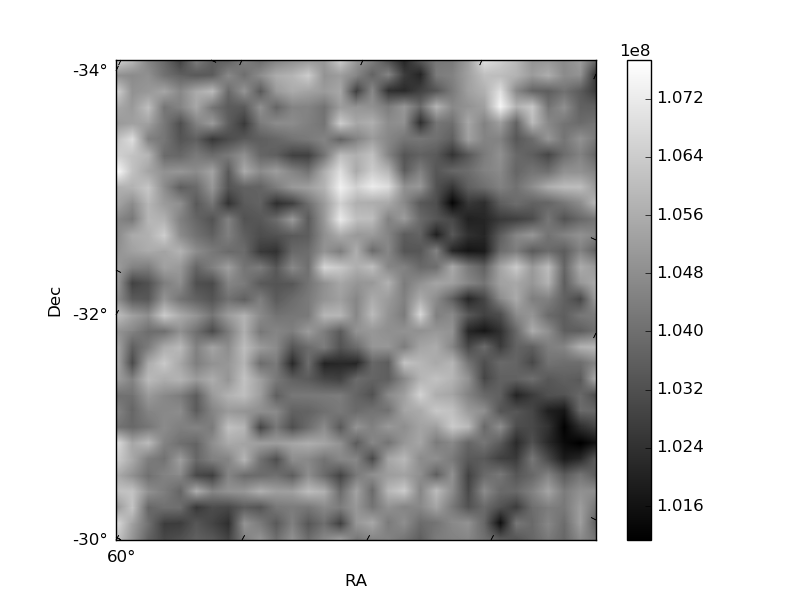
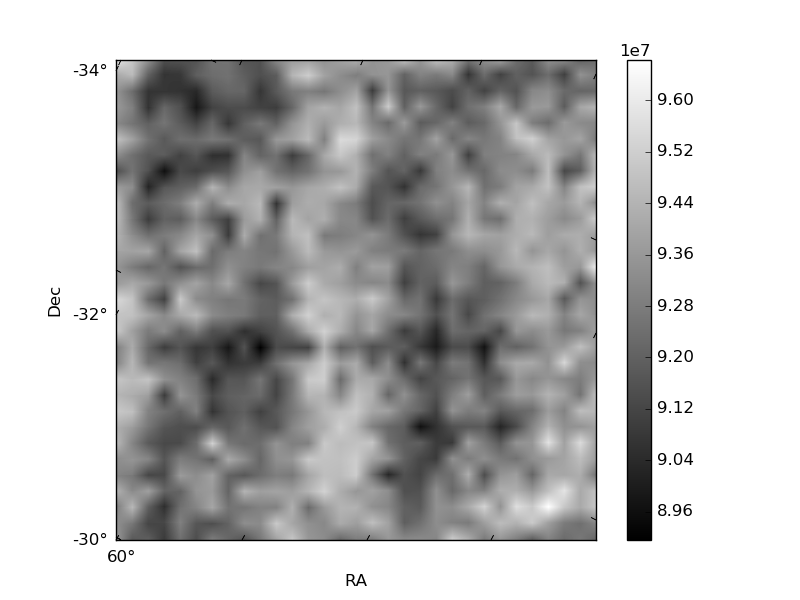
Histogram calculated using DETX and DETY for each event in the final _common_clean file
| Quadrant A | 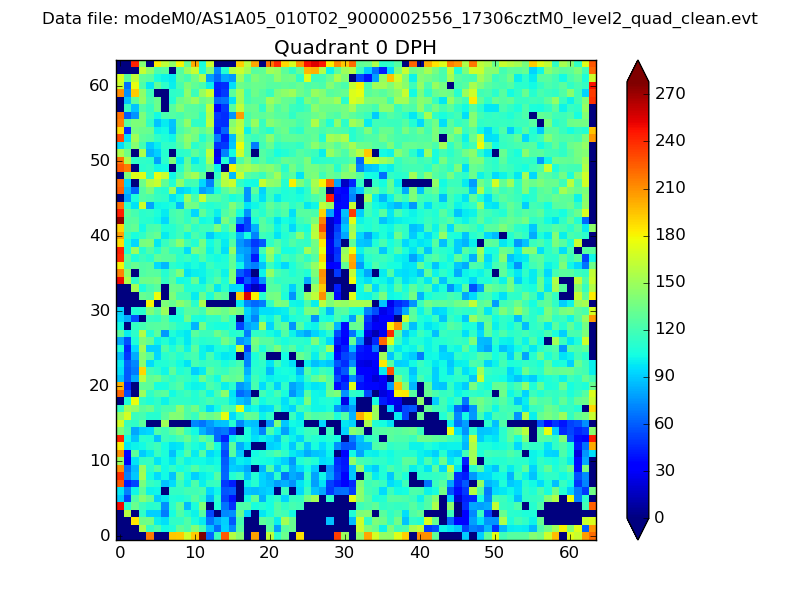 |
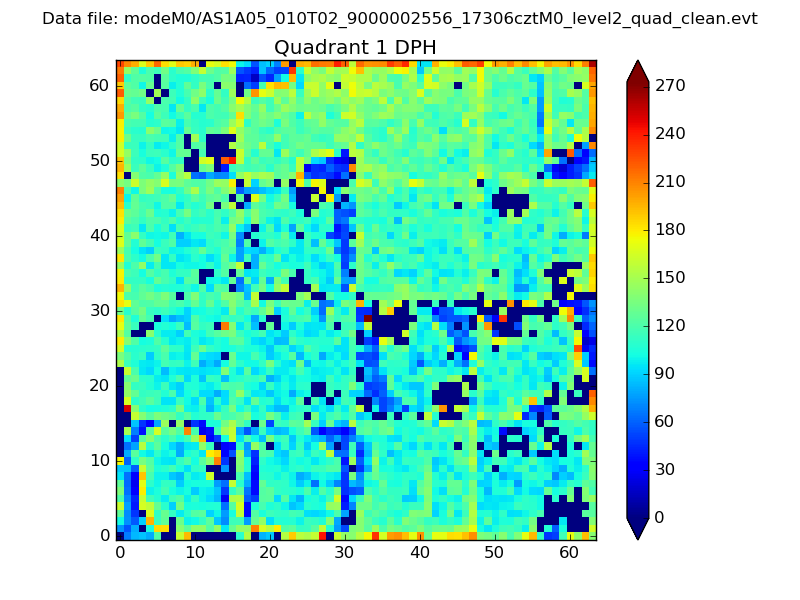 |
Quadrant B |
|---|---|---|---|
| Quadrant D | 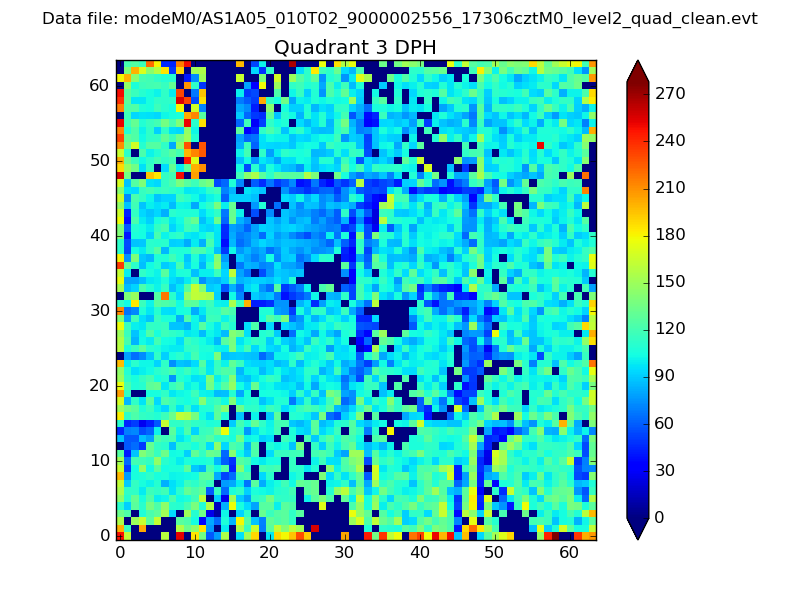 |
 |
Quadrant C |
| Plot type | Count rate plots | Images |
|---|---|---|
| Comparison with Poisson distribution Blue bars denote a histogram of data divided into 1 sec bins. Red curve is a Poisson curve with rate = median count rate of data. |
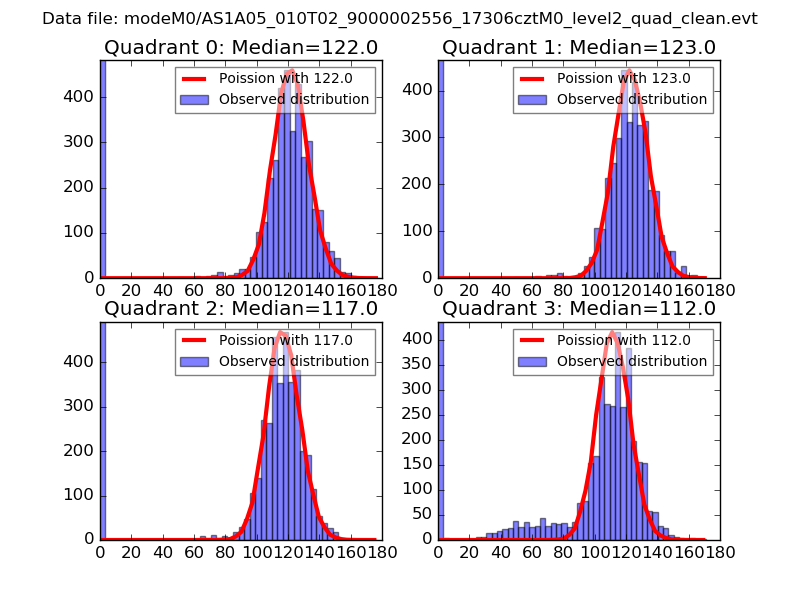 |
 |
| Quadrant-wise count rates Data is divided into 100 sec bins |
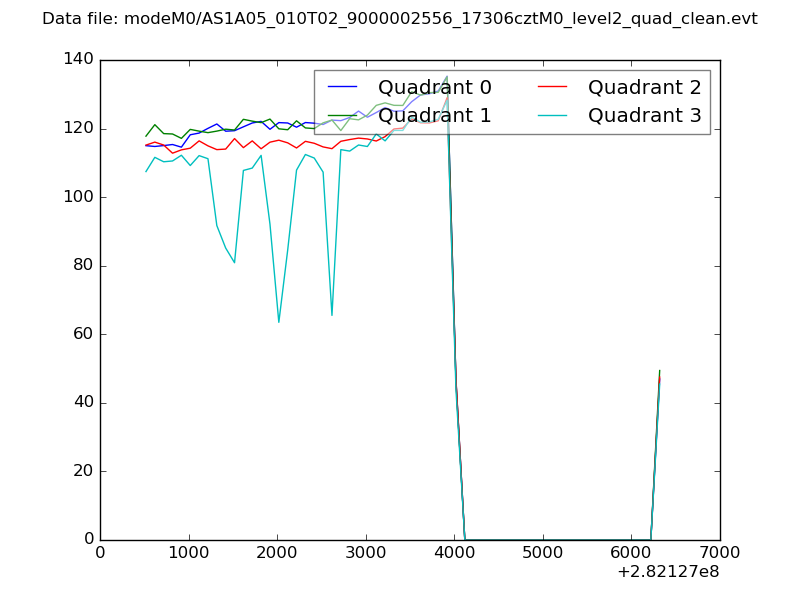 |
|
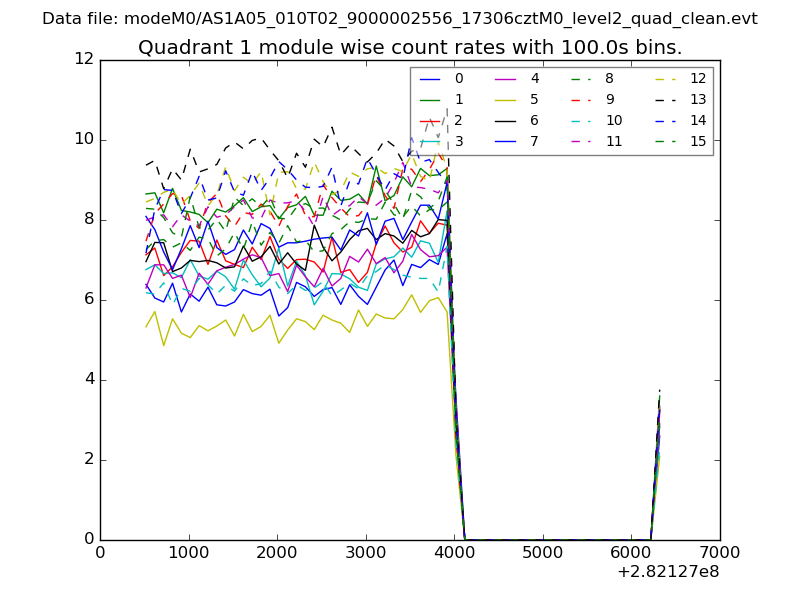
| Module-wise count rates for Quadrant A Data is divided into 100 sec bins |
 |
 |
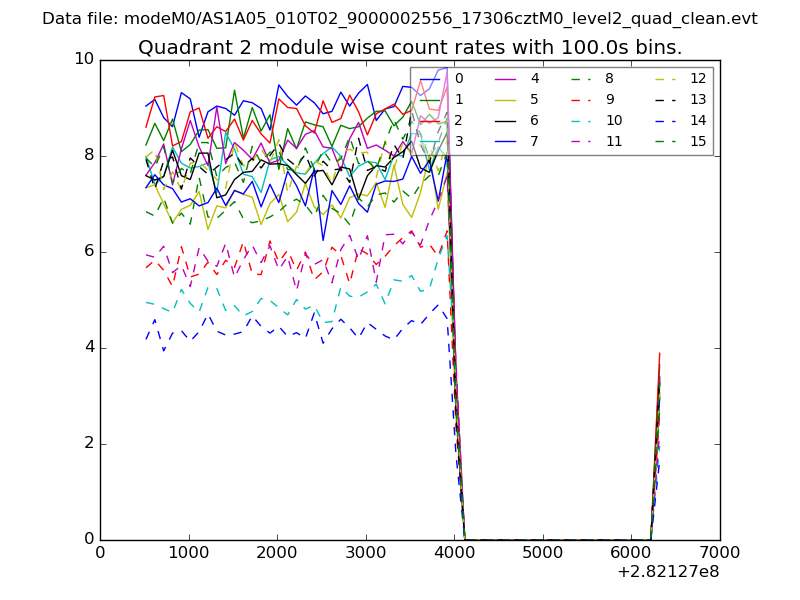
| Module-wise count rates for Quadrant B Data is divided into 100 sec bins |
 |
 |
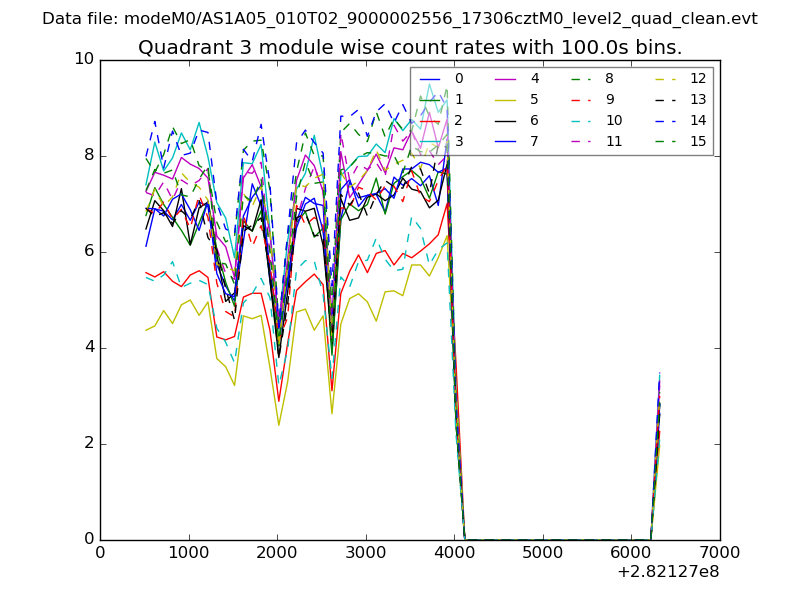
| Module-wise count rates for Quadrant C Data is divided into 100 sec bins |
 |
 |
| Module-wise count rates for Quadrant D Data is divided into 100 sec bins |
 |
 |
| Parameter | Plot |
|---|---|
| CZT HV Monitor | 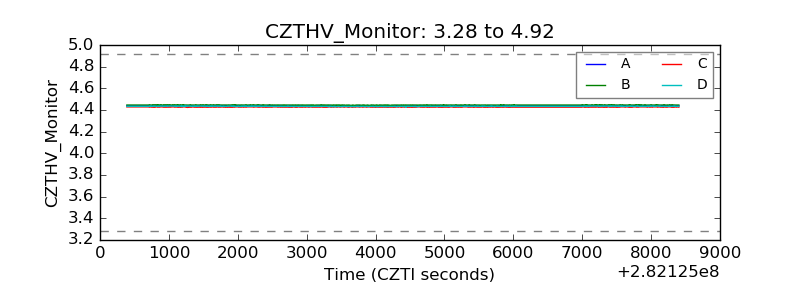 |
| D_VDD | 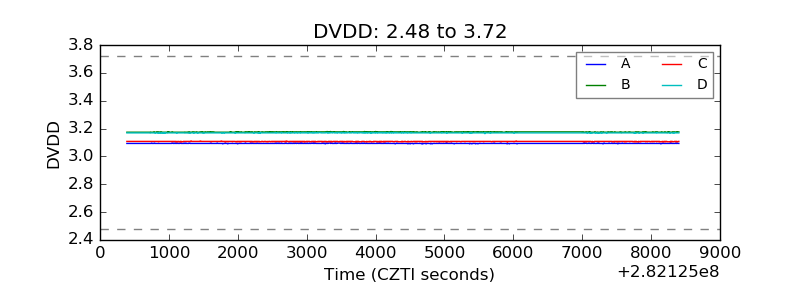 |
| Temperature 1 | 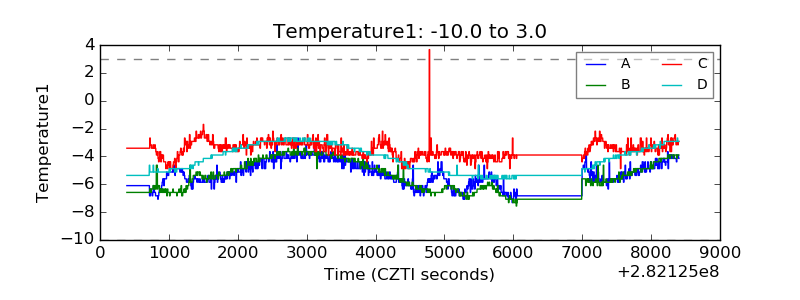 |
| Veto HV Monitor | 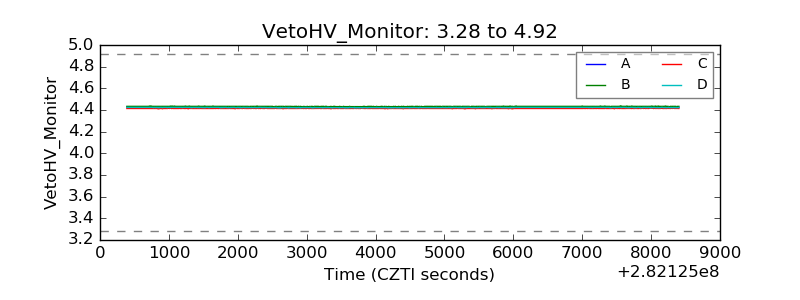 |
| Veto LLD | 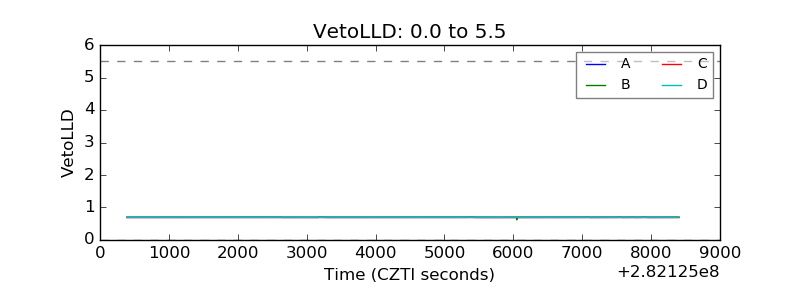 |
| Alpha Counter | 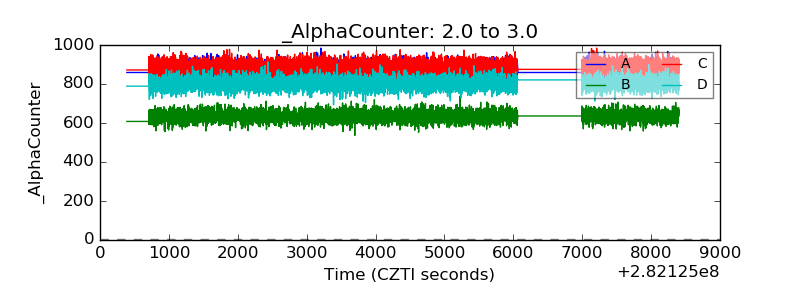 |
| _CPM_Rate | 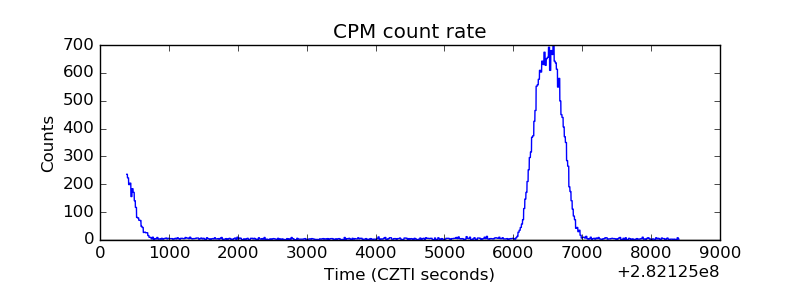 |
| CZT Counter | 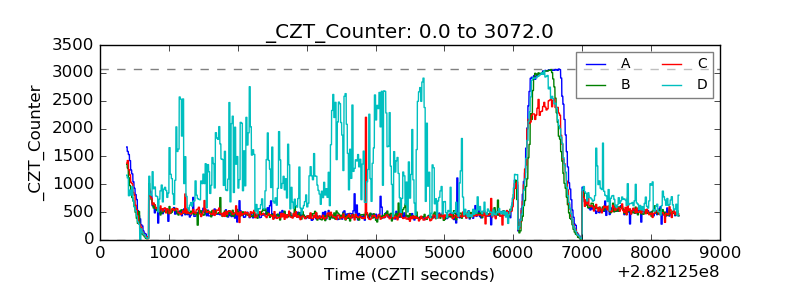 |
| +2.5 Volts monitor |  |
| +5 Volts monitor |  |
| _ROLL_ROT | 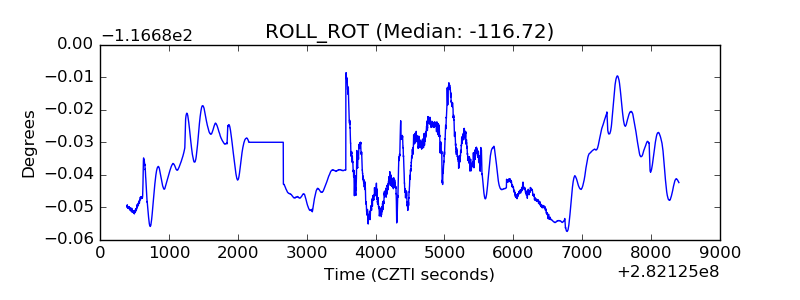 |
| _Roll_DEC | 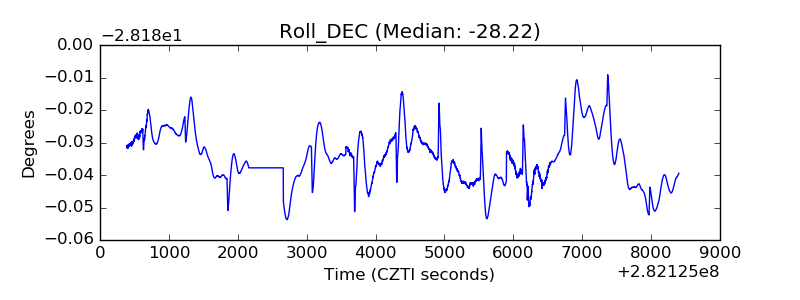 |
| _Roll_RA | 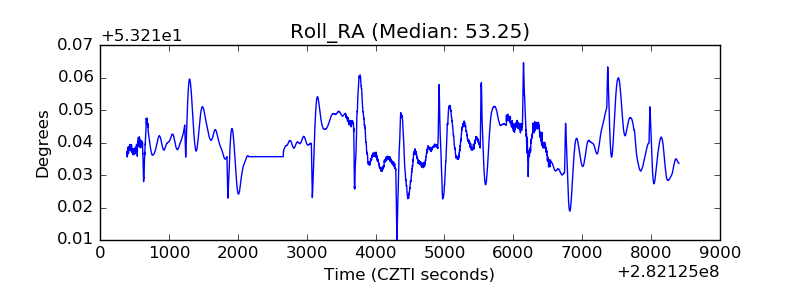 |
| Veto Counter | 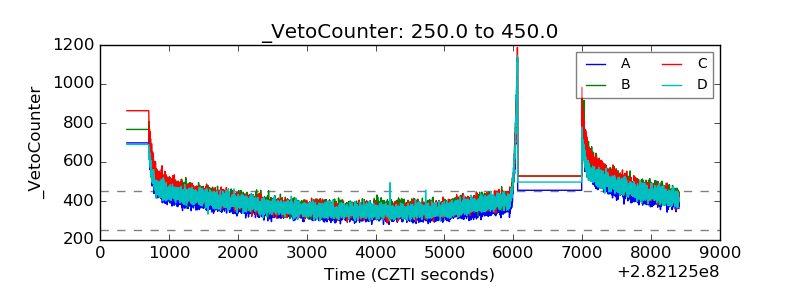 |