| Param | Original file | Final file |
|---|---|---|
| Filename | modeM0/AS1A05_010T02_9000002556_17308cztM0_level2.evt | modeM0/AS1A05_010T02_9000002556_17308cztM0_level2_quad_clean.evt |
| Size (bytes) | 525,870,720 | 92,566,080 |
| Size | 501.5 MB | 88.3 MB |
| Events in quadrant A | 3,524,686 | 592,720 |
| Events in quadrant B | 3,539,935 | 594,520 |
| Events in quadrant C | 3,485,244 | 564,364 |
| Events in quadrant D | 4,894,894 | 557,866 |
| Mode M0 | |||
|---|---|---|---|
| Quadrant | BADHDUFLAG | Total packets | Discarded packets |
| A | 0 | 15100 | 2 |
| B | 0 | 15132 | 2 |
| C | 0 | 15067 | 2 |
| D | 0 | 19208 | 2 |
| Mode M9 | |||
|---|---|---|---|
| Quadrant | BADHDUFLAG | Total packets | Discarded packets |
| A | 0 | 20 | 0 |
| B | 0 | 20 | 0 |
| C | 0 | 20 | 0 |
| D | 0 | 20 | 0 |
| Mode SS | |||
|---|---|---|---|
| Quadrant | BADHDUFLAG | Total packets | Discarded packets |
| A | 0 | 146 | 0 |
| B | 0 | 146 | 0 |
| C | 0 | 146 | 0 |
| D | 0 | 146 | 0 |
| Quadrant | Total seconds | Saturated seconds | Saturation percentage |
|---|---|---|---|
| A | 7088 | 146 | 2.059819% |
| B | 7089 | 170 | 2.398082% |
| C | 7089 | 184 | 2.595571% |
| D | 7089 | 200 | 2.821272% |
Noise dominated data is calculated using 1-second bins in cleaned event files. If a bin has >2000 counts, and if more than 50% of those come from <1% of pixels, then it is considered to be noise-dominated and hence unusable.
| Quadrant | # 1 sec bins | Bins with >0 counts | Bins with >2000 counts | High rate bins dominated by noise | Noise dominated (total time) | Noise dominated (detector-on time) | Marked lightcurve |
|---|---|---|---|---|---|---|---|
| A | 9088 | 7088 | 0 | 0 | 0.00% | 0.00% | 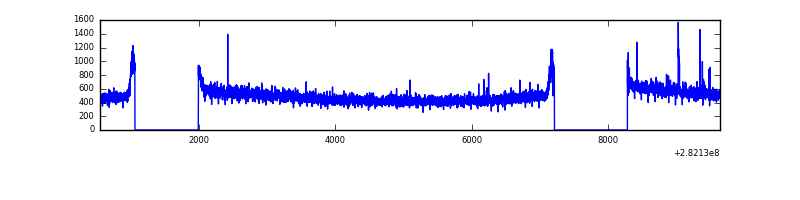 |
| B | 9089 | 7089 | 0 | 0 | 0.00% | 0.00% | 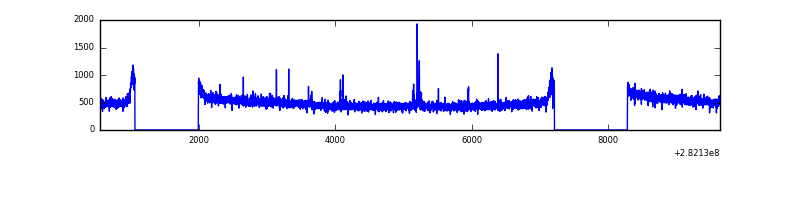 |
| C | 9089 | 7089 | 0 | 0 | 0.00% | 0.00% | 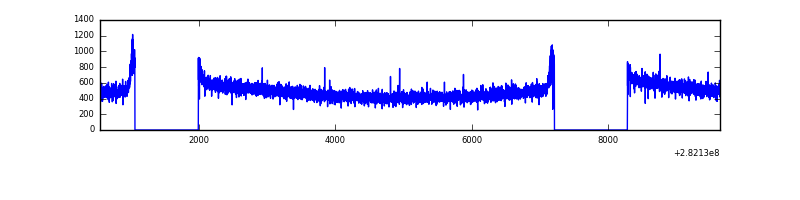 |
| D | 9089 | 7089 | 44 | 44 | 0.48% | 0.62% | 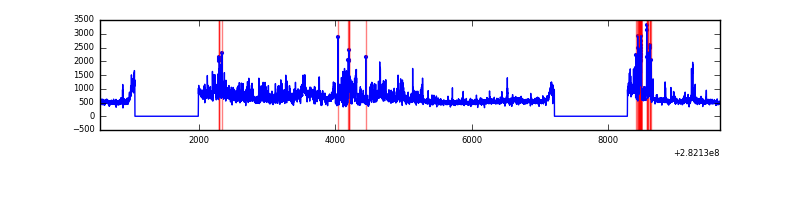 |
Top three noisy pixels from each quadrant. If the there are fewer than three noisy pixels in the level2.evt file, extra rows are filled as -1
| Pixel properties | Quadrant properties | ||||||
|---|---|---|---|---|---|---|---|
| Quadrant | DetID | PixID | Counts | Sigma | Mean | Median | Sigma |
| A | 0 | 23 | 28986 | 154.66 | 904 | 886 | 181.7 |
| A | 4 | 2 | 17190 | 89.74 | 904 | 886 | 181.7 |
| A | 0 | 226 | 9345 | 46.56 | 904 | 886 | 181.7 |
| B | 0 | 230 | 21554 | 120.37 | 898 | 876 | 171.8 |
| B | 12 | 111 | 21009 | 117.2 | 898 | 876 | 171.8 |
| B | 11 | 111 | 18645 | 103.44 | 898 | 876 | 171.8 |
| C | 14 | 238 | 133562 | 662.16 | 858 | 863 | 200.4 |
| C | 3 | 233 | 7181 | 31.52 | 858 | 863 | 200.4 |
| C | 13 | 61 | 6003 | 25.65 | 858 | 863 | 200.4 |
| D | 5 | 222 | 1193003 | 5657.03 | 870 | 843 | 210.7 |
| D | 11 | 176 | 364260 | 1724.48 | 870 | 843 | 210.7 |
| D | 1 | 52 | 34511 | 159.76 | 870 | 843 | 210.7 |
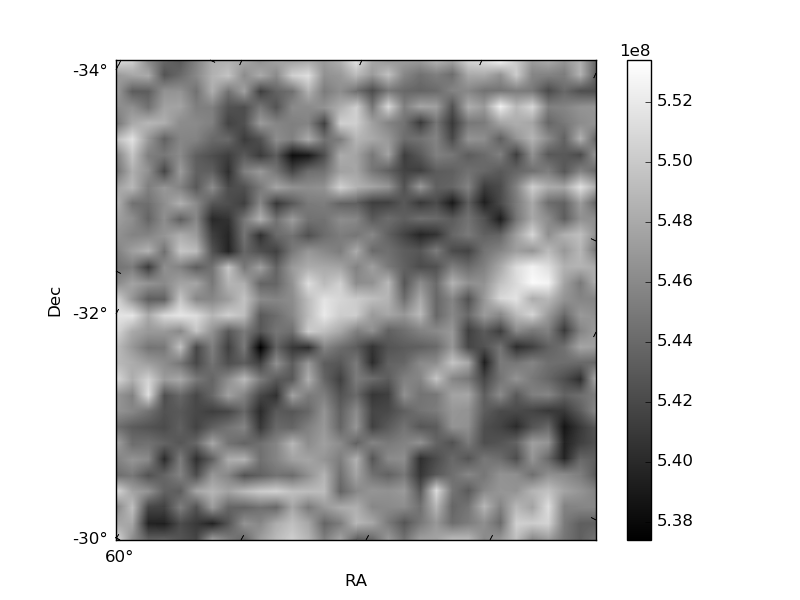
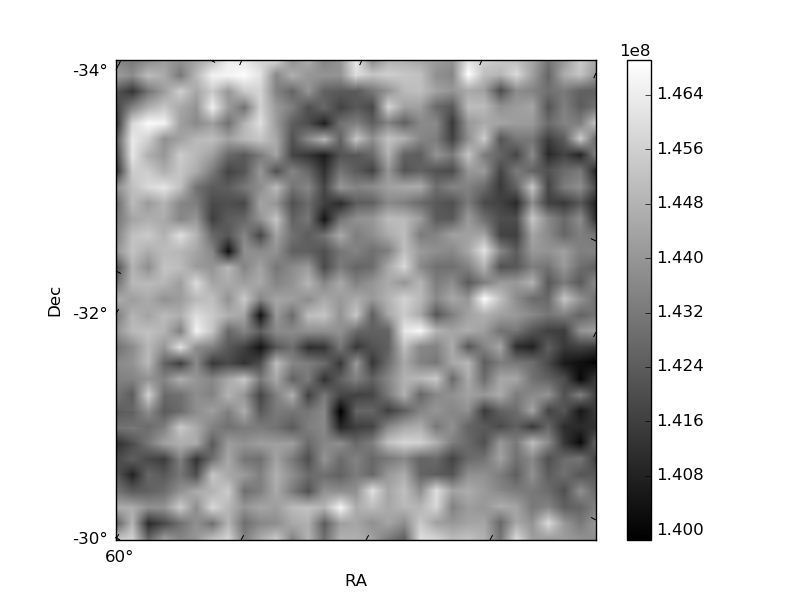
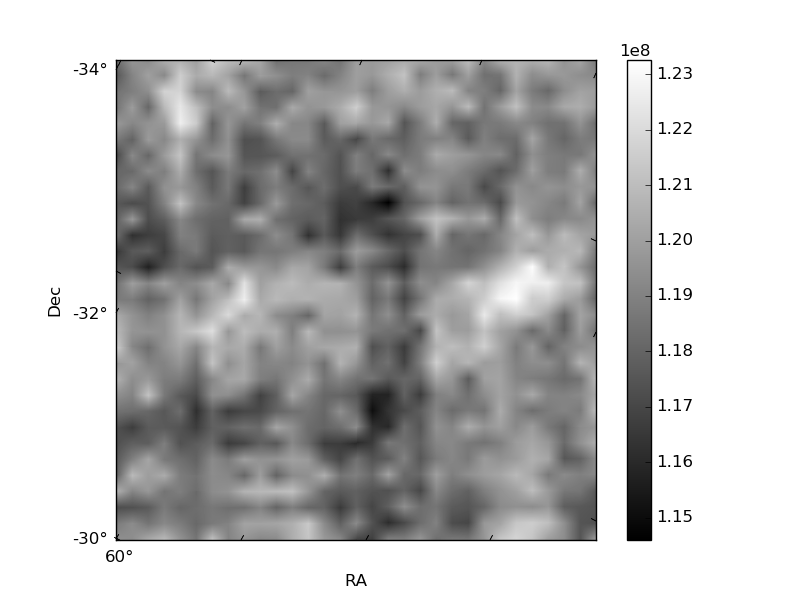
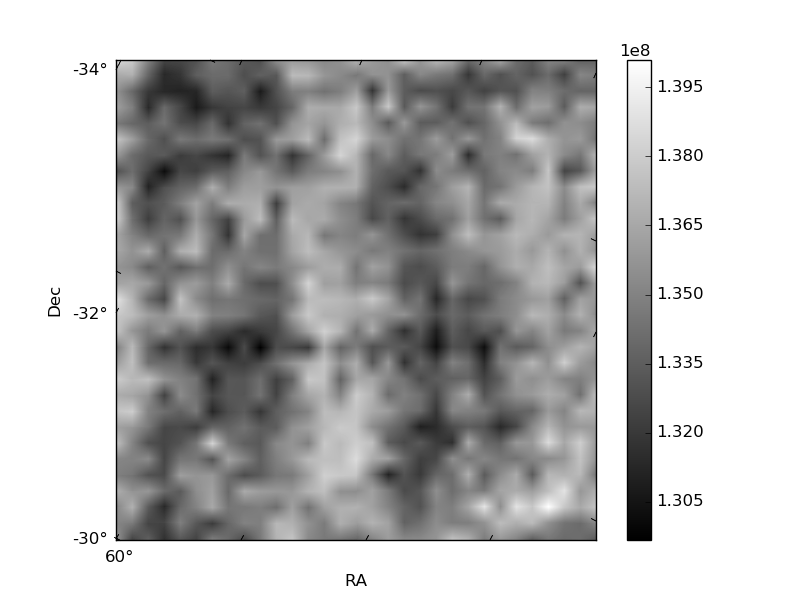
Histogram calculated using DETX and DETY for each event in the final _common_clean file
| Quadrant A | 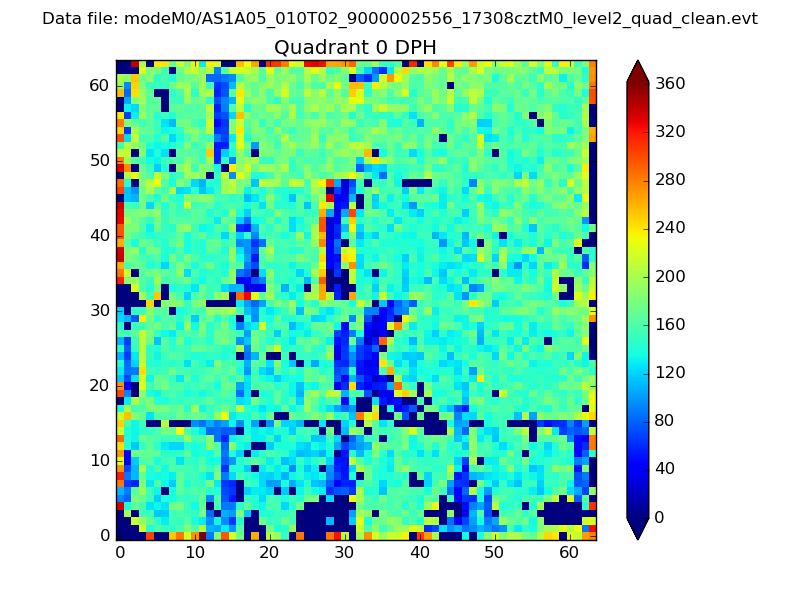 |
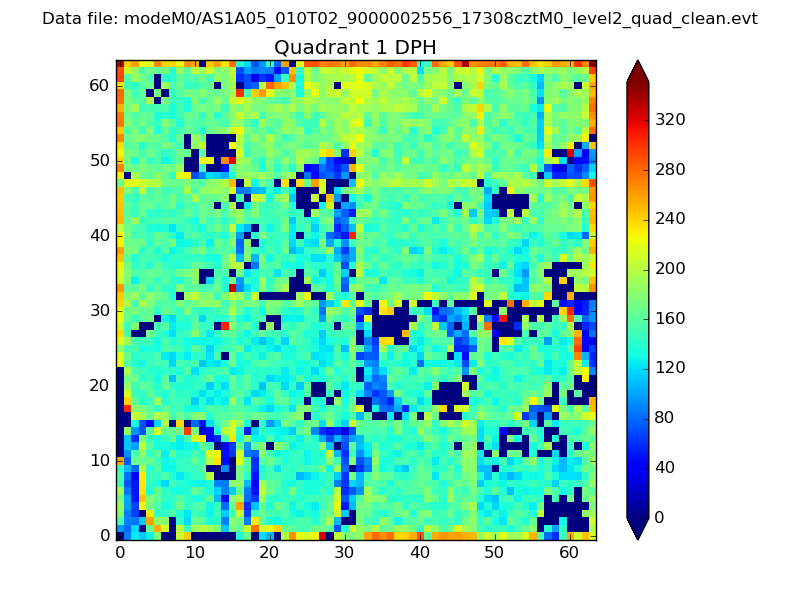 |
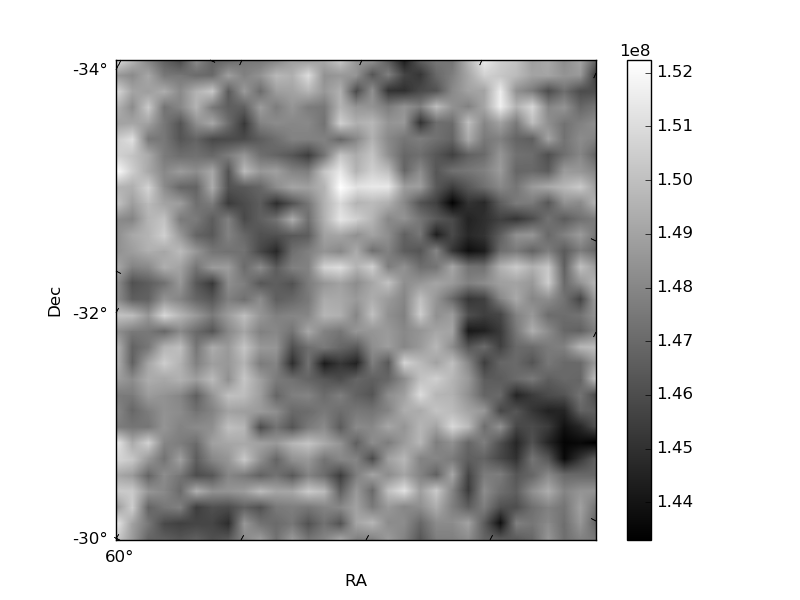
Quadrant B |
|---|---|---|---|
| Quadrant D | 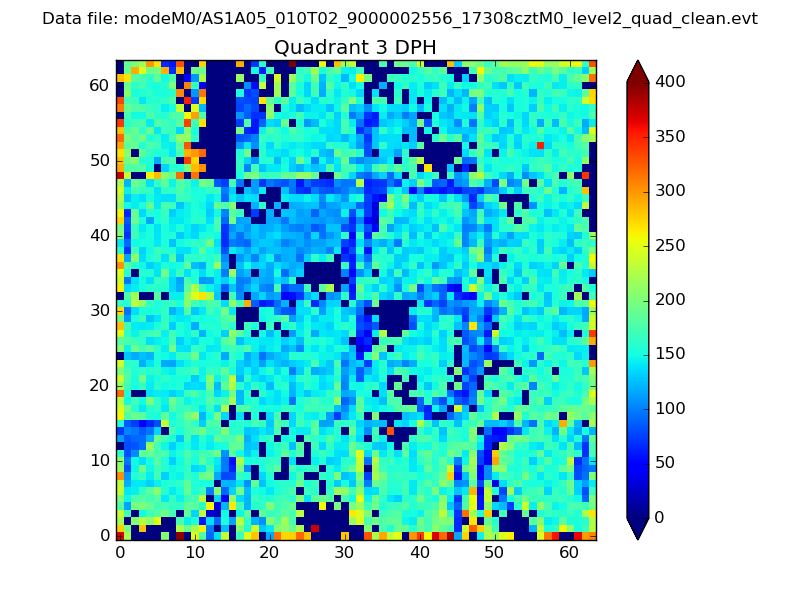 |
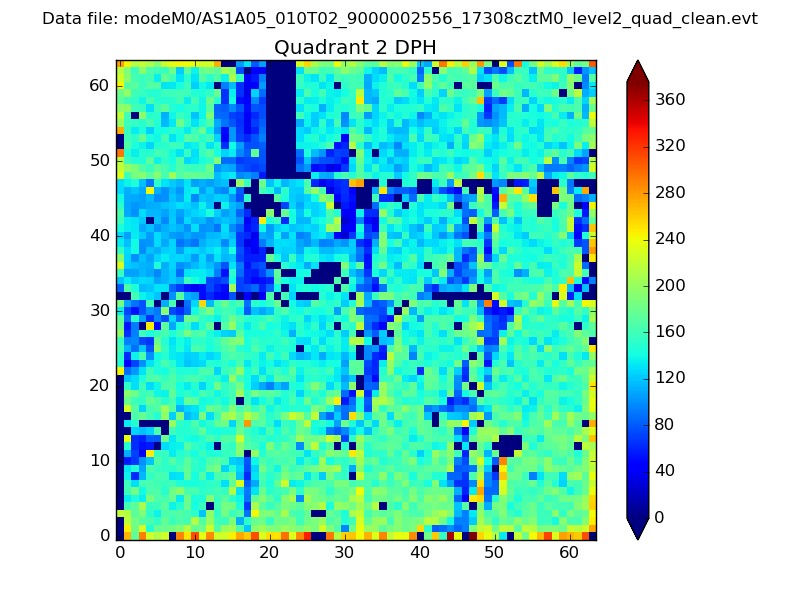 |
Quadrant C |
| Plot type | Count rate plots | Images |
|---|---|---|
| Comparison with Poisson distribution Blue bars denote a histogram of data divided into 1 sec bins. Red curve is a Poisson curve with rate = median count rate of data. |
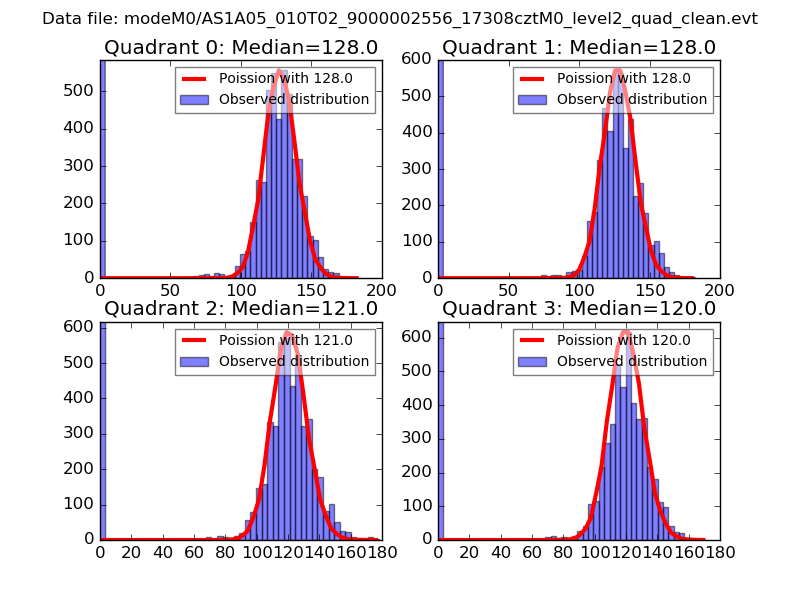 |
 |
| Quadrant-wise count rates Data is divided into 100 sec bins |
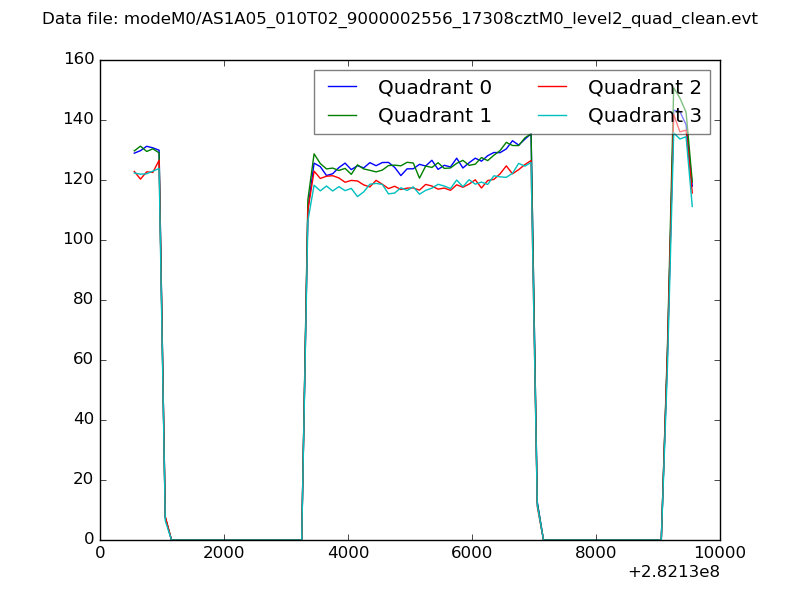 |
|
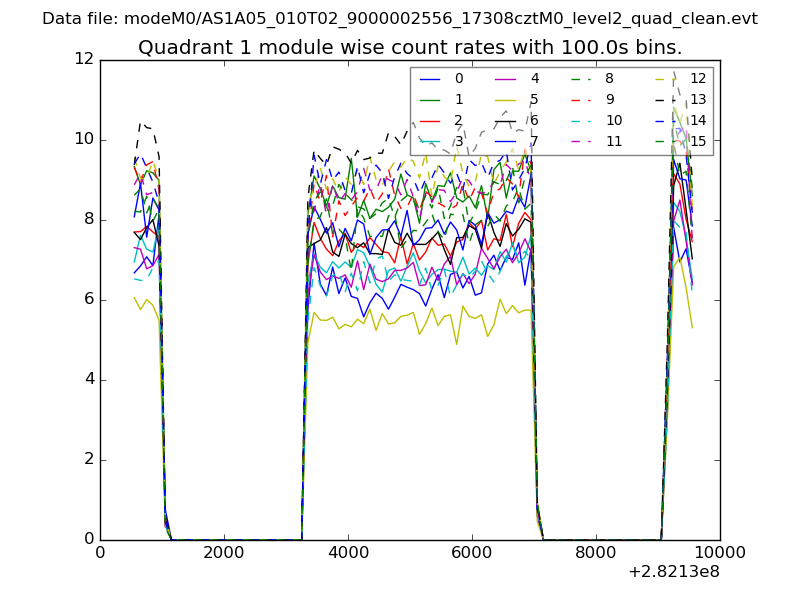
| Module-wise count rates for Quadrant A Data is divided into 100 sec bins |
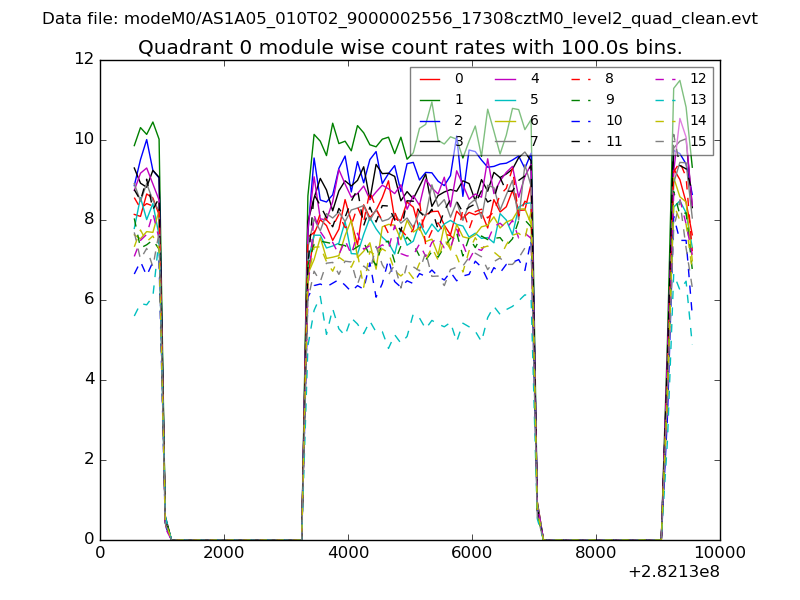 |
 |
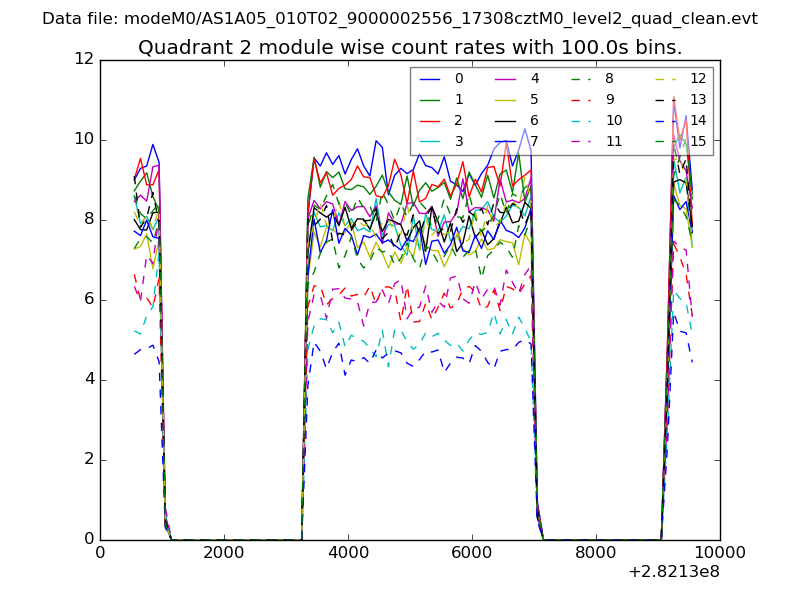
| Module-wise count rates for Quadrant B Data is divided into 100 sec bins |
 |
 |
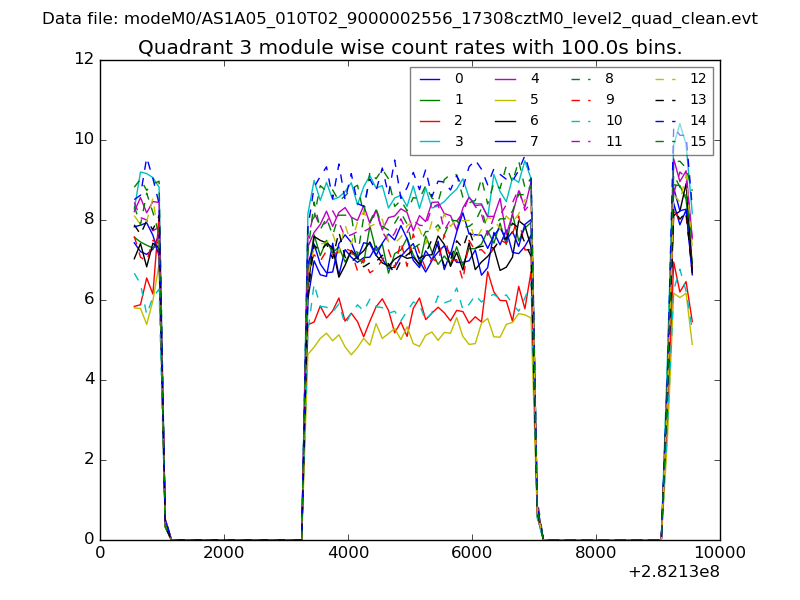
| Module-wise count rates for Quadrant C Data is divided into 100 sec bins |
 |
 |
| Module-wise count rates for Quadrant D Data is divided into 100 sec bins |
 |
 |
| Parameter | Plot |
|---|---|
| CZT HV Monitor | 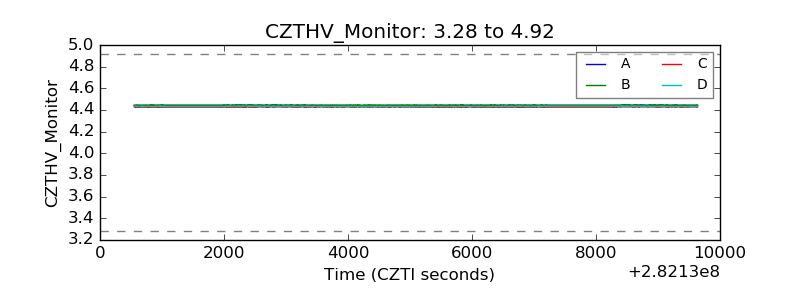 |
| D_VDD | 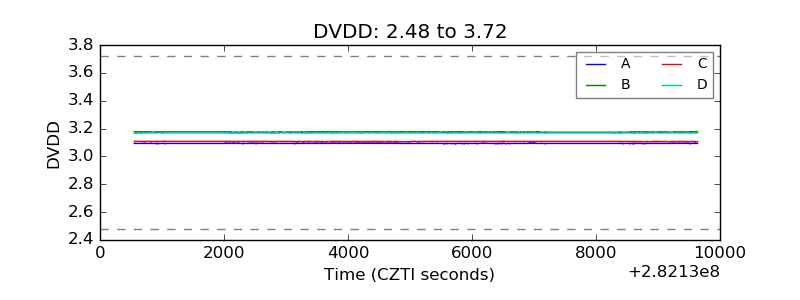 |
| Temperature 1 | 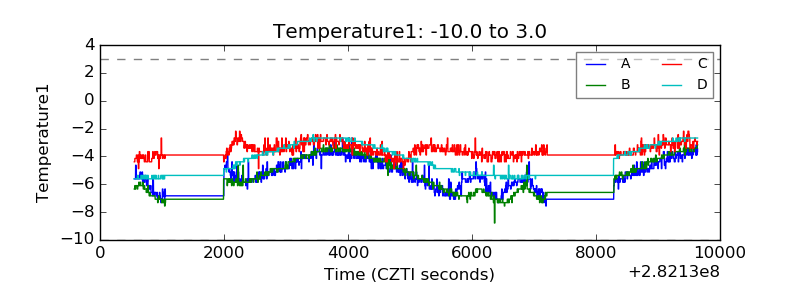 |
| Veto HV Monitor | 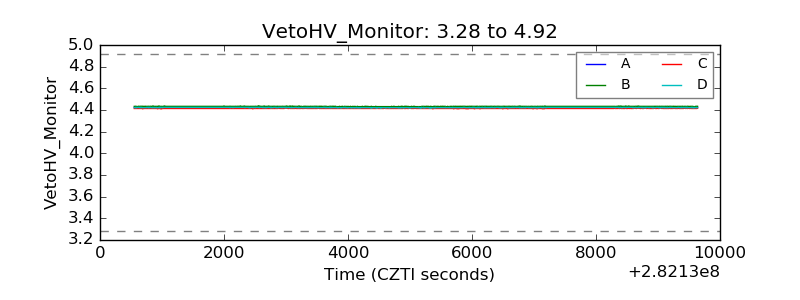 |
| Veto LLD | 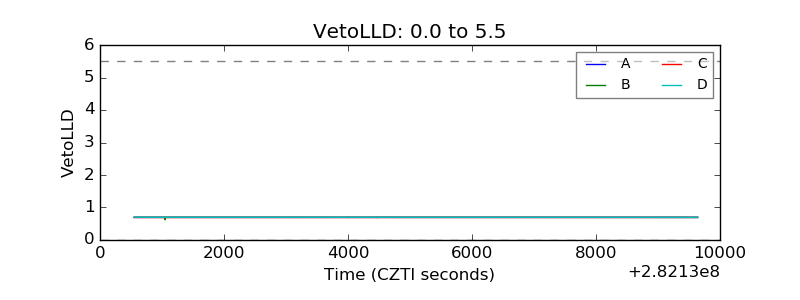 |
| Alpha Counter | 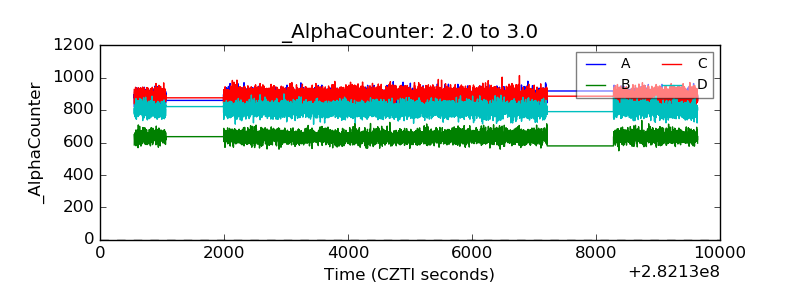 |
| _CPM_Rate | 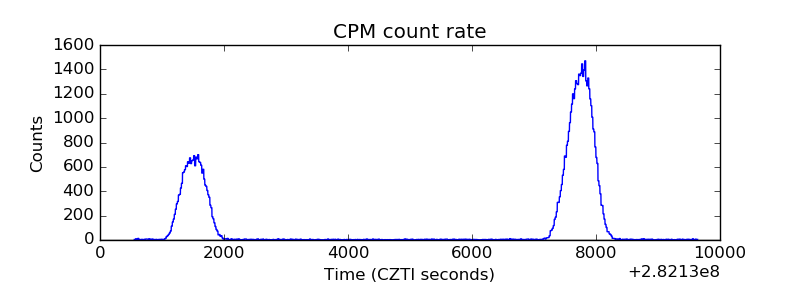 |
| CZT Counter | 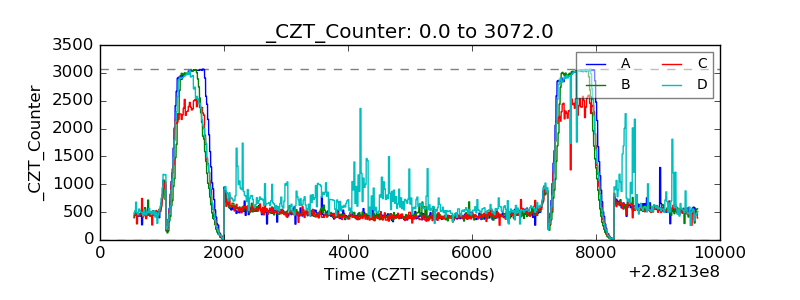 |
| +2.5 Volts monitor | 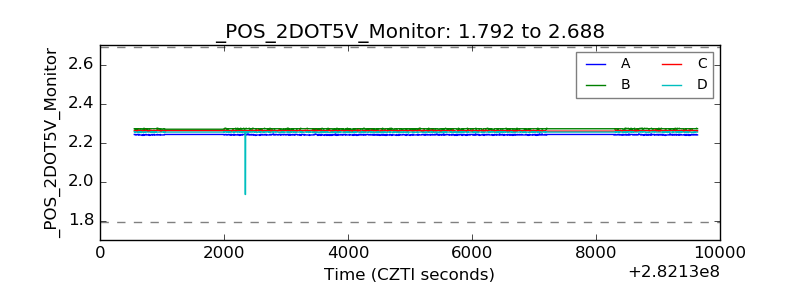 |
| +5 Volts monitor | 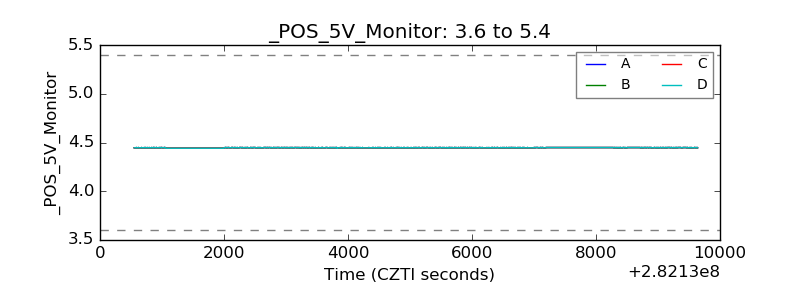 |
| _ROLL_ROT | 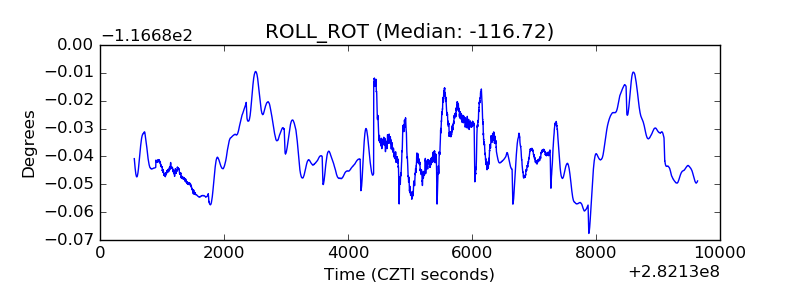 |
| _Roll_DEC | 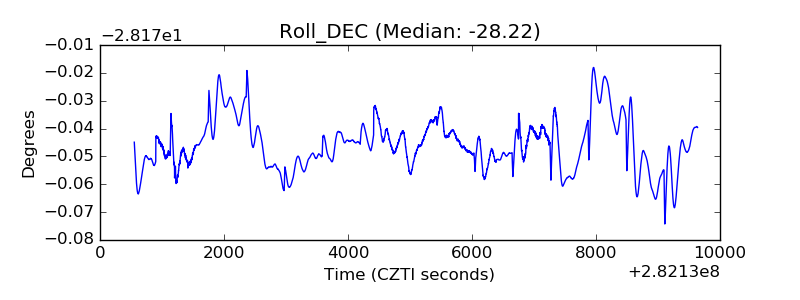 |
| _Roll_RA | 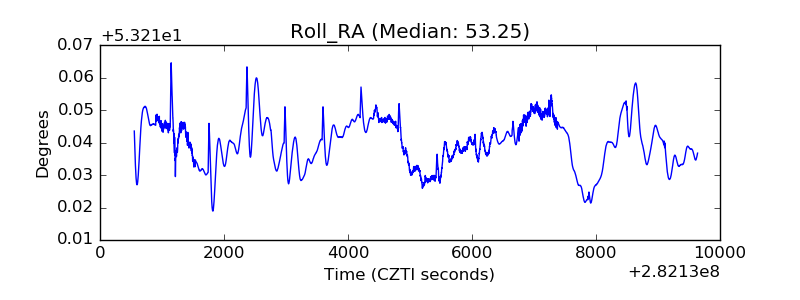 |
| Veto Counter | 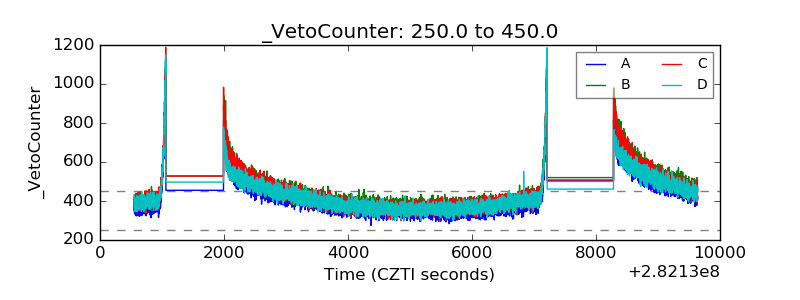 |