| Param | Original file | Final file |
|---|---|---|
| Filename | modeM0/AS1A05_010T02_9000002556_17309cztM0_level2.evt | modeM0/AS1A05_010T02_9000002556_17309cztM0_level2_quad_clean.evt |
| Size (bytes) | 508,682,880 | 94,662,720 |
| Size | 485.1 MB | 90.3 MB |
| Events in quadrant A | 3,380,287 | 626,556 |
| Events in quadrant B | 3,235,967 | 633,550 |
| Events in quadrant C | 3,171,002 | 591,392 |
| Events in quadrant D | 5,186,379 | 570,899 |
| Mode M0 | |||
|---|---|---|---|
| Quadrant | BADHDUFLAG | Total packets | Discarded packets |
| A | 0 | 14153 | 1 |
| B | 0 | 13801 | 1 |
| C | 0 | 13678 | 1 |
| D | 0 | 19775 | 1 |
| Mode M9 | |||
|---|---|---|---|
| Quadrant | BADHDUFLAG | Total packets | Discarded packets |
| A | 0 | 12 | 0 |
| B | 0 | 12 | 0 |
| C | 0 | 12 | 0 |
| D | 0 | 12 | 0 |
| Mode SS | |||
|---|---|---|---|
| Quadrant | BADHDUFLAG | Total packets | Discarded packets |
| A | 0 | 130 | 0 |
| B | 0 | 130 | 0 |
| C | 0 | 130 | 0 |
| D | 0 | 130 | 0 |
| Quadrant | Total seconds | Saturated seconds | Saturation percentage |
|---|---|---|---|
| A | 6364 | 87 | 1.367065% |
| B | 6365 | 85 | 1.335428% |
| C | 6365 | 107 | 1.681068% |
| D | 6364 | 385 | 6.049654% |
Noise dominated data is calculated using 1-second bins in cleaned event files. If a bin has >2000 counts, and if more than 50% of those come from <1% of pixels, then it is considered to be noise-dominated and hence unusable.
| Quadrant | # 1 sec bins | Bins with >0 counts | Bins with >2000 counts | High rate bins dominated by noise | Noise dominated (total time) | Noise dominated (detector-on time) | Marked lightcurve |
|---|---|---|---|---|---|---|---|
| A | 7544 | 6364 | 0 | 0 | 0.00% | 0.00% | 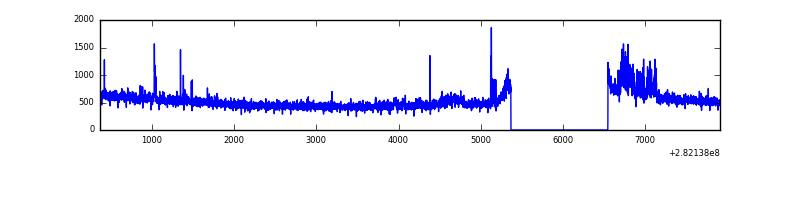 |
| B | 7545 | 6365 | 1 | 1 | 0.01% | 0.02% | 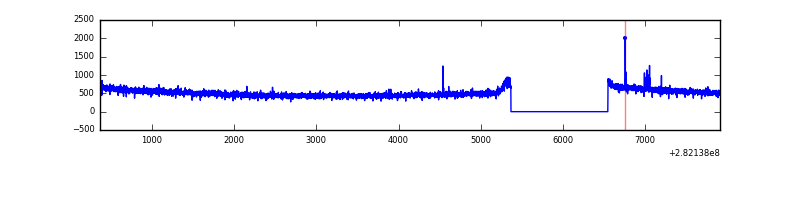 |
| C | 7545 | 6365 | 0 | 0 | 0.00% | 0.00% |  |
| D | 7544 | 6364 | 368 | 368 | 4.88% | 5.78% | 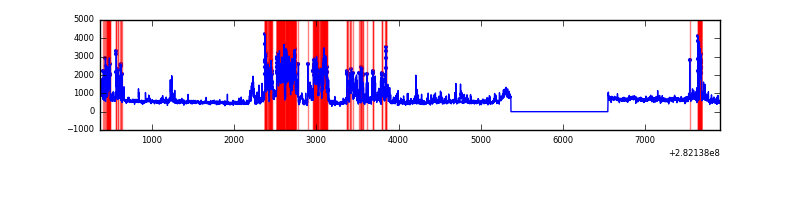 |
Top three noisy pixels from each quadrant. If the there are fewer than three noisy pixels in the level2.evt file, extra rows are filled as -1
| Pixel properties | Quadrant properties | ||||||
|---|---|---|---|---|---|---|---|
| Quadrant | DetID | PixID | Counts | Sigma | Mean | Median | Sigma |
| A | 0 | 23 | 164942 | 996.42 | 831 | 817 | 164.7 |
| A | 0 | 226 | 16847 | 97.32 | 831 | 817 | 164.7 |
| A | 4 | 2 | 11914 | 67.37 | 831 | 817 | 164.7 |
| B | 12 | 111 | 18692 | 114.38 | 825 | 806 | 156.4 |
| B | 11 | 111 | 16220 | 98.57 | 825 | 806 | 156.4 |
| B | 14 | 111 | 14280 | 86.17 | 825 | 806 | 156.4 |
| C | 14 | 238 | 120820 | 661.59 | 781 | 788 | 181.4 |
| C | 13 | 61 | 5564 | 26.32 | 781 | 788 | 181.4 |
| C | 3 | 233 | 5526 | 26.11 | 781 | 788 | 181.4 |
| D | 5 | 222 | 1115837 | 5873.18 | 785 | 763 | 189.9 |
| D | 11 | 176 | 967298 | 5090.81 | 785 | 763 | 189.9 |
| D | 2 | 152 | 63648 | 331.22 | 785 | 763 | 189.9 |
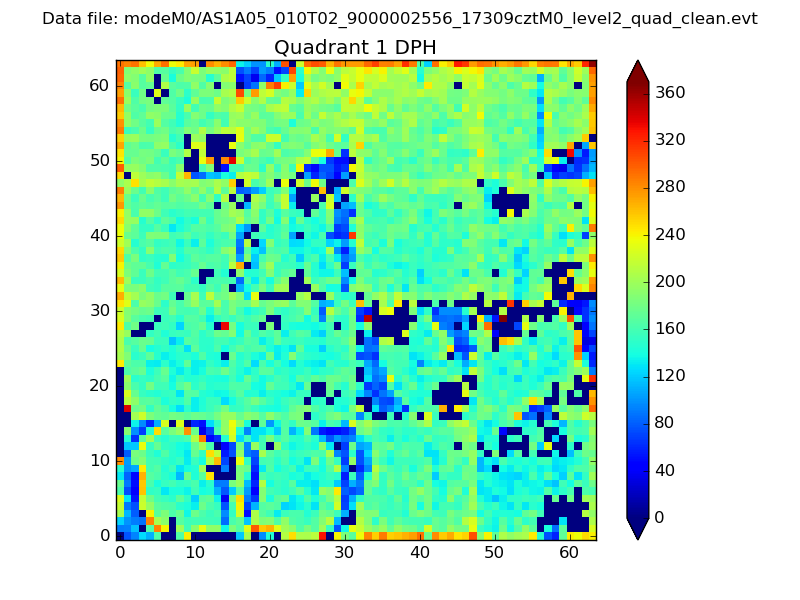
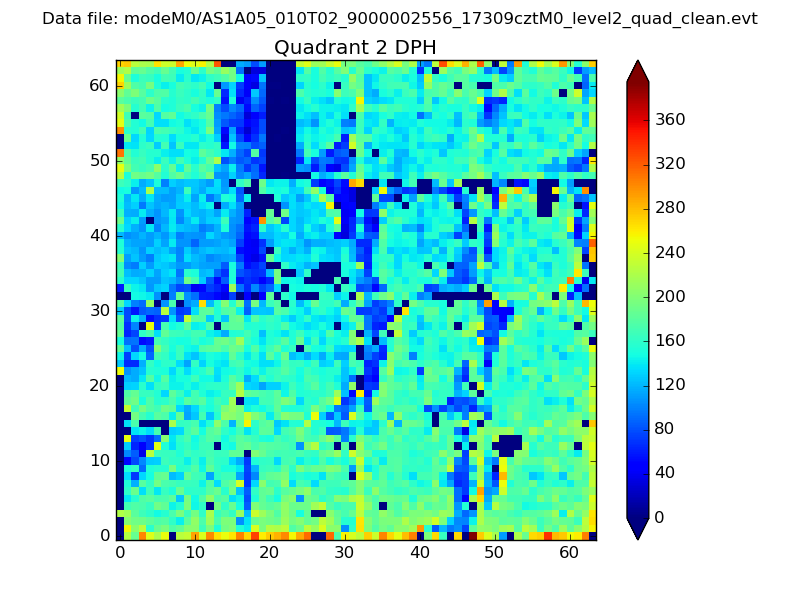
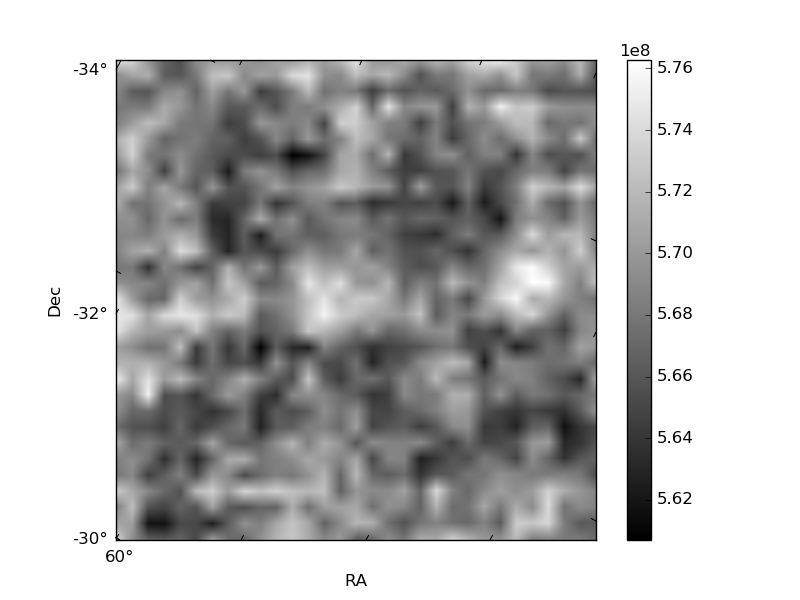
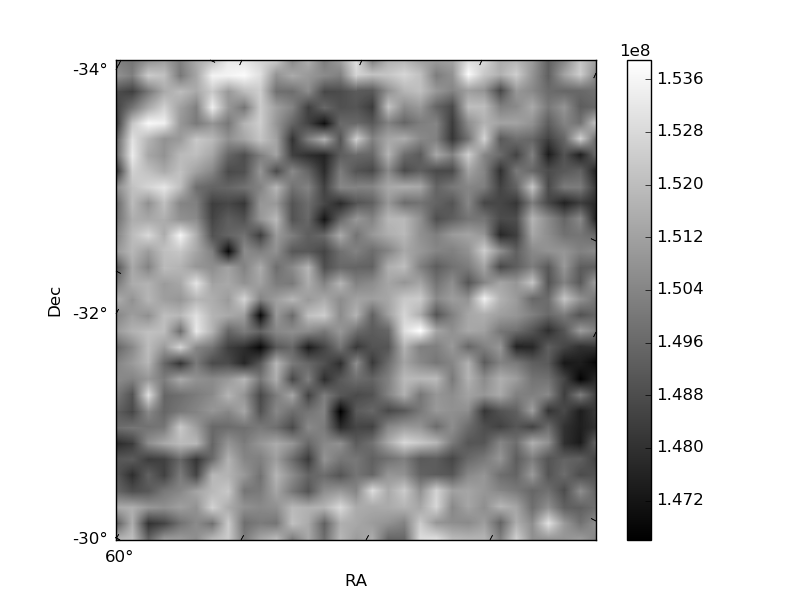
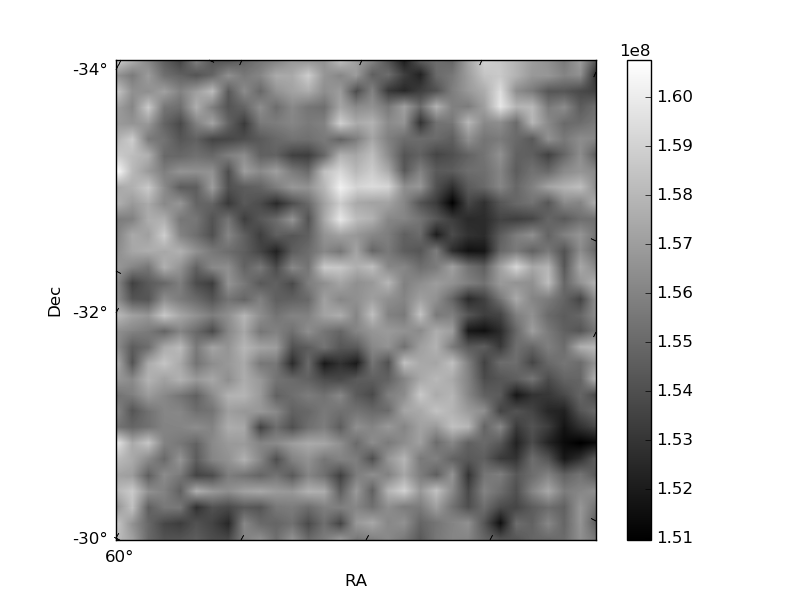
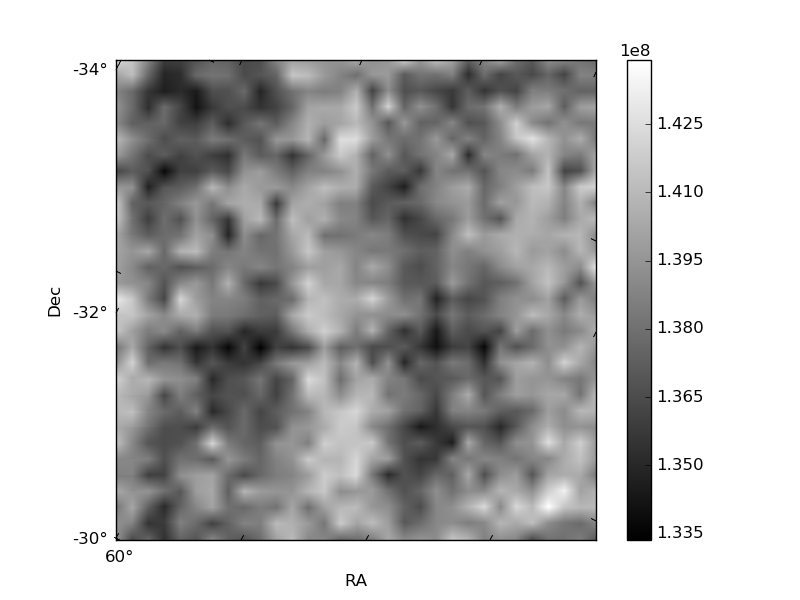
Histogram calculated using DETX and DETY for each event in the final _common_clean file
| Quadrant A | 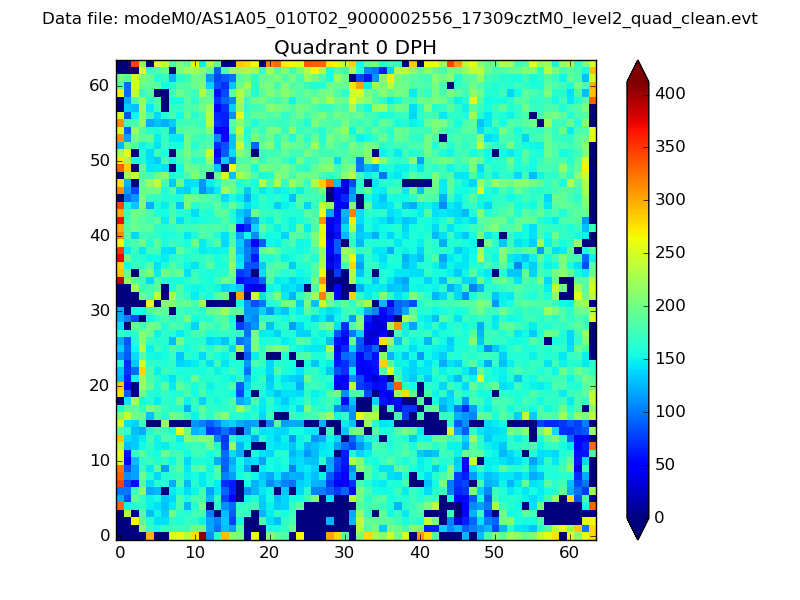 |
 |
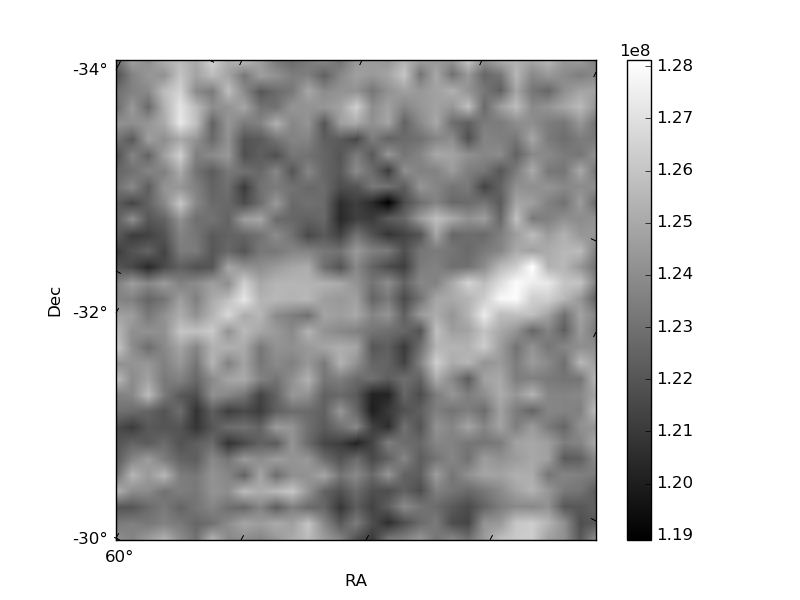
Quadrant B |
|---|---|---|---|
| Quadrant D | 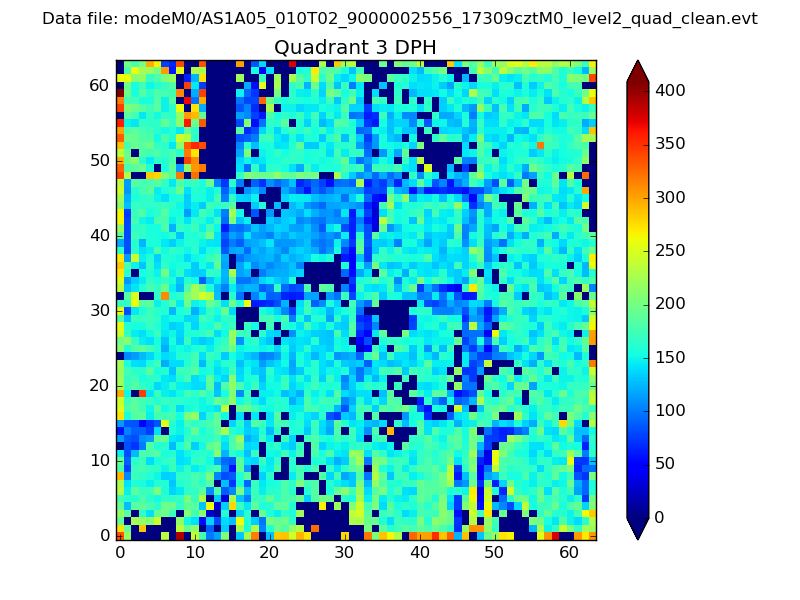 |
 |
Quadrant C |
| Plot type | Count rate plots | Images |
|---|---|---|
| Comparison with Poisson distribution Blue bars denote a histogram of data divided into 1 sec bins. Red curve is a Poisson curve with rate = median count rate of data. |
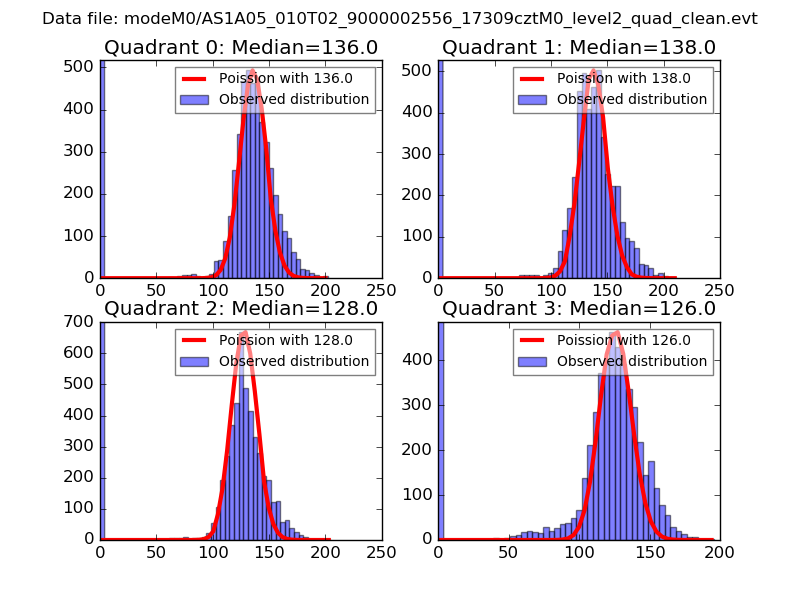 |
 |
| Quadrant-wise count rates Data is divided into 100 sec bins |
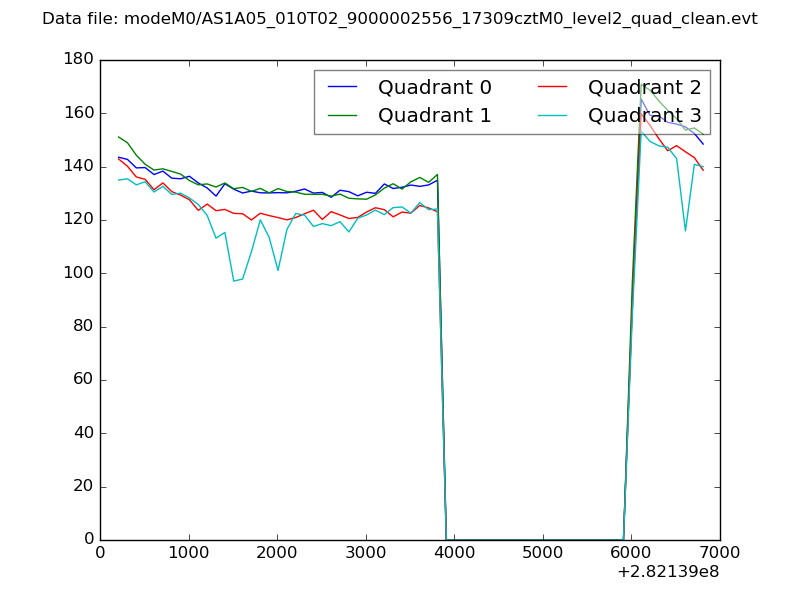 |
|
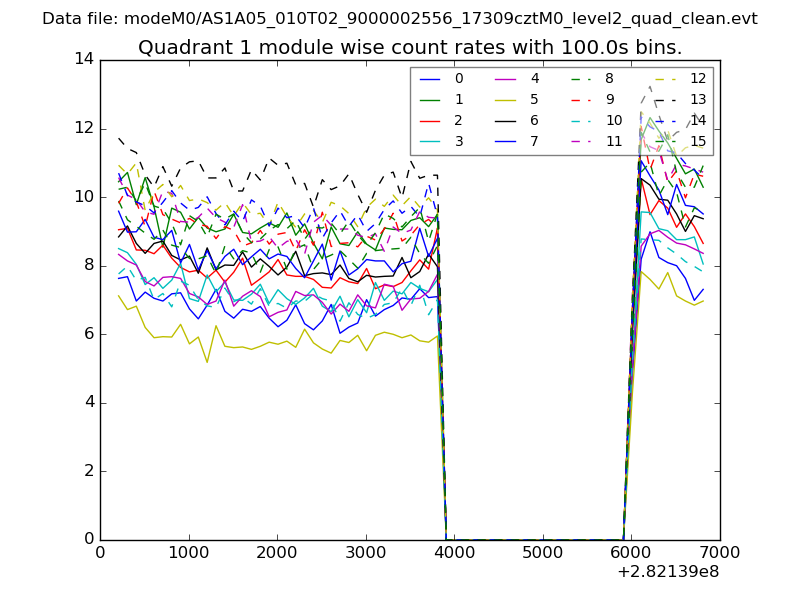
| Module-wise count rates for Quadrant A Data is divided into 100 sec bins |
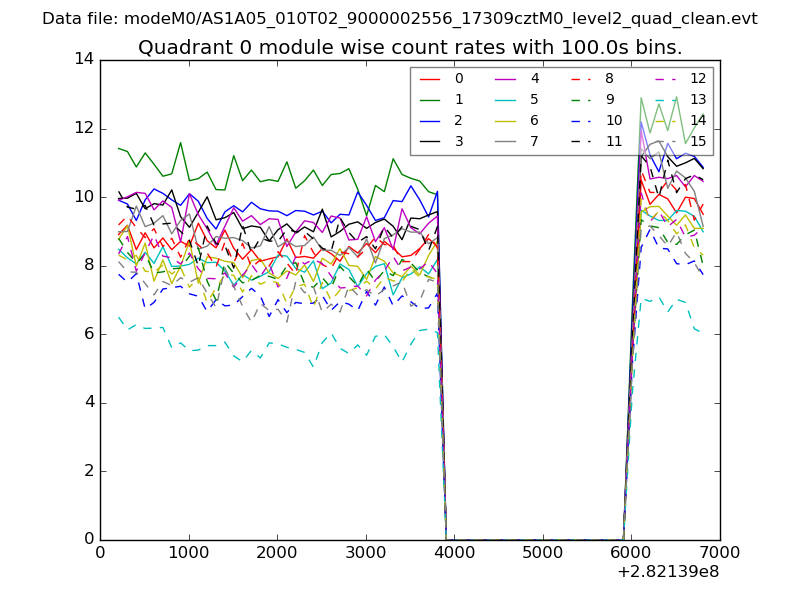 |
 |
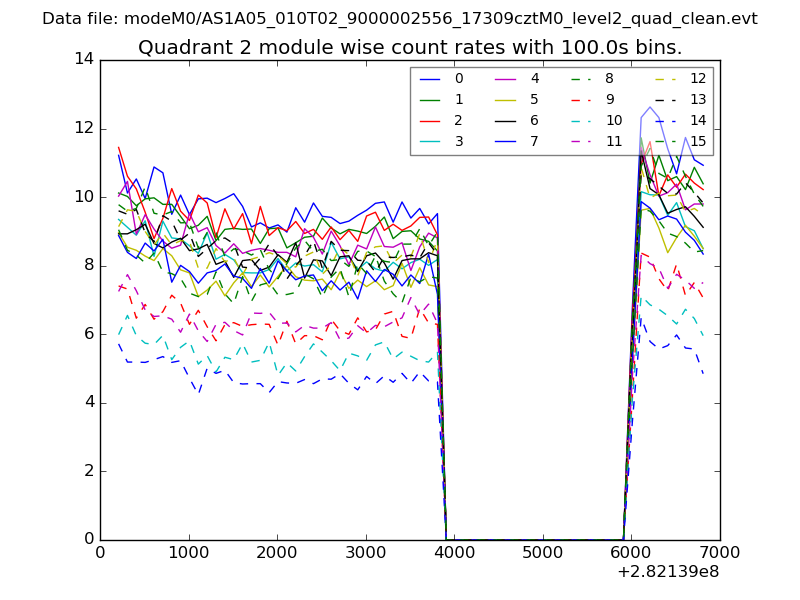
| Module-wise count rates for Quadrant B Data is divided into 100 sec bins |
 |
 |
| Module-wise count rates for Quadrant C Data is divided into 100 sec bins |
 |
 |
| Module-wise count rates for Quadrant D Data is divided into 100 sec bins |
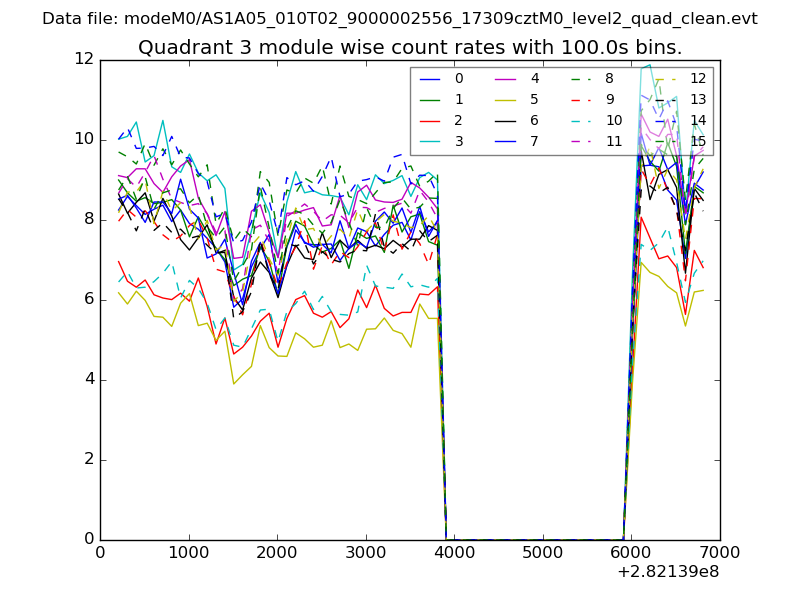 |
 |
| Parameter | Plot |
|---|---|
| CZT HV Monitor | 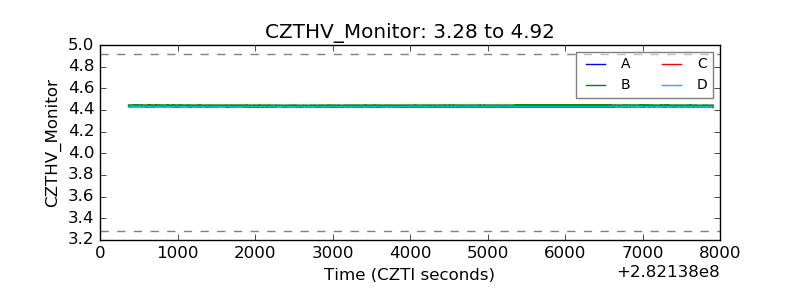 |
| D_VDD | 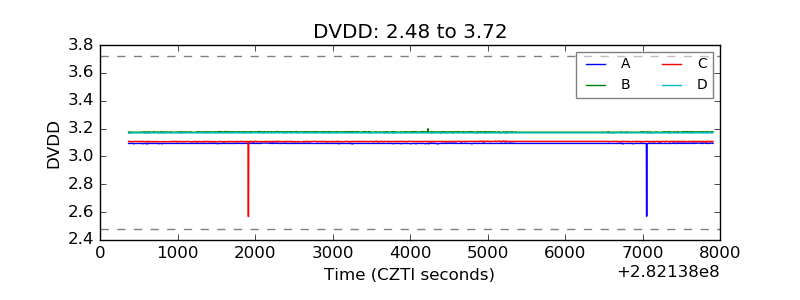 |
| Temperature 1 | 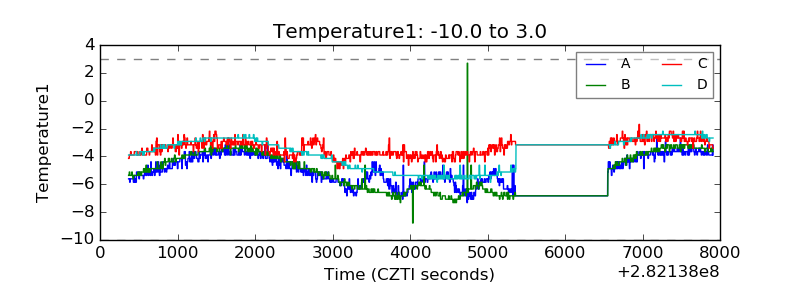 |
| Veto HV Monitor | 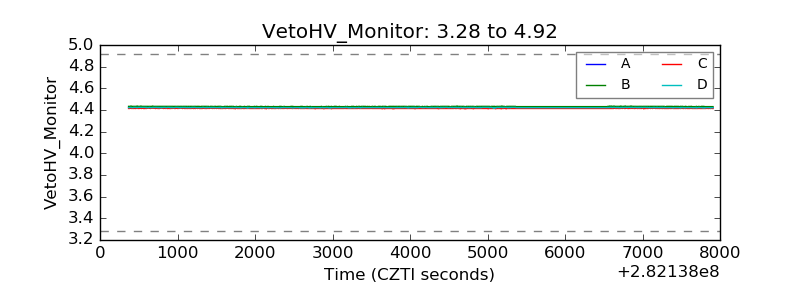 |
| Veto LLD | 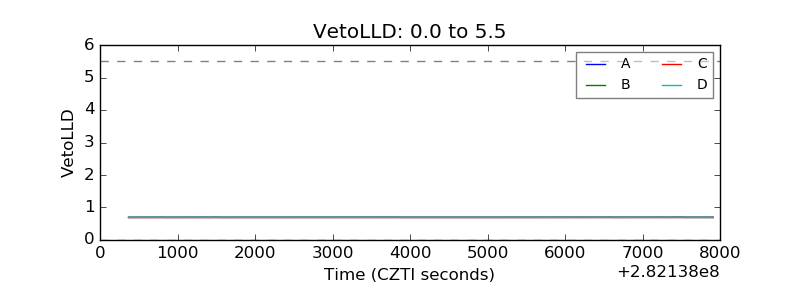 |
| Alpha Counter | 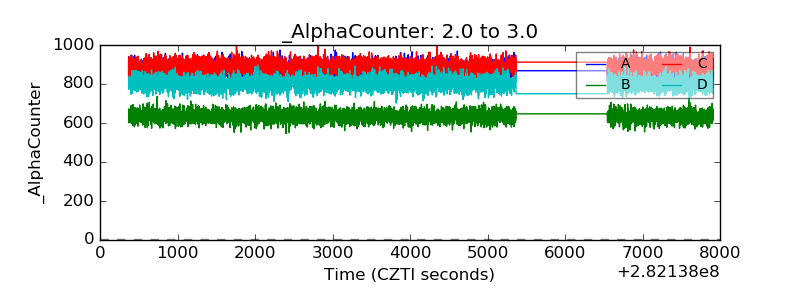 |
| _CPM_Rate | 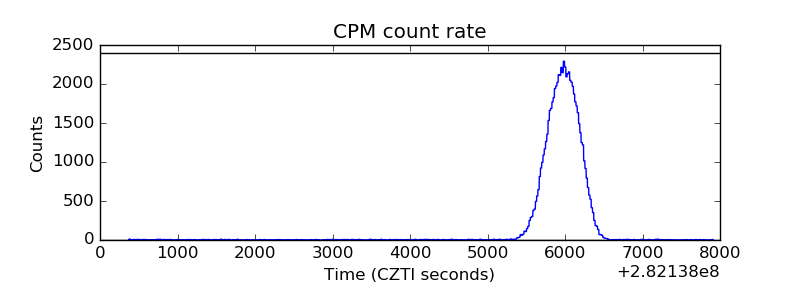 |
| CZT Counter | 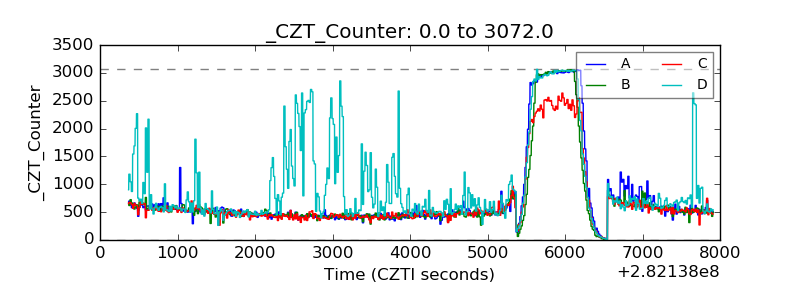 |
| +2.5 Volts monitor |  |
| +5 Volts monitor |  |
| _ROLL_ROT | 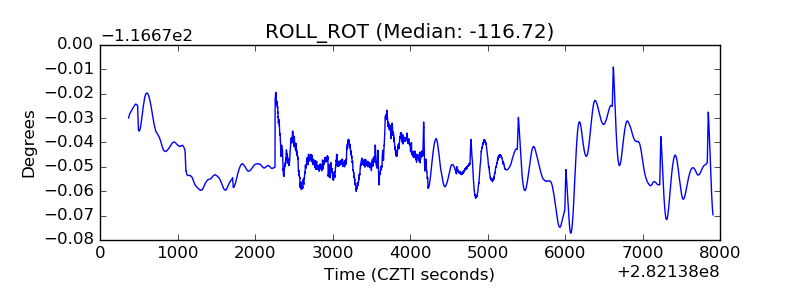 |
| _Roll_DEC | 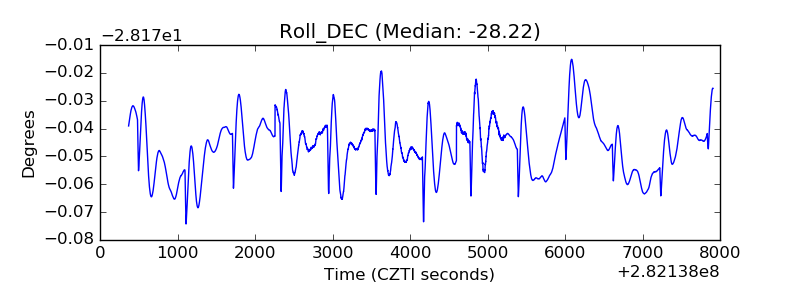 |
| _Roll_RA | 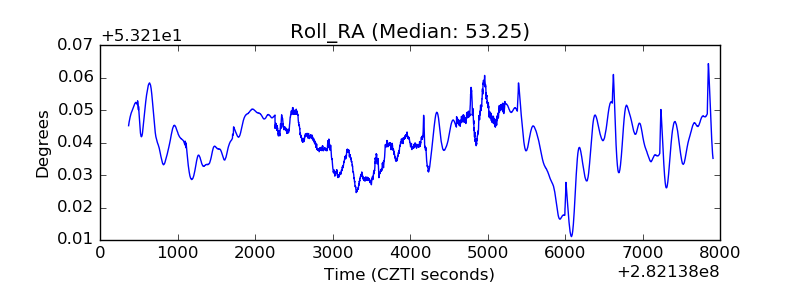 |
| Veto Counter | 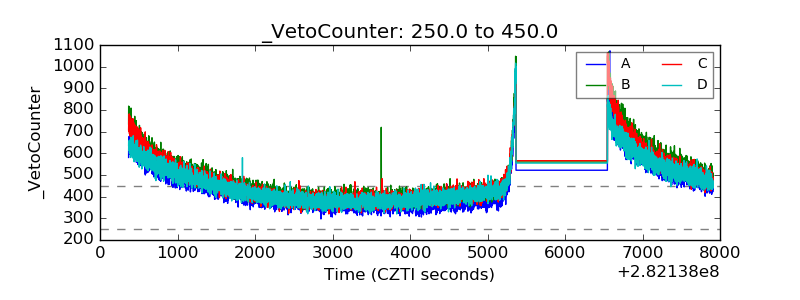 |