| Param | Original file | Final file |
|---|---|---|
| Filename | modeM0/AS1A05_010T02_9000002556_17310cztM0_level2.evt | modeM0/AS1A05_010T02_9000002556_17310cztM0_level2_quad_clean.evt |
| Size (bytes) | 492,186,240 | 115,479,360 |
| Size | 469.4 MB | 110.1 MB |
| Events in quadrant A | 3,547,702 | 785,420 |
| Events in quadrant B | 3,466,153 | 792,746 |
| Events in quadrant C | 3,375,216 | 732,226 |
| Events in quadrant D | 4,063,669 | 721,737 |
| Mode M0 | |||
|---|---|---|---|
| Quadrant | BADHDUFLAG | Total packets | Discarded packets |
| A | 0 | 14842 | 1 |
| B | 0 | 14650 | 1 |
| C | 0 | 14405 | 1 |
| D | 0 | 16569 | 2 |
| Mode M9 | |||
|---|---|---|---|
| Quadrant | BADHDUFLAG | Total packets | Discarded packets |
| A | 0 | 22 | 0 |
| B | 0 | 23 | 0 |
| C | 0 | 23 | 0 |
| D | 0 | 23 | 0 |
| Mode SS | |||
|---|---|---|---|
| Quadrant | BADHDUFLAG | Total packets | Discarded packets |
| A | 0 | 134 | 0 |
| B | 0 | 134 | 0 |
| C | 0 | 134 | 0 |
| D | 0 | 134 | 0 |
| Quadrant | Total seconds | Saturated seconds | Saturation percentage |
|---|---|---|---|
| A | 6683 | 94 | 1.406554% |
| B | 6683 | 108 | 1.616041% |
| C | 6683 | 127 | 1.900344% |
| D | 6682 | 112 | 1.676145% |
Noise dominated data is calculated using 1-second bins in cleaned event files. If a bin has >2000 counts, and if more than 50% of those come from <1% of pixels, then it is considered to be noise-dominated and hence unusable.
| Quadrant | # 1 sec bins | Bins with >0 counts | Bins with >2000 counts | High rate bins dominated by noise | Noise dominated (total time) | Noise dominated (detector-on time) | Marked lightcurve |
|---|---|---|---|---|---|---|---|
| A | 7938 | 6683 | 0 | 0 | 0.00% | 0.00% | 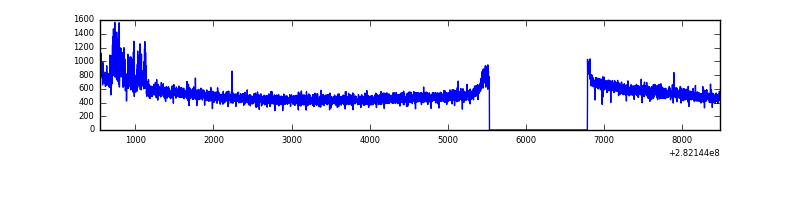 |
| B | 7938 | 6683 | 1 | 1 | 0.01% | 0.01% | 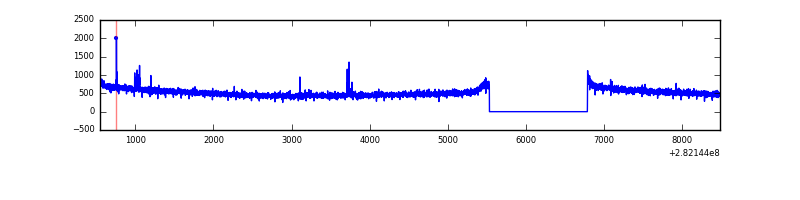 |
| C | 7938 | 6684 | 0 | 0 | 0.00% | 0.00% | 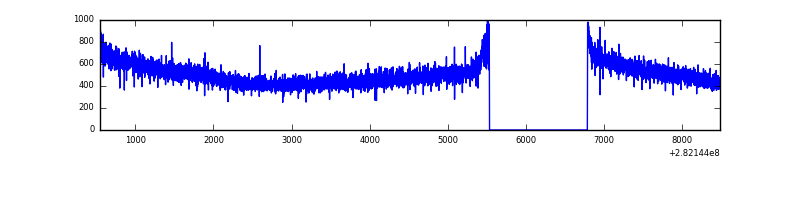 |
| D | 7937 | 6683 | 46 | 46 | 0.58% | 0.69% | 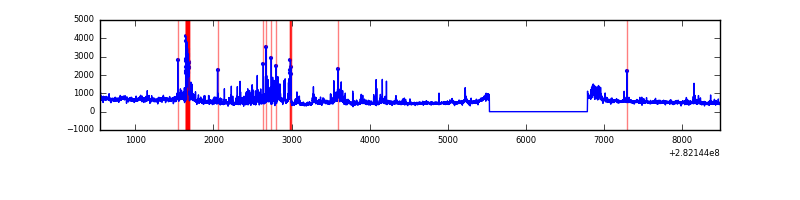 |
Top three noisy pixels from each quadrant. If the there are fewer than three noisy pixels in the level2.evt file, extra rows are filled as -1
| Pixel properties | Quadrant properties | ||||||
|---|---|---|---|---|---|---|---|
| Quadrant | DetID | PixID | Counts | Sigma | Mean | Median | Sigma |
| A | 0 | 23 | 111394 | 620.65 | 893 | 876 | 178.1 |
| A | 0 | 226 | 14383 | 75.85 | 893 | 876 | 178.1 |
| A | 3 | 137 | 6306 | 30.49 | 893 | 876 | 178.1 |
| B | 12 | 111 | 19490 | 111.18 | 885 | 865 | 167.5 |
| B | 11 | 111 | 17117 | 97.01 | 885 | 865 | 167.5 |
| B | 14 | 111 | 14959 | 84.13 | 885 | 865 | 167.5 |
| C | 14 | 238 | 132302 | 682.59 | 830 | 837 | 192.6 |
| C | 3 | 233 | 9891 | 47.01 | 830 | 837 | 192.6 |
| C | 13 | 61 | 5913 | 26.36 | 830 | 837 | 192.6 |
| D | 5 | 222 | 355168 | 1732.36 | 846 | 821 | 204.5 |
| D | 1 | 52 | 220571 | 1074.33 | 846 | 821 | 204.5 |
| D | 11 | 176 | 174855 | 850.83 | 846 | 821 | 204.5 |
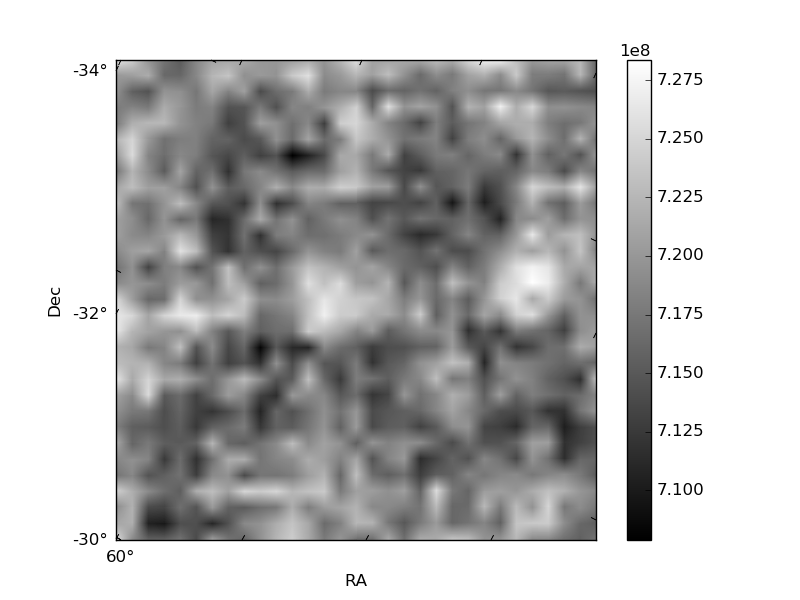
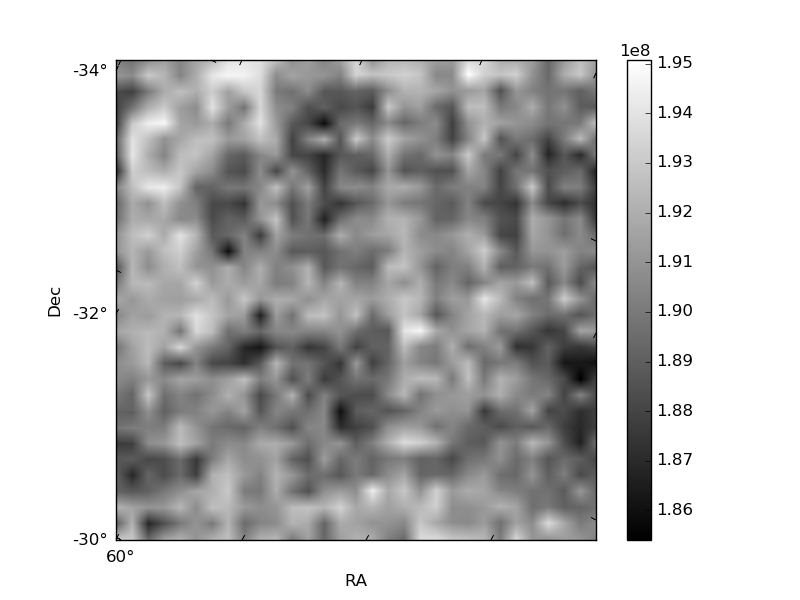
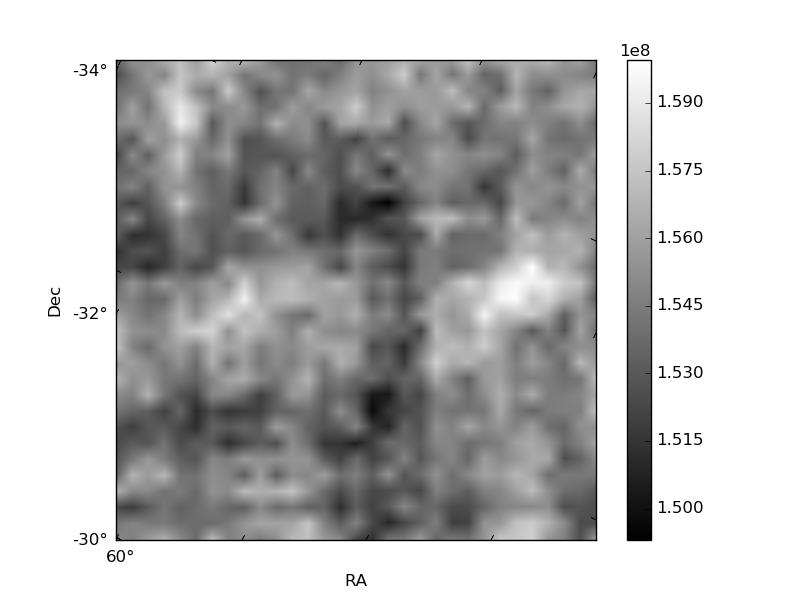
Histogram calculated using DETX and DETY for each event in the final _common_clean file
| Quadrant A | 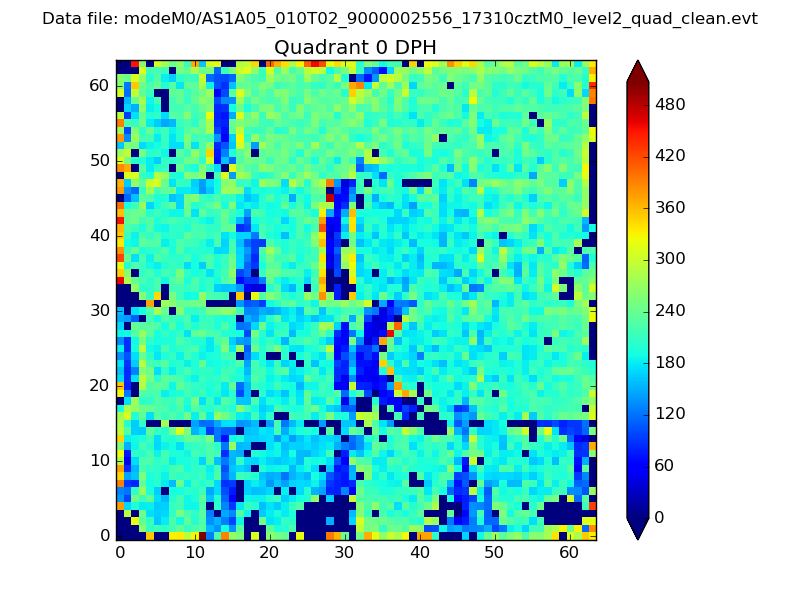 |
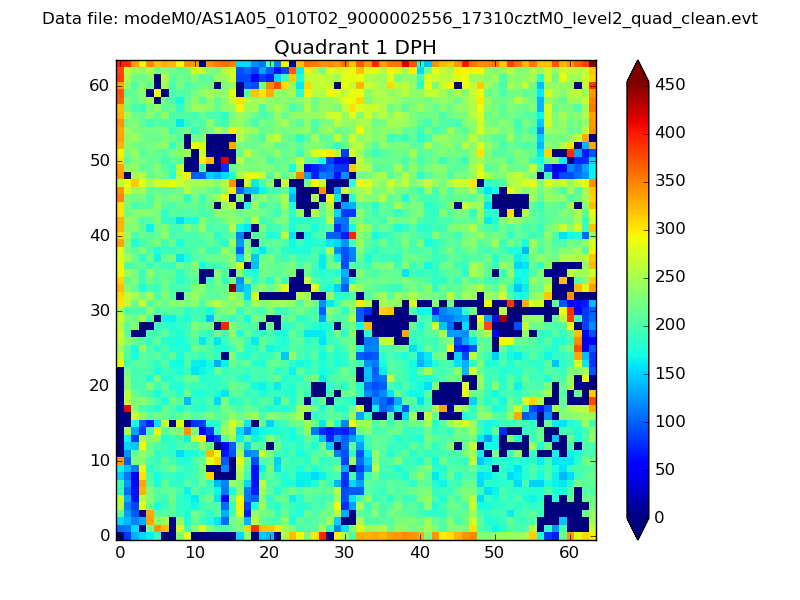 |
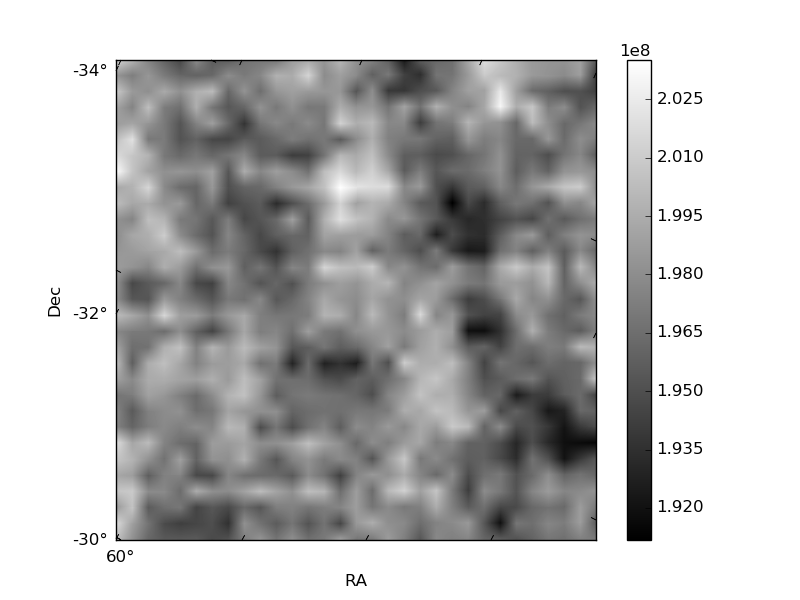
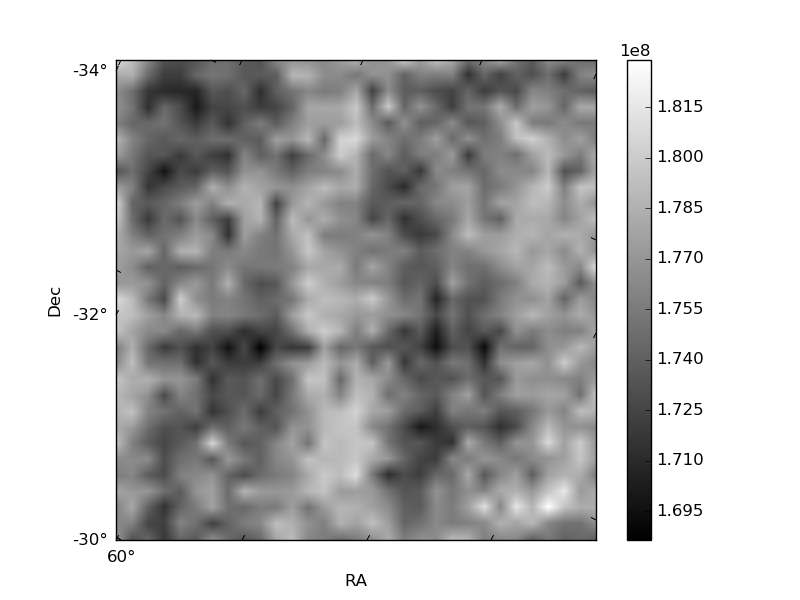
Quadrant B |
|---|---|---|---|
| Quadrant D | 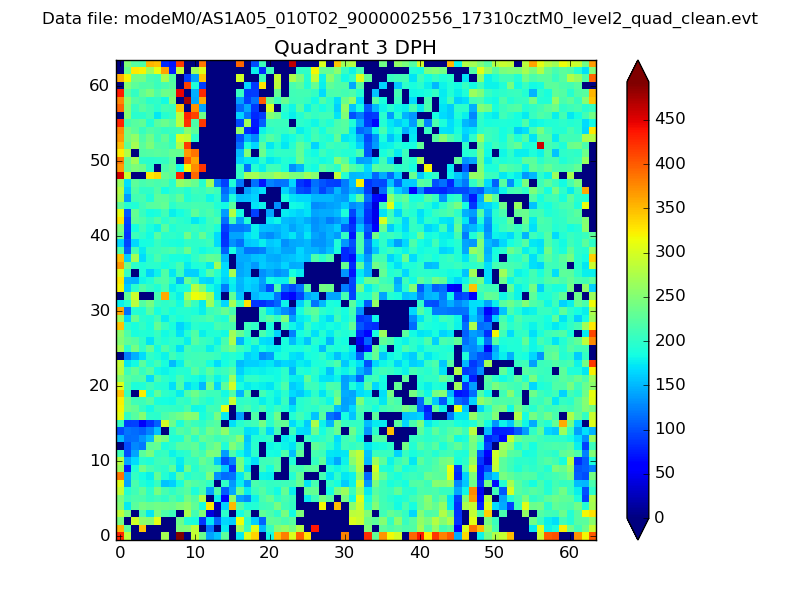 |
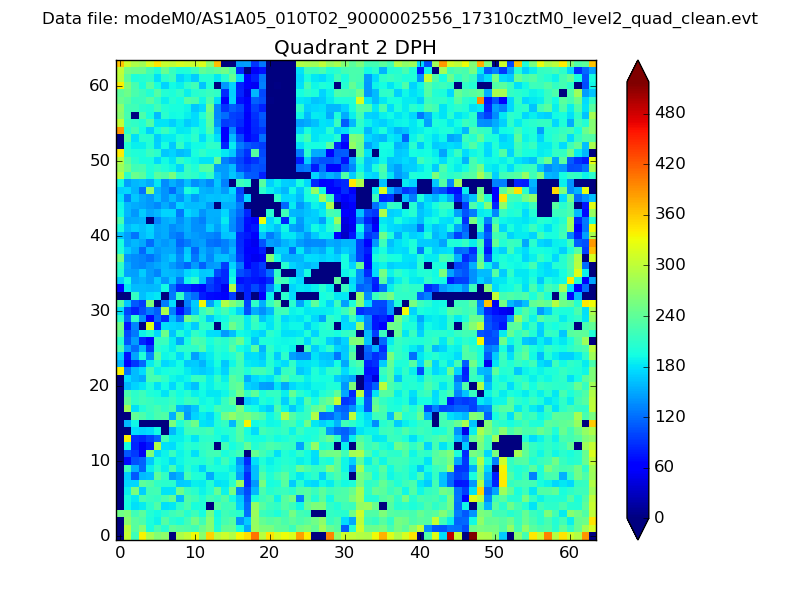 |
Quadrant C |
| Plot type | Count rate plots | Images |
|---|---|---|
| Comparison with Poisson distribution Blue bars denote a histogram of data divided into 1 sec bins. Red curve is a Poisson curve with rate = median count rate of data. |
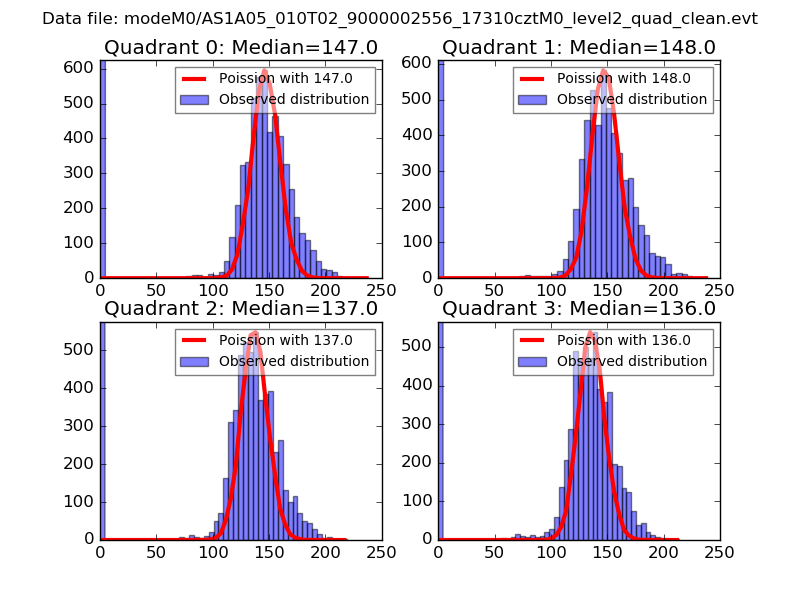 |
 |
| Quadrant-wise count rates Data is divided into 100 sec bins |
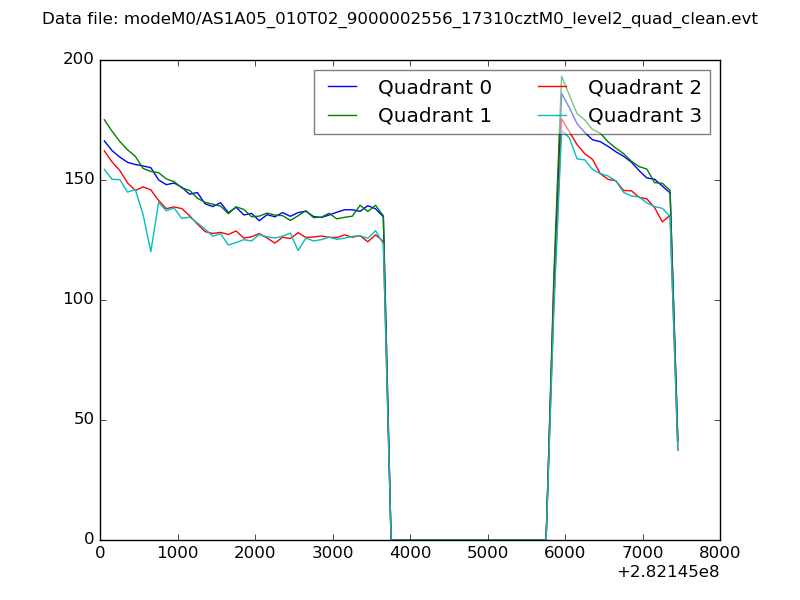 |
|
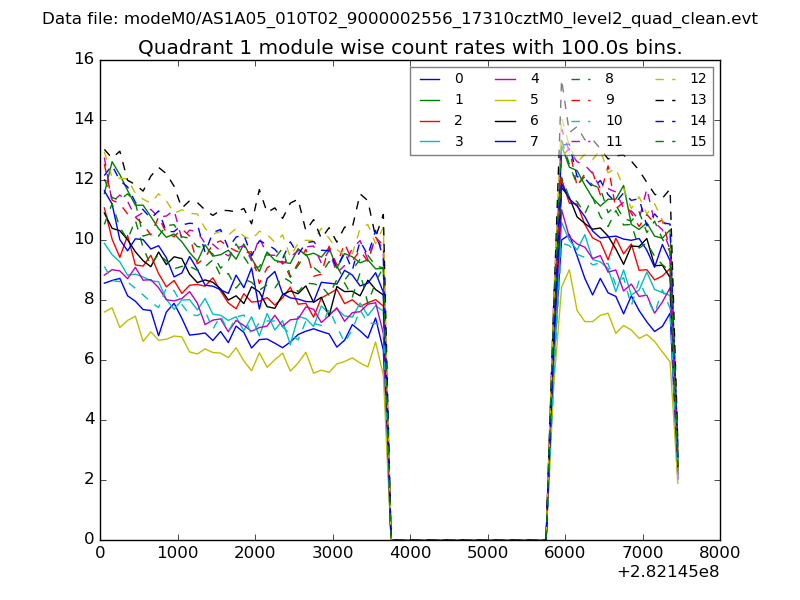
| Module-wise count rates for Quadrant A Data is divided into 100 sec bins |
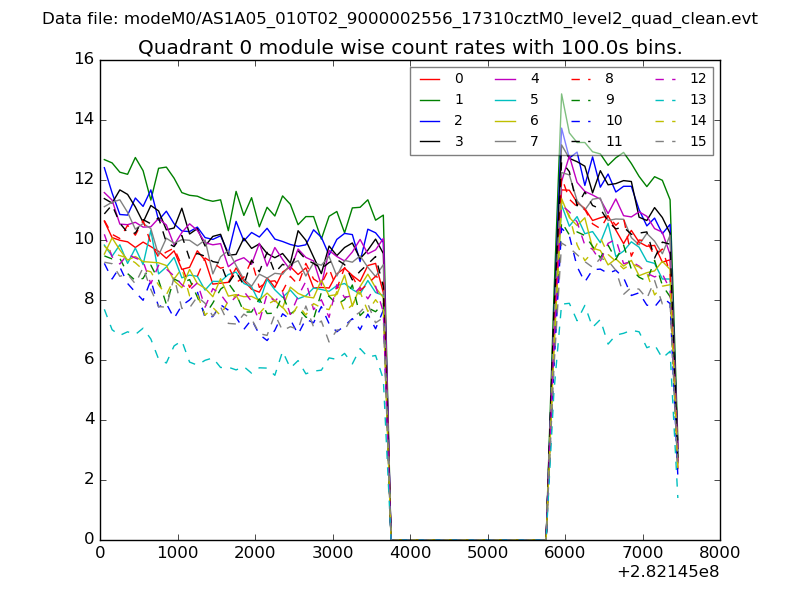 |
 |
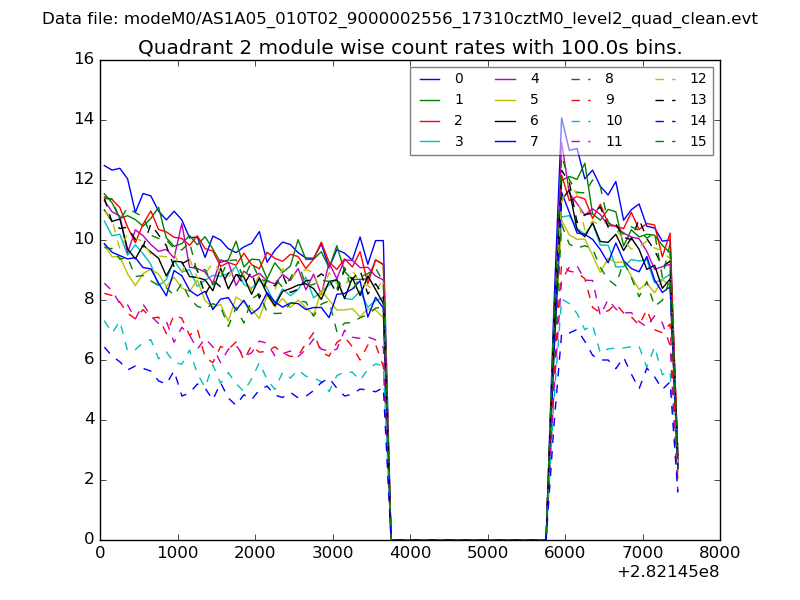
| Module-wise count rates for Quadrant B Data is divided into 100 sec bins |
 |
 |
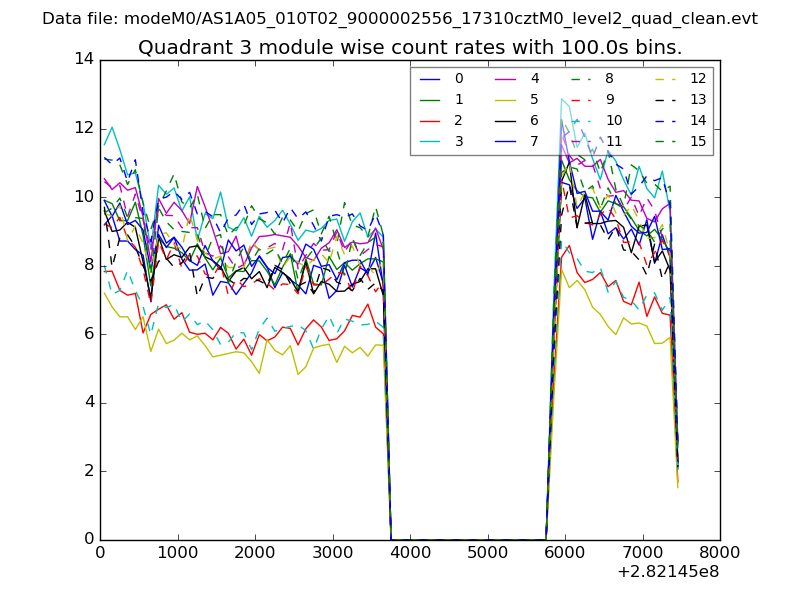
| Module-wise count rates for Quadrant C Data is divided into 100 sec bins |
 |
 |
| Module-wise count rates for Quadrant D Data is divided into 100 sec bins |
 |
 |
| Parameter | Plot |
|---|---|
| CZT HV Monitor | 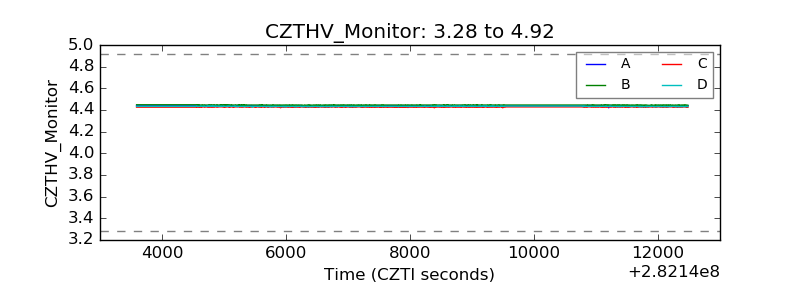 |
| D_VDD | 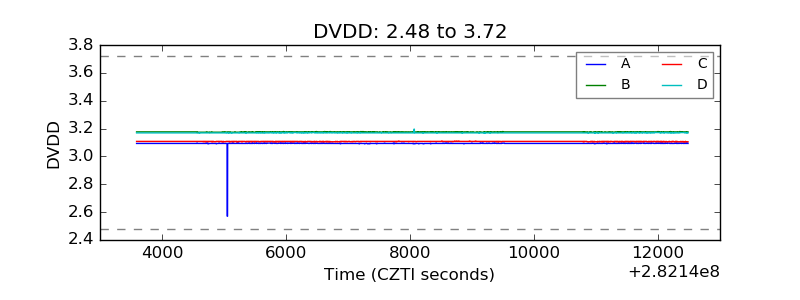 |
| Temperature 1 | 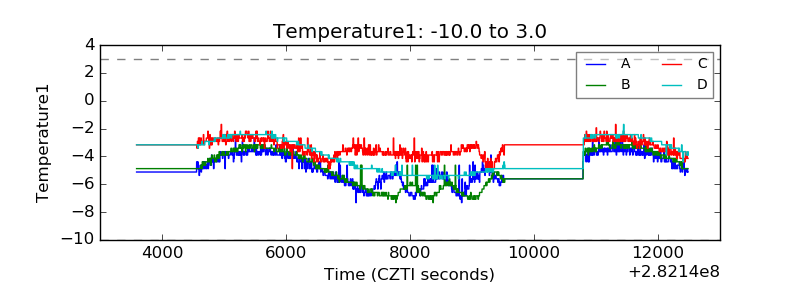 |
| Veto HV Monitor | 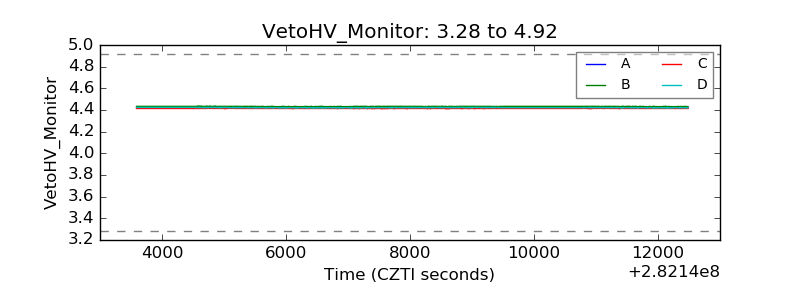 |
| Veto LLD | 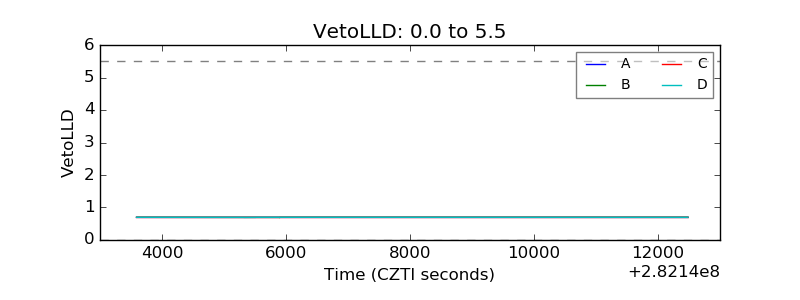 |
| Alpha Counter | 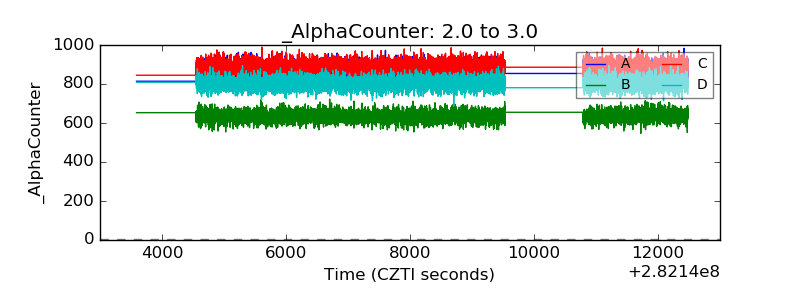 |
| _CPM_Rate | 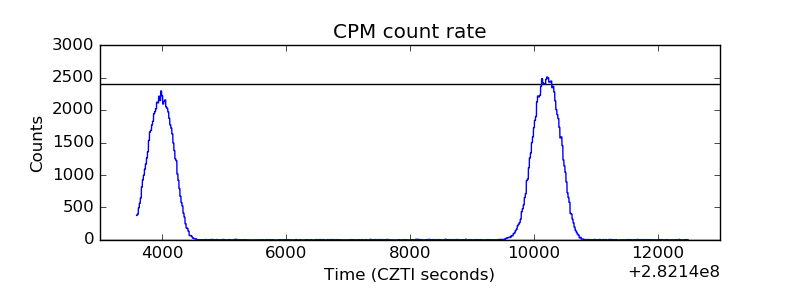 |
| CZT Counter | 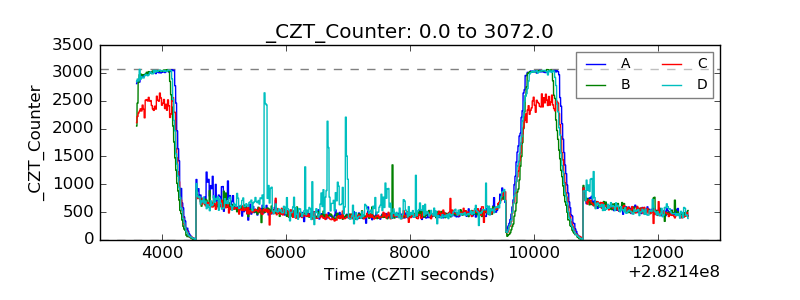 |
| +2.5 Volts monitor |  |
| +5 Volts monitor |  |
| _ROLL_ROT | 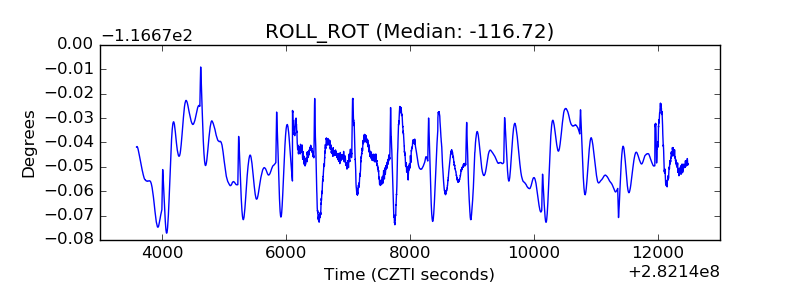 |
| _Roll_DEC |  |
| _Roll_RA | 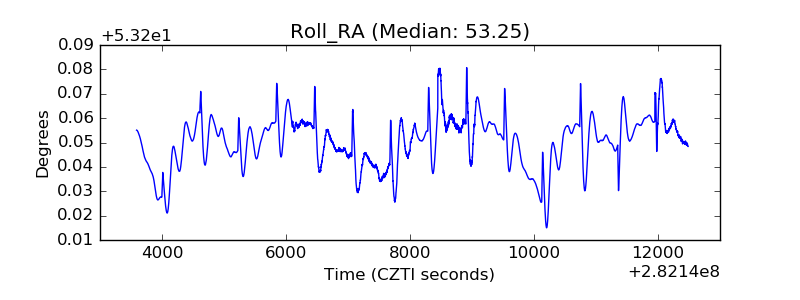 |
| Veto Counter | 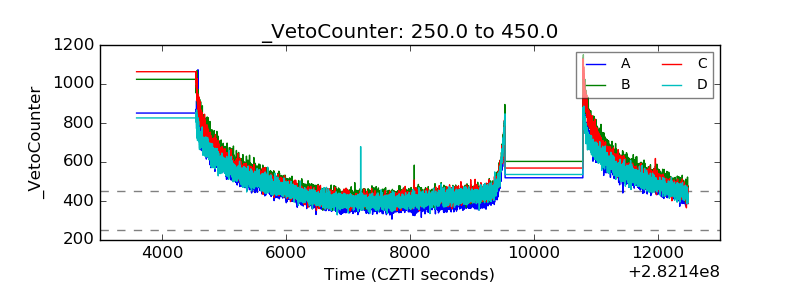 |