| Param | Original file | Final file |
|---|---|---|
| Filename | modeM0/AS1A05_010T02_9000002556_17311cztM0_level2.evt | modeM0/AS1A05_010T02_9000002556_17311cztM0_level2_quad_clean.evt |
| Size (bytes) | 424,094,400 | 110,010,240 |
| Size | 404.4 MB | 104.9 MB |
| Events in quadrant A | 3,073,431 | 752,627 |
| Events in quadrant B | 3,096,439 | 759,339 |
| Events in quadrant C | 3,009,897 | 696,805 |
| Events in quadrant D | 3,243,560 | 691,587 |
| Mode M0 | |||
|---|---|---|---|
| Quadrant | BADHDUFLAG | Total packets | Discarded packets |
| A | 0 | 13028 | 1 |
| B | 0 | 13027 | 1 |
| C | 0 | 12868 | 1 |
| D | 0 | 13642 | 1 |
| Mode M9 | |||
|---|---|---|---|
| Quadrant | BADHDUFLAG | Total packets | Discarded packets |
| A | 0 | 13 | 0 |
| B | 0 | 13 | 0 |
| C | 0 | 13 | 0 |
| D | 0 | 13 | 0 |
| Mode SS | |||
|---|---|---|---|
| Quadrant | BADHDUFLAG | Total packets | Discarded packets |
| A | 0 | 126 | 0 |
| B | 0 | 126 | 0 |
| C | 0 | 126 | 0 |
| D | 0 | 126 | 0 |
| Quadrant | Total seconds | Saturated seconds | Saturation percentage |
|---|---|---|---|
| A | 6181 | 78 | 1.261932% |
| B | 6181 | 86 | 1.391361% |
| C | 6181 | 76 | 1.229575% |
| D | 6181 | 75 | 1.213396% |
Noise dominated data is calculated using 1-second bins in cleaned event files. If a bin has >2000 counts, and if more than 50% of those come from <1% of pixels, then it is considered to be noise-dominated and hence unusable.
| Quadrant | # 1 sec bins | Bins with >0 counts | Bins with >2000 counts | High rate bins dominated by noise | Noise dominated (total time) | Noise dominated (detector-on time) | Marked lightcurve |
|---|---|---|---|---|---|---|---|
| A | 7506 | 6182 | 0 | 0 | 0.00% | 0.00% | 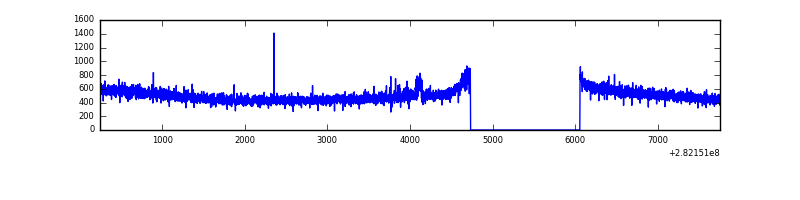 |
| B | 7506 | 6182 | 0 | 0 | 0.00% | 0.00% | 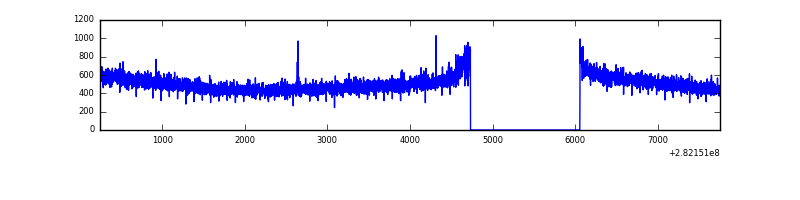 |
| C | 7506 | 6182 | 0 | 0 | 0.00% | 0.00% | 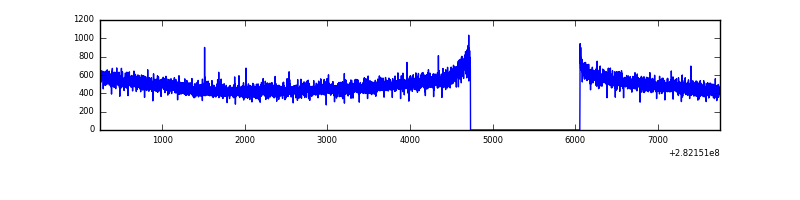 |
| D | 7506 | 6182 | 11 | 11 | 0.15% | 0.18% | 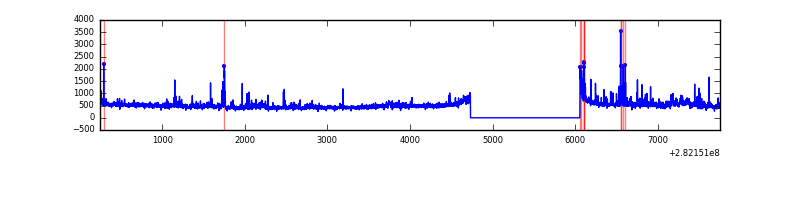 |
Top three noisy pixels from each quadrant. If the there are fewer than three noisy pixels in the level2.evt file, extra rows are filled as -1
| Pixel properties | Quadrant properties | ||||||
|---|---|---|---|---|---|---|---|
| Quadrant | DetID | PixID | Counts | Sigma | Mean | Median | Sigma |
| A | 0 | 23 | 16061 | 96.09 | 796 | 782 | 159.0 |
| A | 0 | 226 | 7794 | 44.1 | 796 | 782 | 159.0 |
| A | 3 | 137 | 5705 | 30.96 | 796 | 782 | 159.0 |
| B | 12 | 111 | 17396 | 110.77 | 793 | 776 | 150.0 |
| B | 11 | 111 | 15261 | 96.54 | 793 | 776 | 150.0 |
| B | 14 | 111 | 13280 | 83.34 | 793 | 776 | 150.0 |
| C | 14 | 238 | 116032 | 673.37 | 738 | 743 | 171.2 |
| C | 3 | 233 | 14421 | 79.89 | 738 | 743 | 171.2 |
| C | 13 | 61 | 5349 | 26.9 | 738 | 743 | 171.2 |
| D | 5 | 222 | 172724 | 944.95 | 753 | 730 | 182.0 |
| D | 1 | 52 | 77146 | 419.83 | 753 | 730 | 182.0 |
| D | 11 | 176 | 57174 | 310.11 | 753 | 730 | 182.0 |
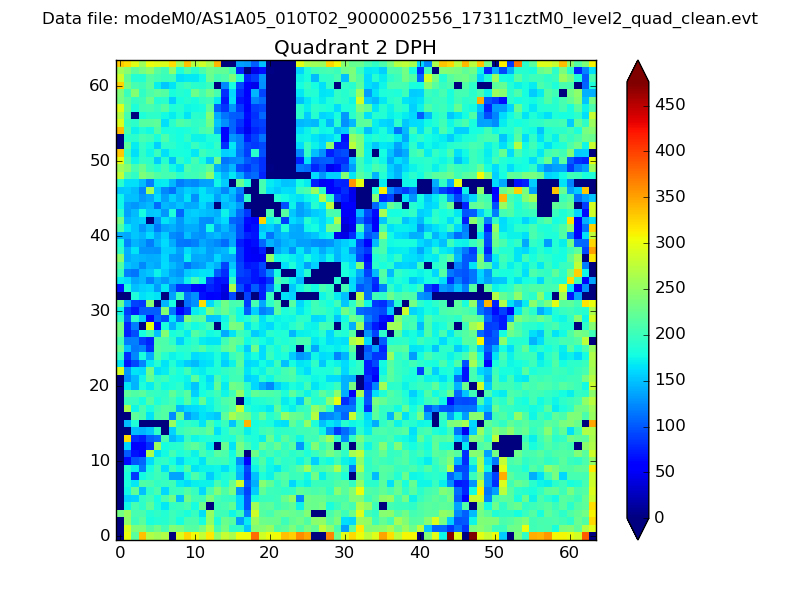
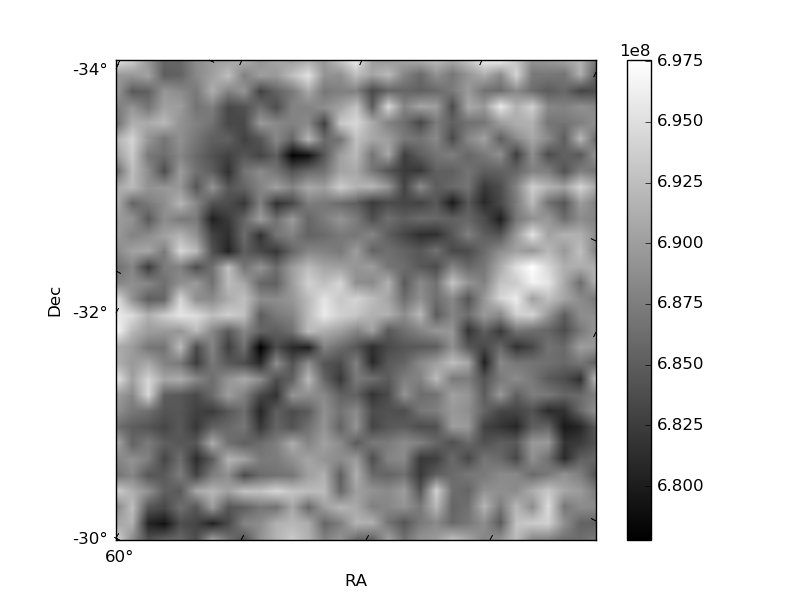
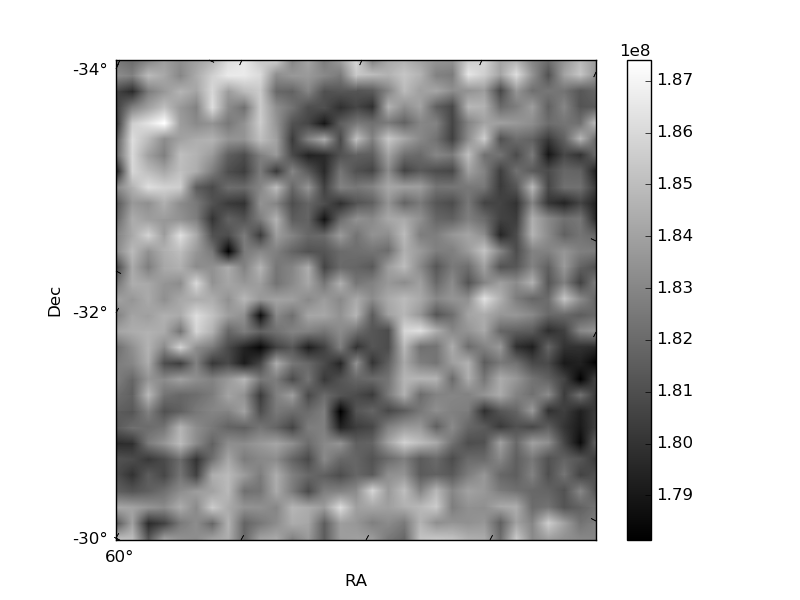
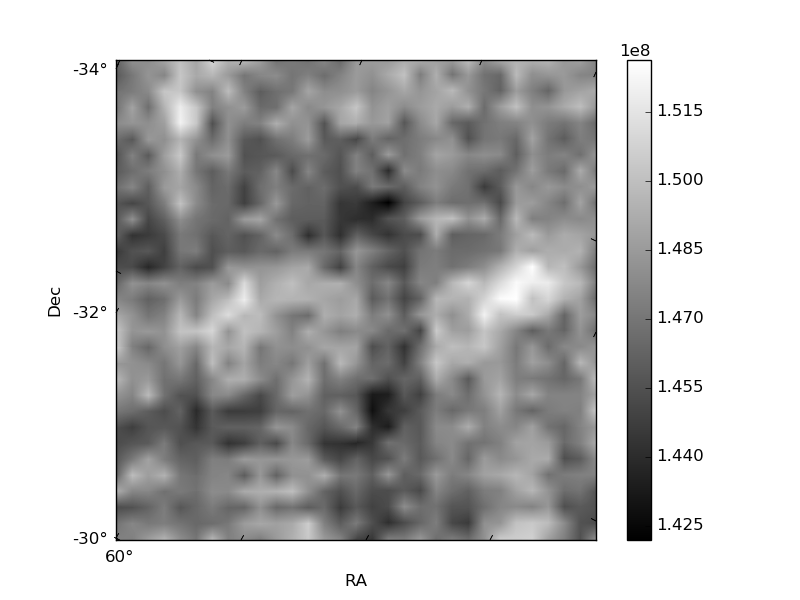
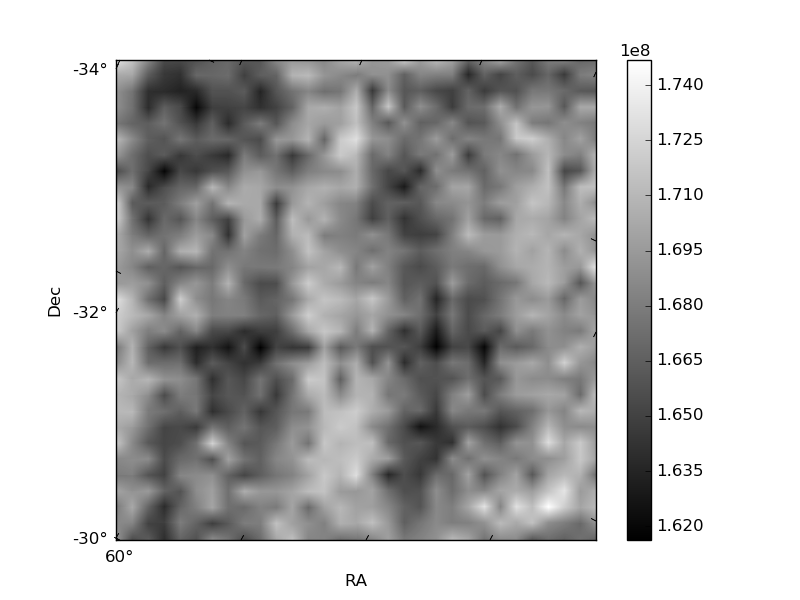
Histogram calculated using DETX and DETY for each event in the final _common_clean file
| Quadrant A | 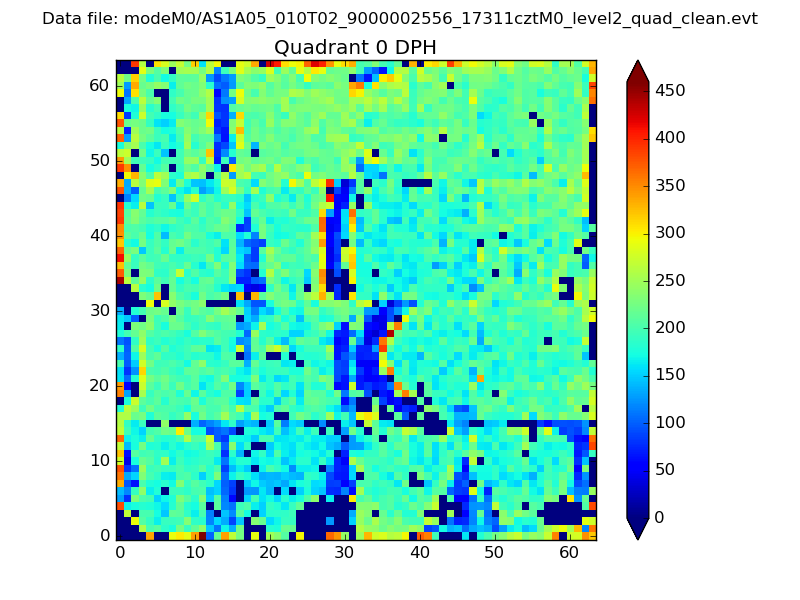 |
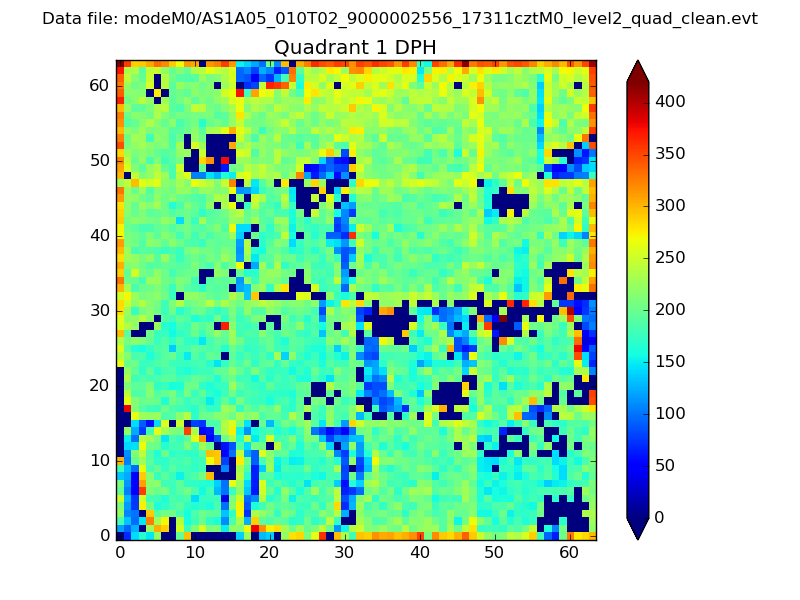 |
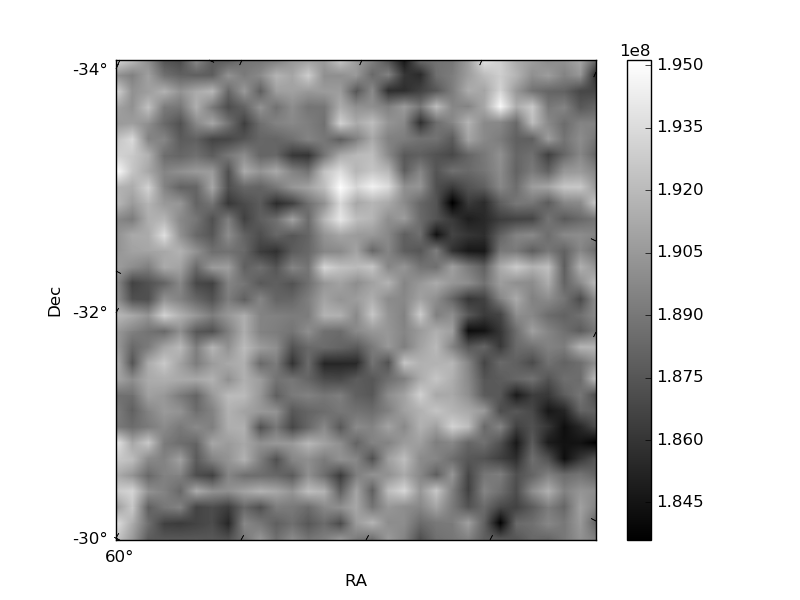
Quadrant B |
|---|---|---|---|
| Quadrant D | 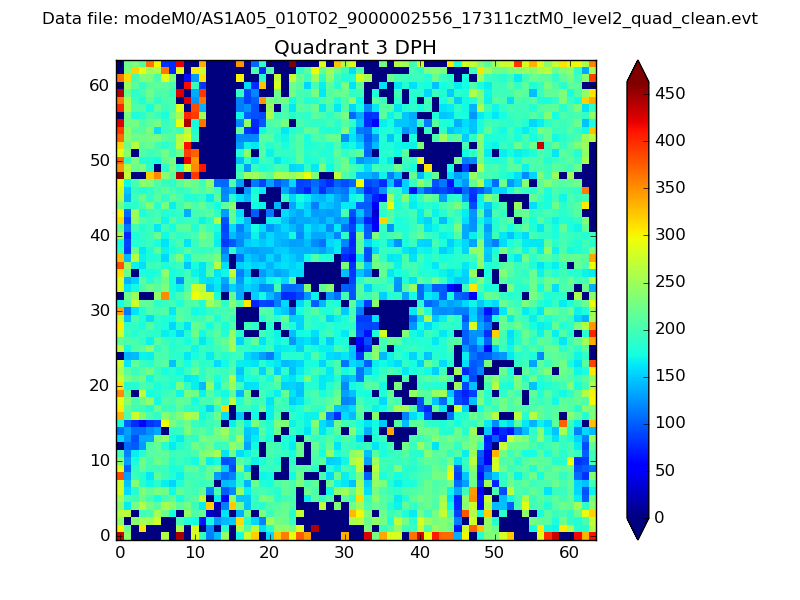 |
 |
Quadrant C |
| Plot type | Count rate plots | Images |
|---|---|---|
| Comparison with Poisson distribution Blue bars denote a histogram of data divided into 1 sec bins. Red curve is a Poisson curve with rate = median count rate of data. |
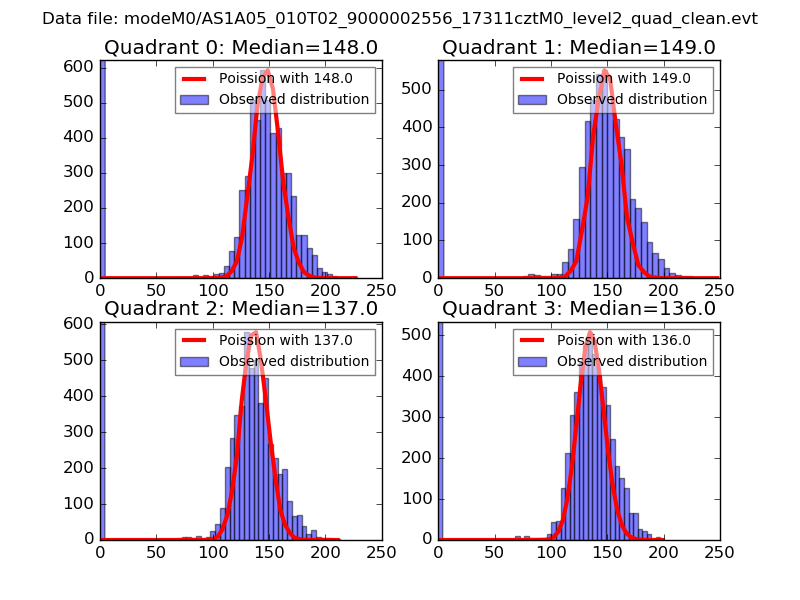 |
 |
| Quadrant-wise count rates Data is divided into 100 sec bins |
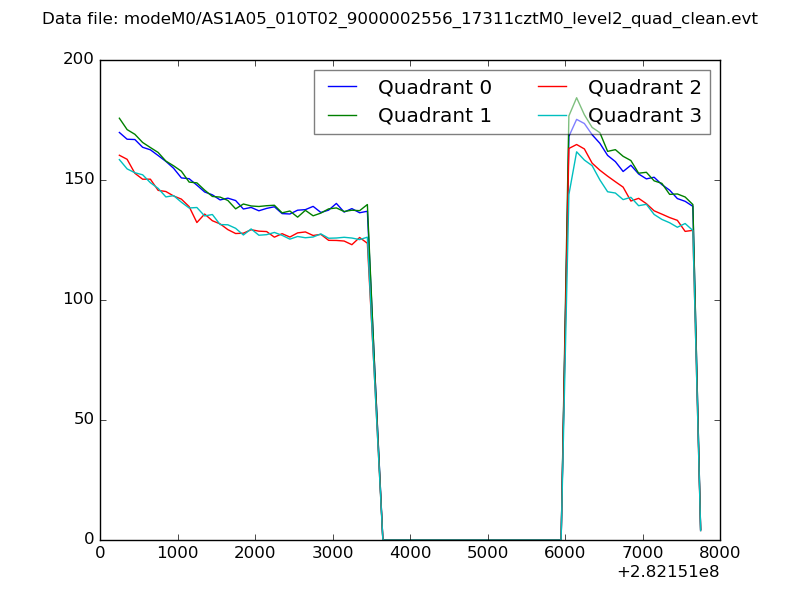 |
|
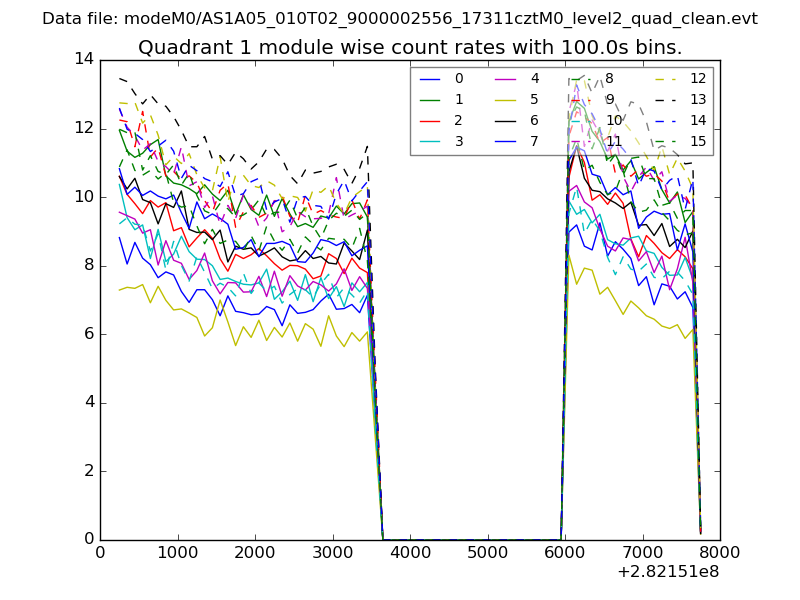
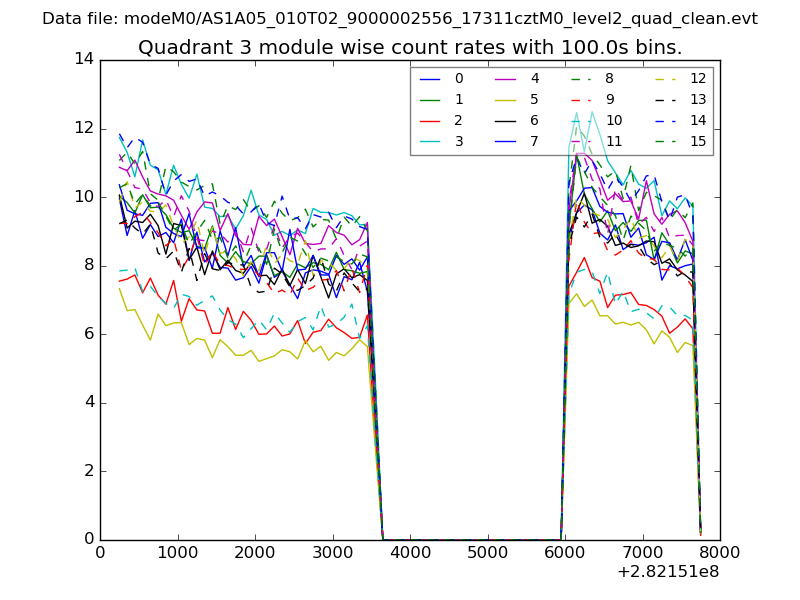
| Module-wise count rates for Quadrant A Data is divided into 100 sec bins |
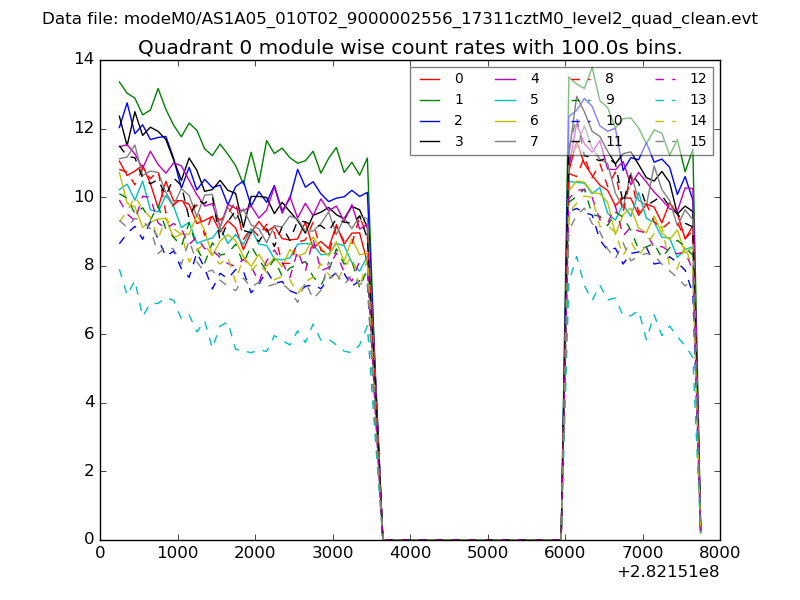 |
 |
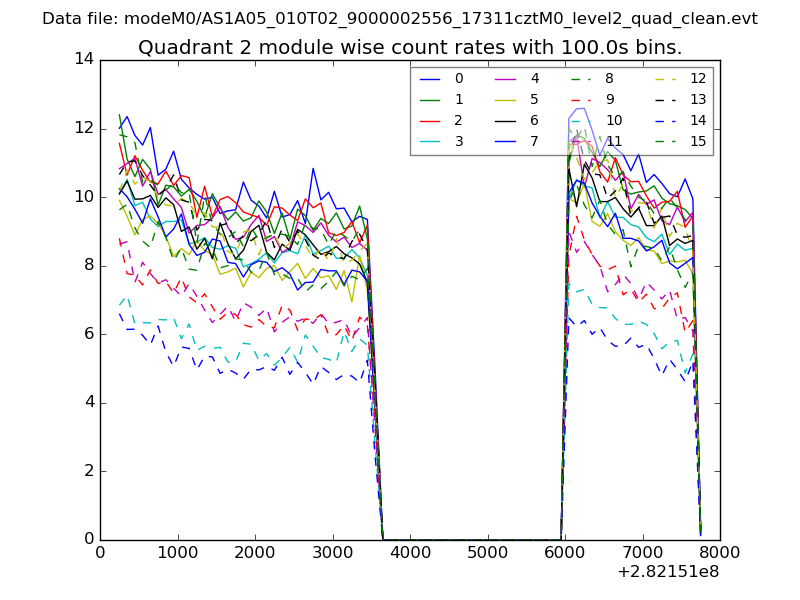
| Module-wise count rates for Quadrant B Data is divided into 100 sec bins |
 |
 |
| Module-wise count rates for Quadrant C Data is divided into 100 sec bins |
 |
 |
| Module-wise count rates for Quadrant D Data is divided into 100 sec bins |
 |
 |
| Parameter | Plot |
|---|---|
| CZT HV Monitor | 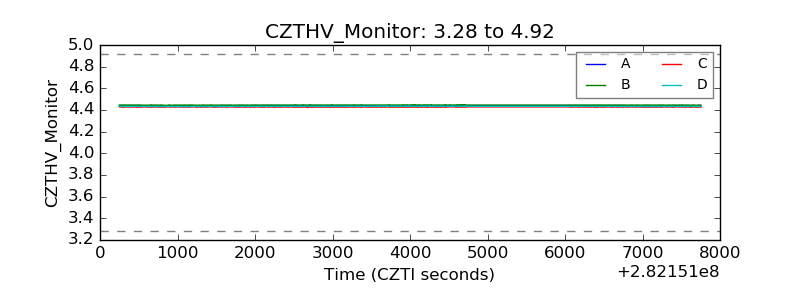 |
| D_VDD | 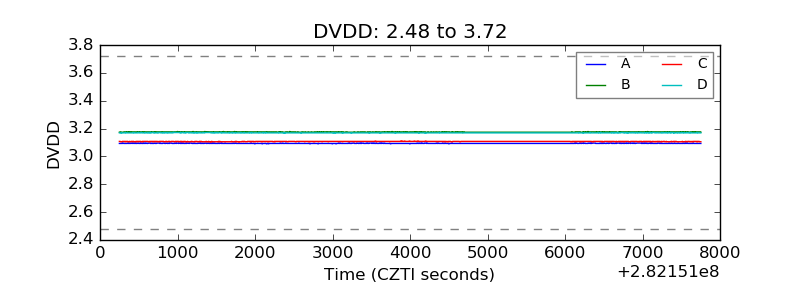 |
| Temperature 1 | 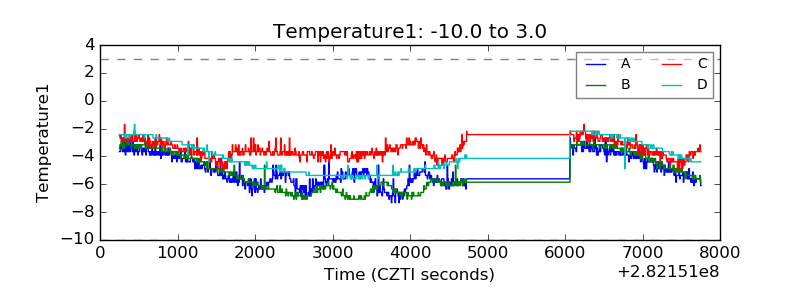 |
| Veto HV Monitor | 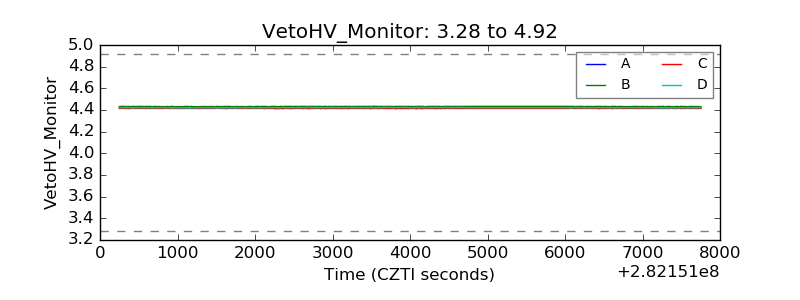 |
| Veto LLD | 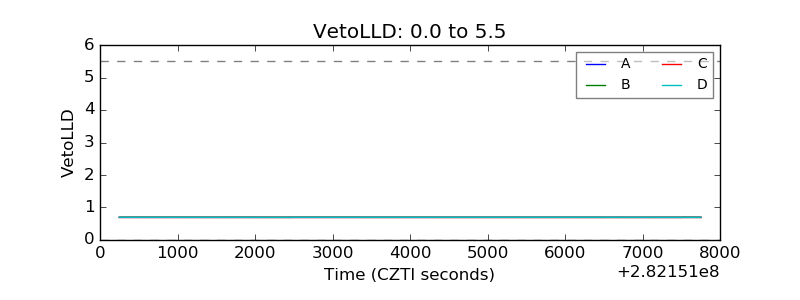 |
| Alpha Counter | 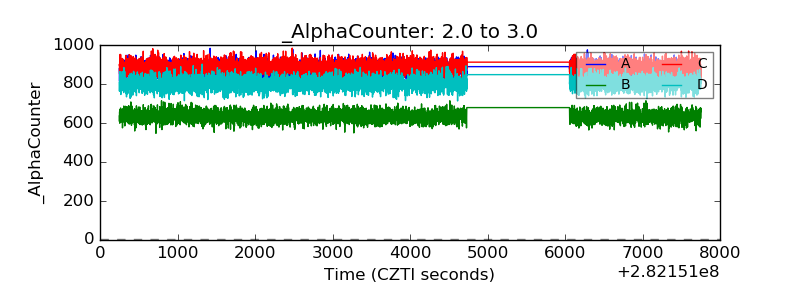 |
| _CPM_Rate | 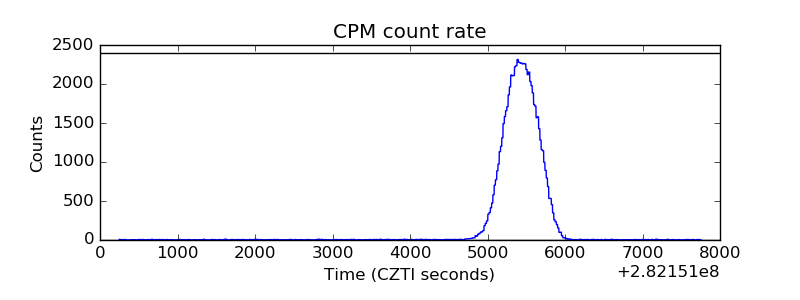 |
| CZT Counter | 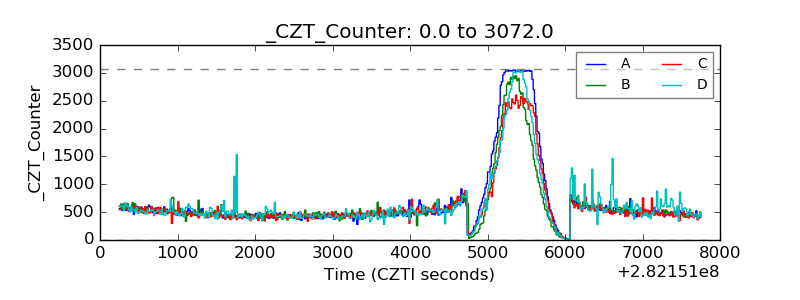 |
| +2.5 Volts monitor |  |
| +5 Volts monitor | 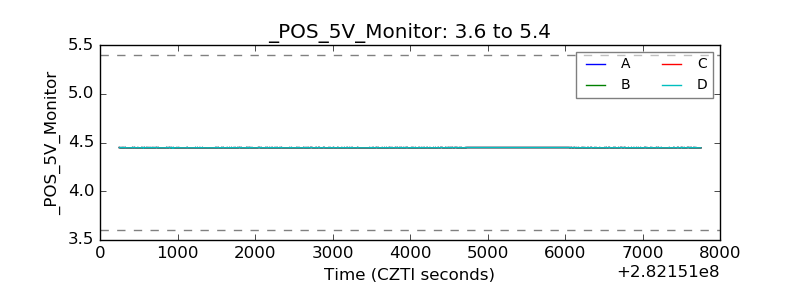 |
| _ROLL_ROT | 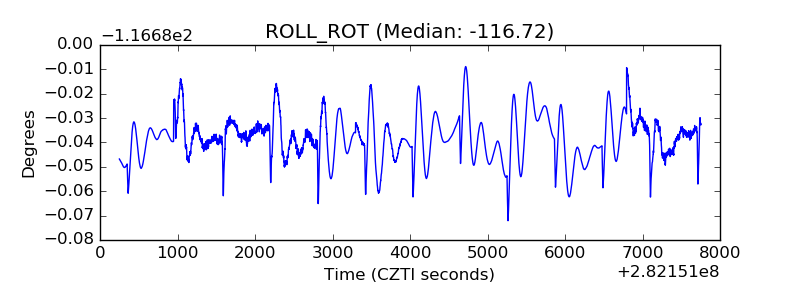 |
| _Roll_DEC | 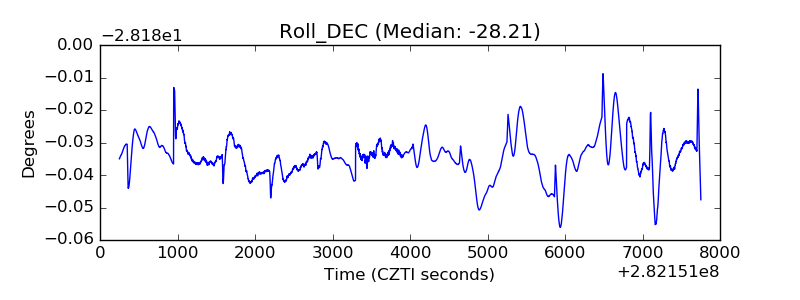 |
| _Roll_RA | 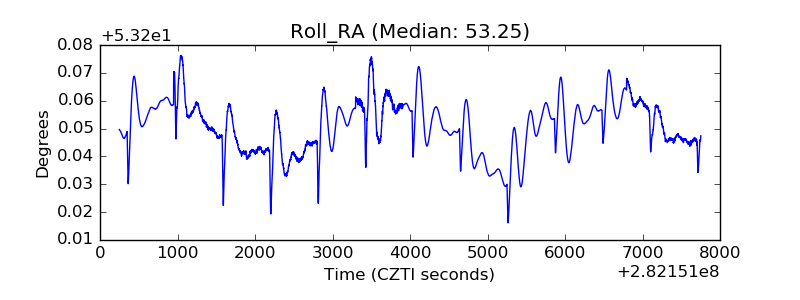 |
| Veto Counter | 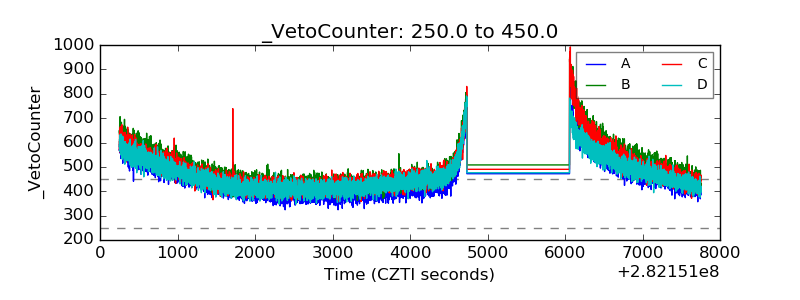 |