| Param | Original file | Final file |
|---|---|---|
| Filename | modeM0/AS1A05_010T02_9000002556_17312cztM0_level2.evt | modeM0/AS1A05_010T02_9000002556_17312cztM0_level2_quad_clean.evt |
| Size (bytes) | 438,076,800 | 102,755,520 |
| Size | 417.8 MB | 98.0 MB |
| Events in quadrant A | 3,121,557 | 690,275 |
| Events in quadrant B | 3,145,729 | 698,006 |
| Events in quadrant C | 3,060,844 | 642,209 |
| Events in quadrant D | 3,507,525 | 638,582 |
| Mode M0 | |||
|---|---|---|---|
| Quadrant | BADHDUFLAG | Total packets | Discarded packets |
| A | 0 | 13333 | 1 |
| B | 0 | 13331 | 2 |
| C | 0 | 13185 | 1 |
| D | 0 | 14714 | 1 |
| Mode M9 | |||
|---|---|---|---|
| Quadrant | BADHDUFLAG | Total packets | Discarded packets |
| A | 0 | 13 | 0 |
| B | 0 | 13 | 0 |
| C | 0 | 13 | 0 |
| D | 0 | 13 | 0 |
| Mode SS | |||
|---|---|---|---|
| Quadrant | BADHDUFLAG | Total packets | Discarded packets |
| A | 0 | 128 | 0 |
| B | 0 | 128 | 0 |
| C | 0 | 128 | 0 |
| D | 0 | 128 | 0 |
| Quadrant | Total seconds | Saturated seconds | Saturation percentage |
|---|---|---|---|
| A | 6352 | 82 | 1.290932% |
| B | 6352 | 87 | 1.369647% |
| C | 6352 | 76 | 1.196474% |
| D | 6352 | 107 | 1.684509% |
Noise dominated data is calculated using 1-second bins in cleaned event files. If a bin has >2000 counts, and if more than 50% of those come from <1% of pixels, then it is considered to be noise-dominated and hence unusable.
| Quadrant | # 1 sec bins | Bins with >0 counts | Bins with >2000 counts | High rate bins dominated by noise | Noise dominated (total time) | Noise dominated (detector-on time) | Marked lightcurve |
|---|---|---|---|---|---|---|---|
| A | 7627 | 6353 | 0 | 0 | 0.00% | 0.00% |  |
| B | 7627 | 6353 | 1 | 1 | 0.01% | 0.02% | 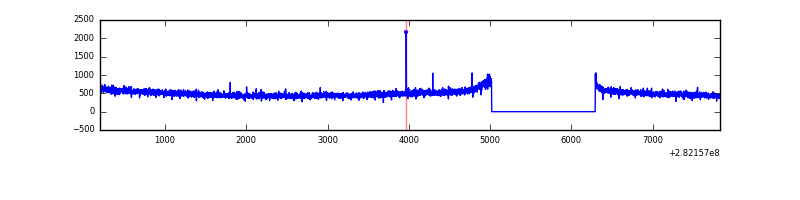 |
| C | 7627 | 6353 | 0 | 0 | 0.00% | 0.00% | 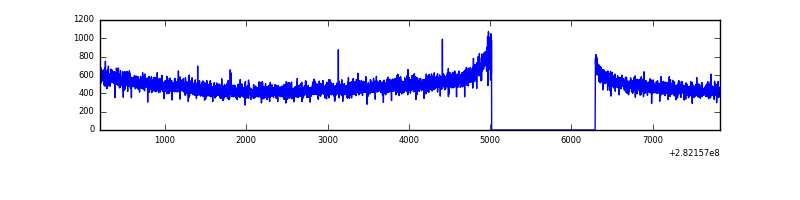 |
| D | 7627 | 6353 | 41 | 41 | 0.54% | 0.65% | 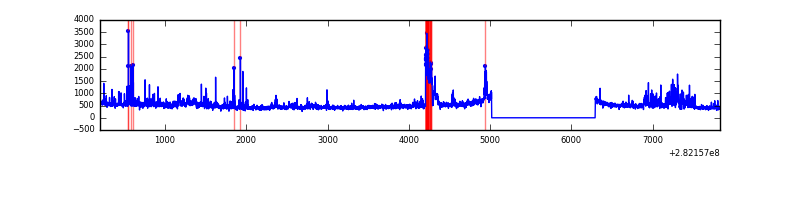 |
Top three noisy pixels from each quadrant. If the there are fewer than three noisy pixels in the level2.evt file, extra rows are filled as -1
| Pixel properties | Quadrant properties | ||||||
|---|---|---|---|---|---|---|---|
| Quadrant | DetID | PixID | Counts | Sigma | Mean | Median | Sigma |
| A | 0 | 23 | 25435 | 152.52 | 806 | 792 | 161.6 |
| A | 0 | 226 | 8435 | 47.3 | 806 | 792 | 161.6 |
| A | 3 | 137 | 5938 | 31.85 | 806 | 792 | 161.6 |
| B | 12 | 111 | 18010 | 114.39 | 802 | 785 | 150.6 |
| B | 11 | 111 | 15555 | 98.09 | 802 | 785 | 150.6 |
| B | 14 | 111 | 13538 | 84.69 | 802 | 785 | 150.6 |
| C | 14 | 238 | 117932 | 674.45 | 750 | 756 | 173.7 |
| C | 3 | 233 | 17086 | 93.99 | 750 | 756 | 173.7 |
| C | 13 | 61 | 5301 | 26.16 | 750 | 756 | 173.7 |
| D | 11 | 176 | 297688 | 1611.06 | 760 | 740 | 184.3 |
| D | 5 | 222 | 202073 | 1092.31 | 760 | 740 | 184.3 |
| D | 1 | 52 | 94008 | 506.01 | 760 | 740 | 184.3 |
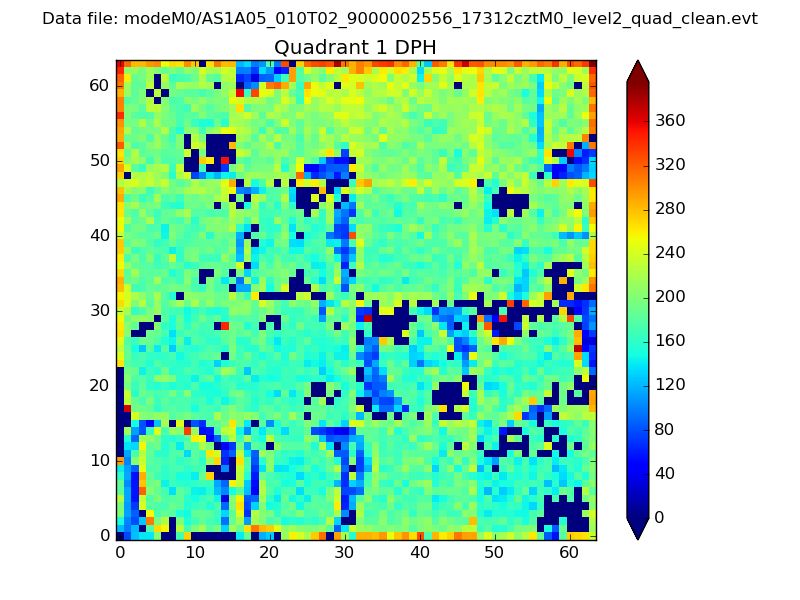
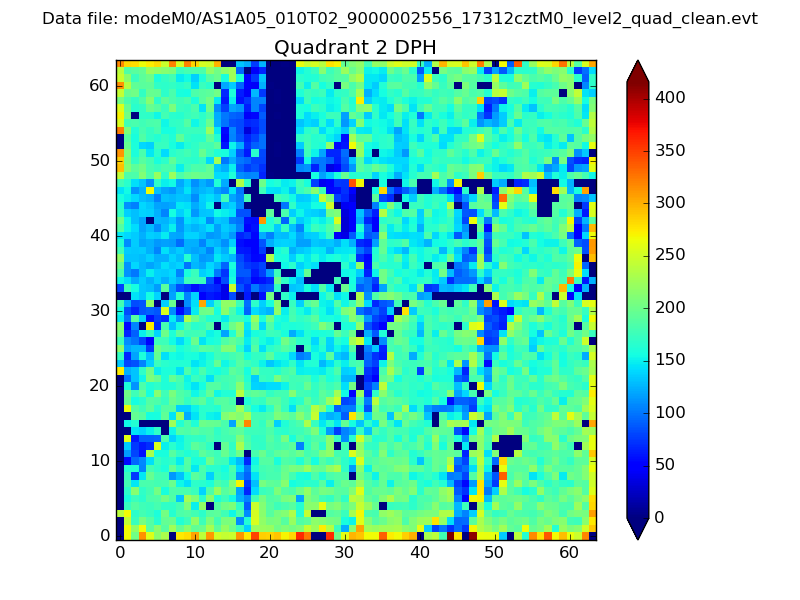
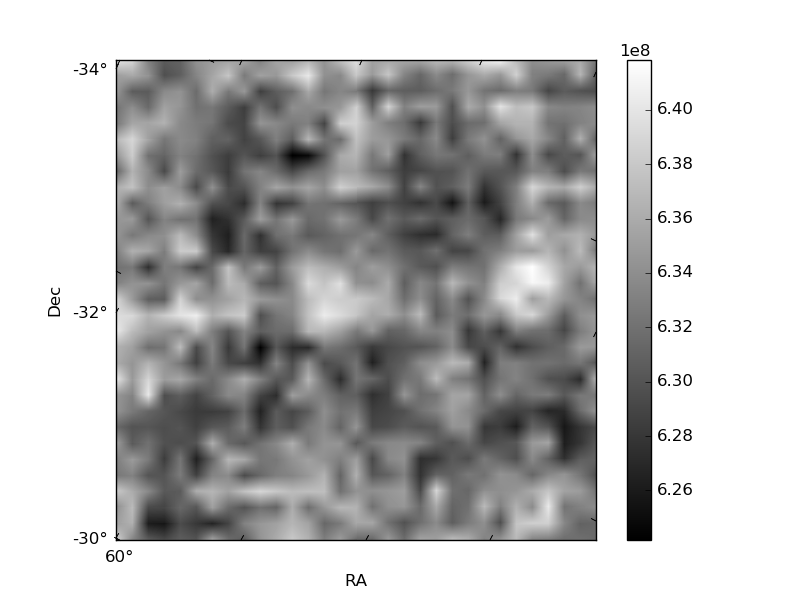
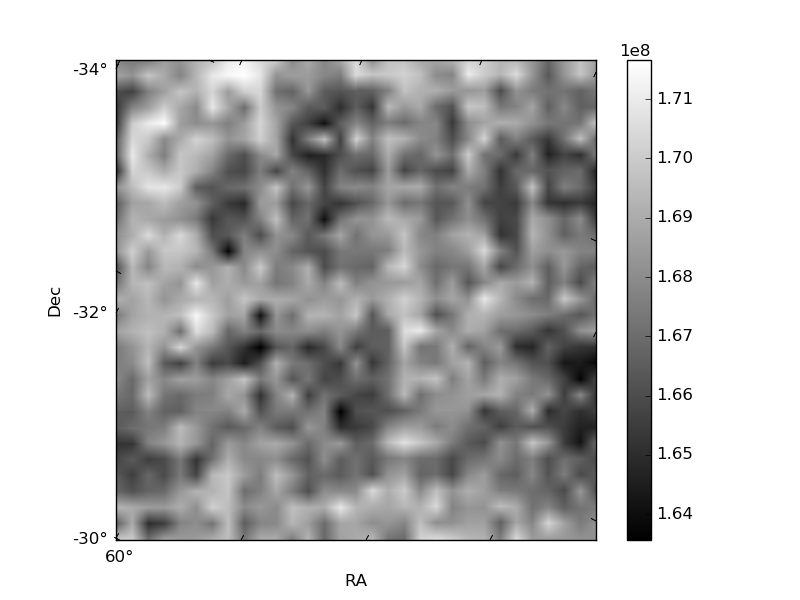
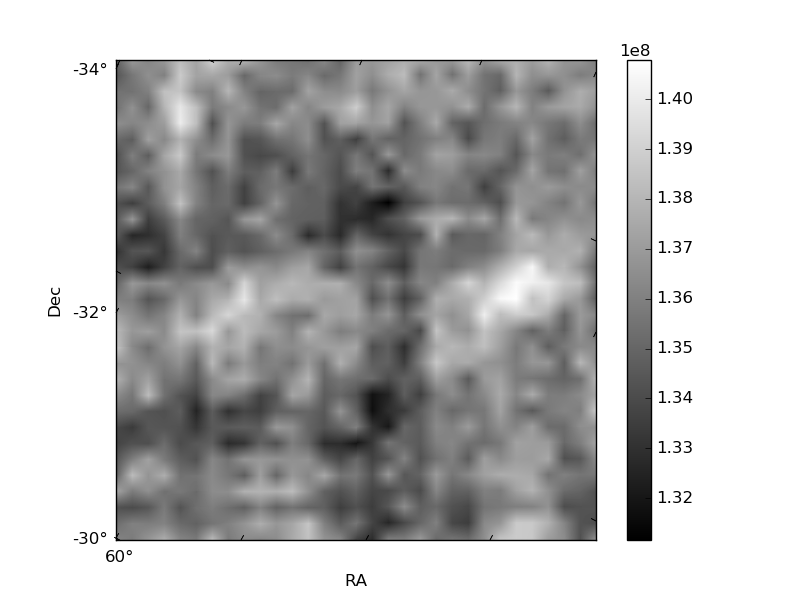
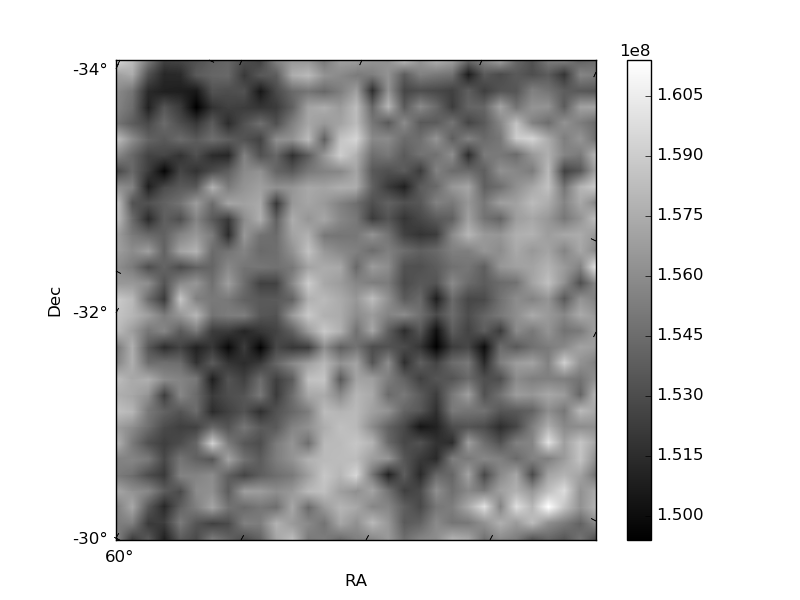
Histogram calculated using DETX and DETY for each event in the final _common_clean file
| Quadrant A | 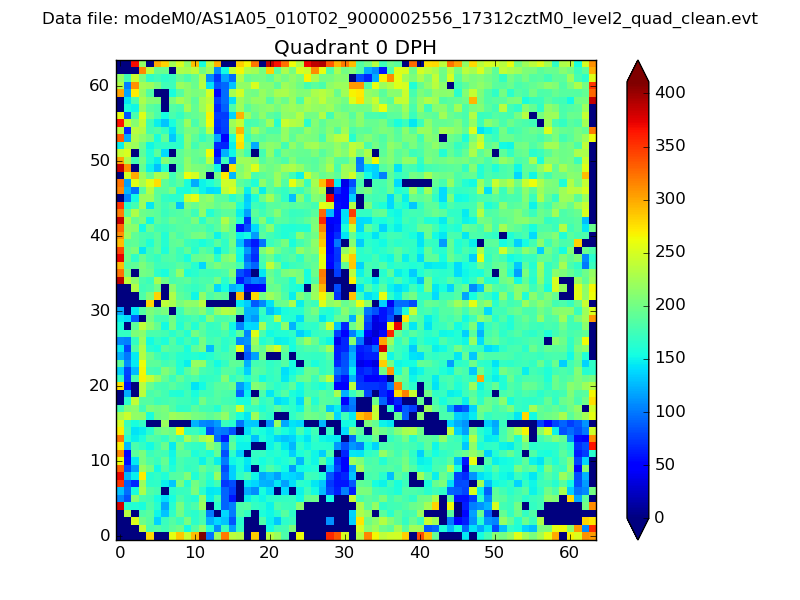 |
 |
Quadrant B |
|---|---|---|---|
| Quadrant D | 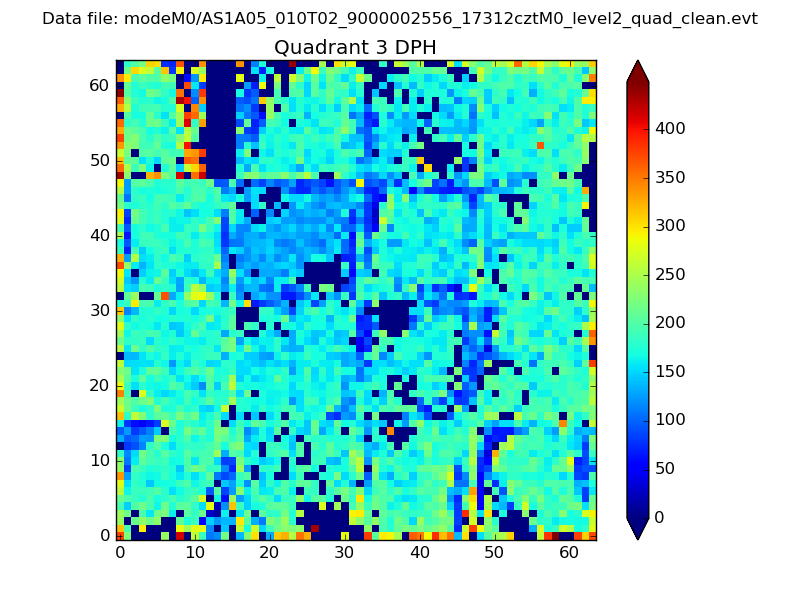 |
 |
Quadrant C |
| Plot type | Count rate plots | Images |
|---|---|---|
| Comparison with Poisson distribution Blue bars denote a histogram of data divided into 1 sec bins. Red curve is a Poisson curve with rate = median count rate of data. |
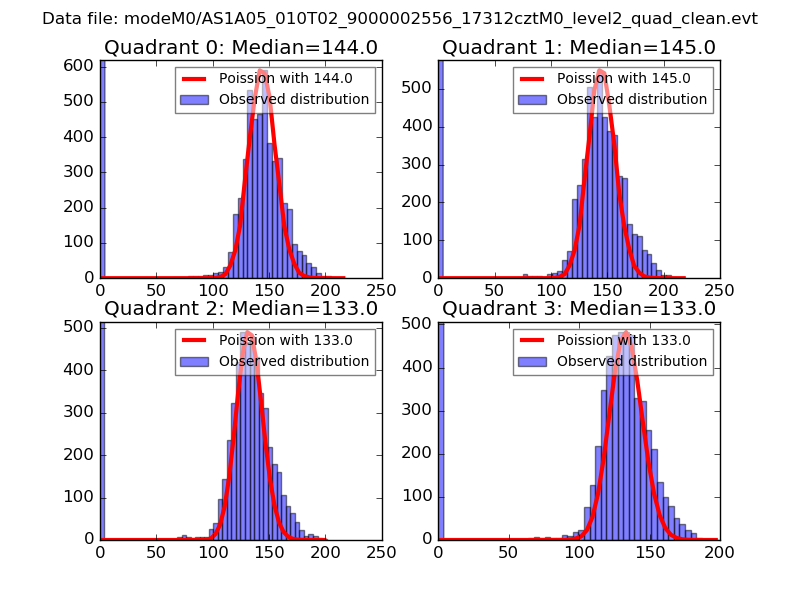 |
 |
| Quadrant-wise count rates Data is divided into 100 sec bins |
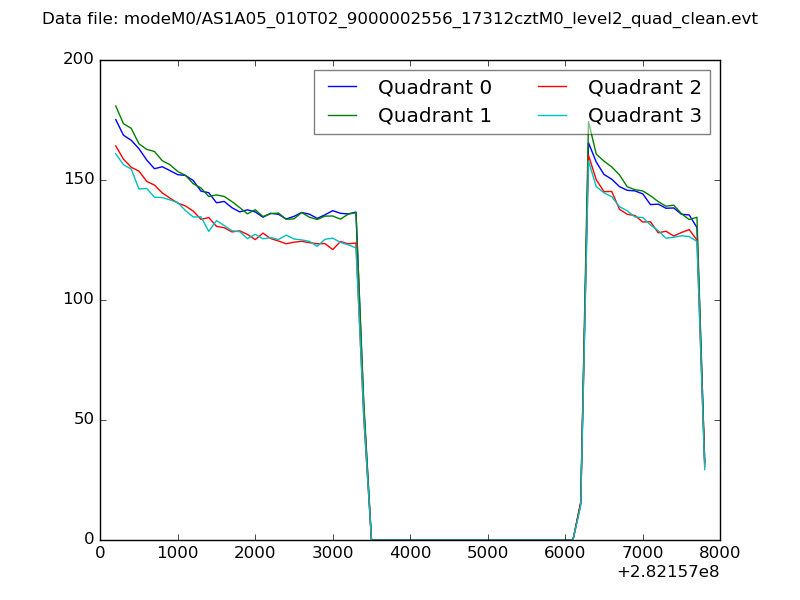 |
|
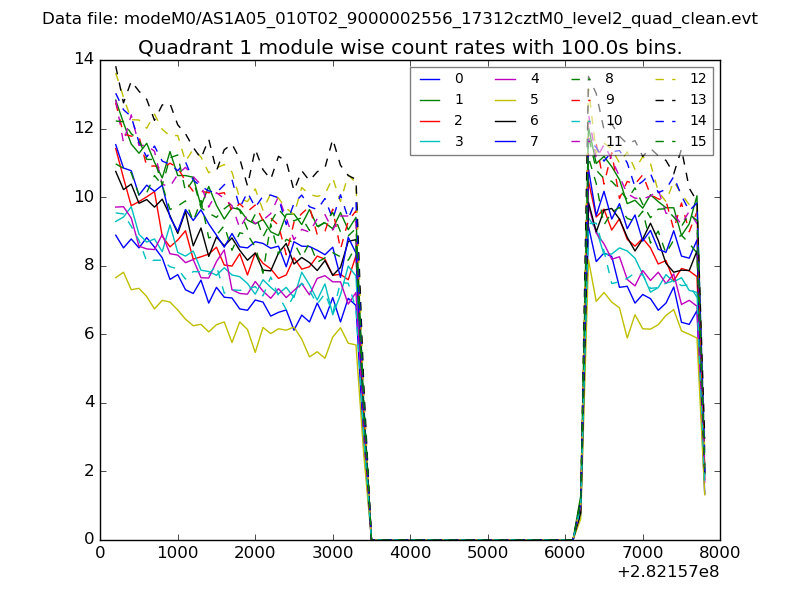
| Module-wise count rates for Quadrant A Data is divided into 100 sec bins |
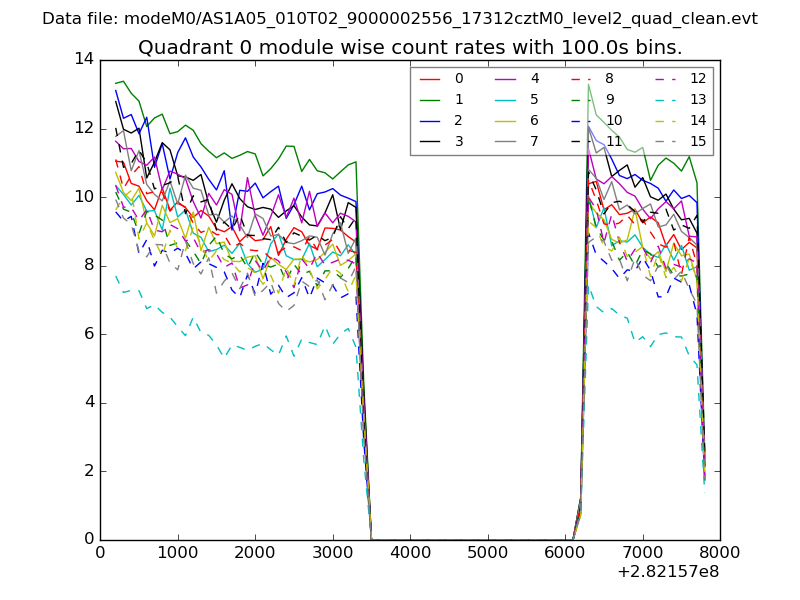 |
 |
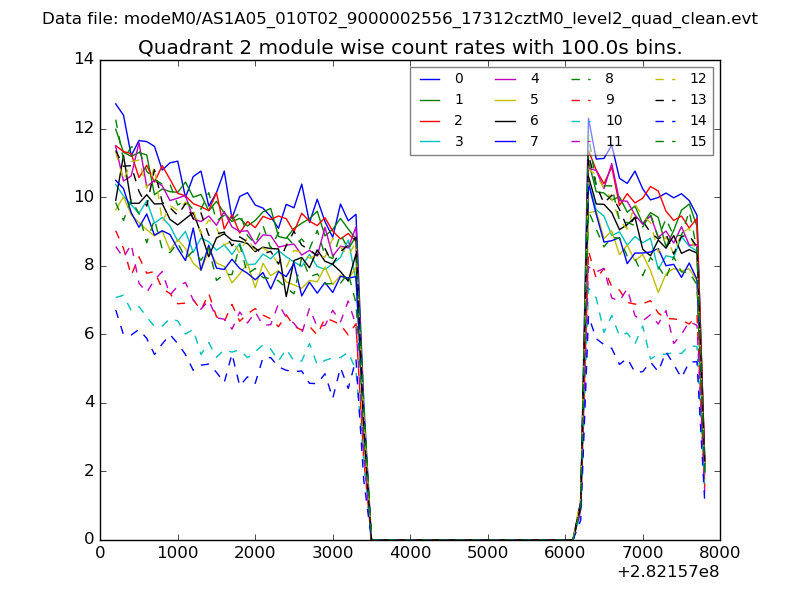
| Module-wise count rates for Quadrant B Data is divided into 100 sec bins |
 |
 |
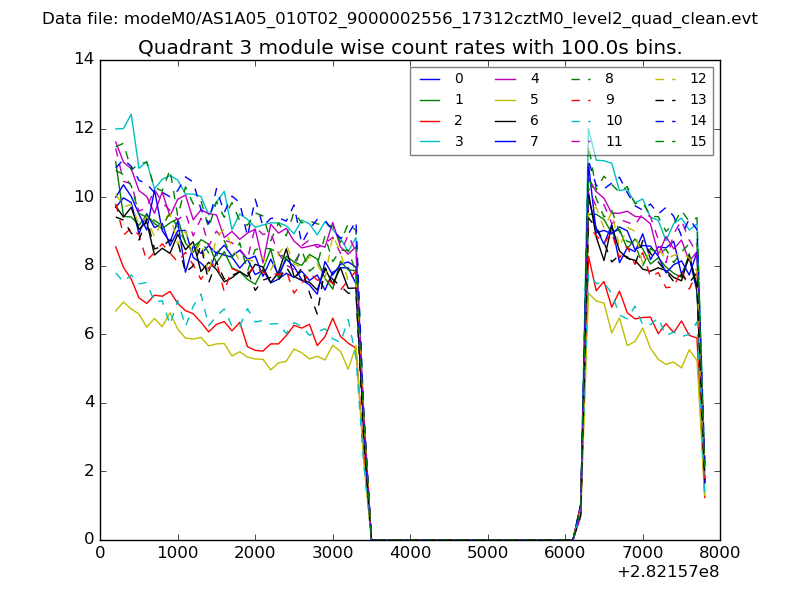
| Module-wise count rates for Quadrant C Data is divided into 100 sec bins |
 |
 |
| Module-wise count rates for Quadrant D Data is divided into 100 sec bins |
 |
 |
| Parameter | Plot |
|---|---|
| CZT HV Monitor | 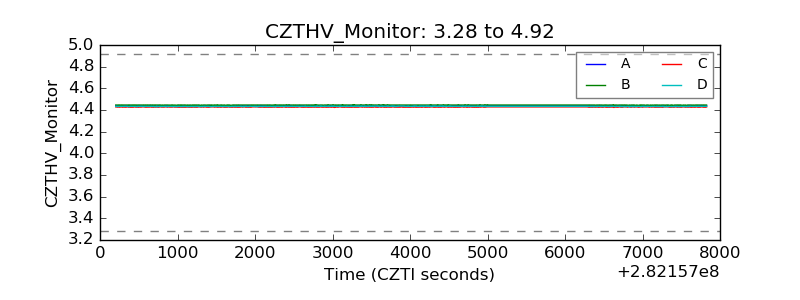 |
| D_VDD | 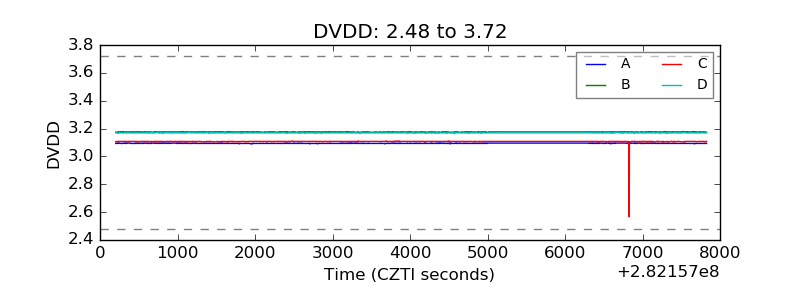 |
| Temperature 1 | 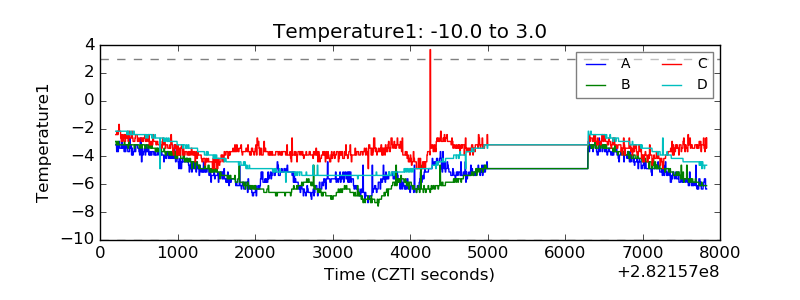 |
| Veto HV Monitor | 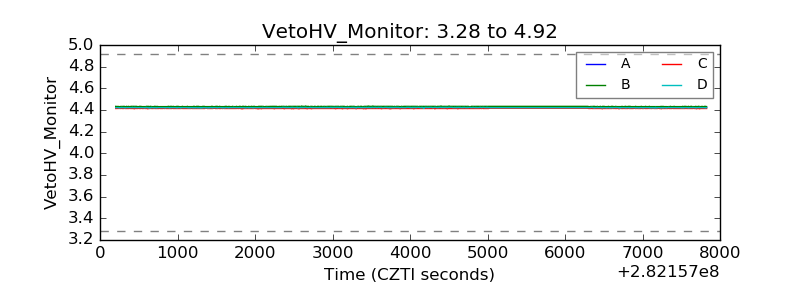 |
| Veto LLD | 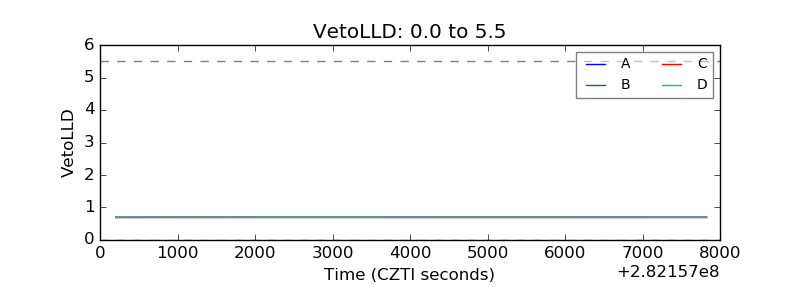 |
| Alpha Counter | 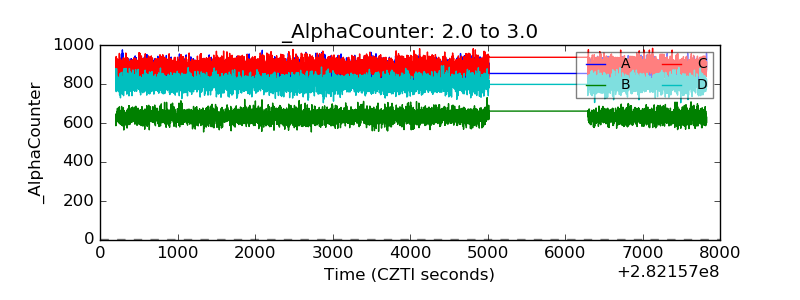 |
| _CPM_Rate | 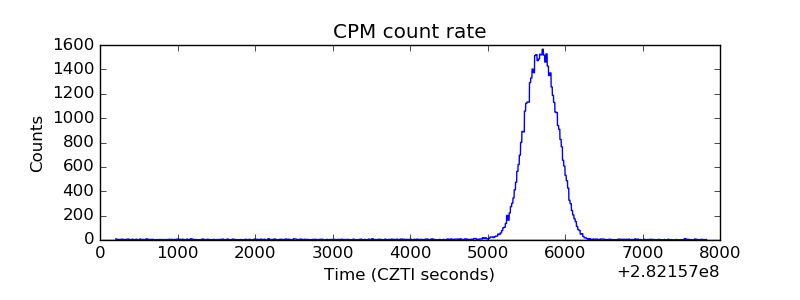 |
| CZT Counter | 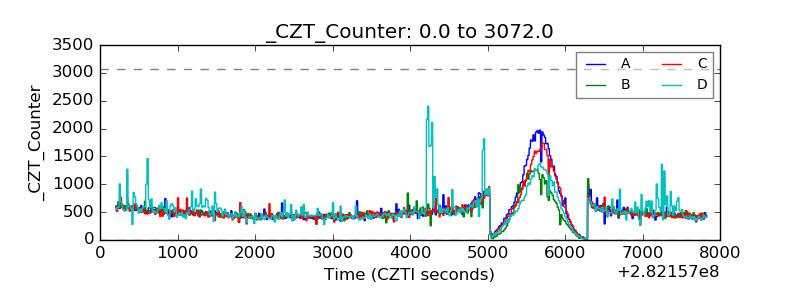 |
| +2.5 Volts monitor |  |
| +5 Volts monitor |  |
| _ROLL_ROT | 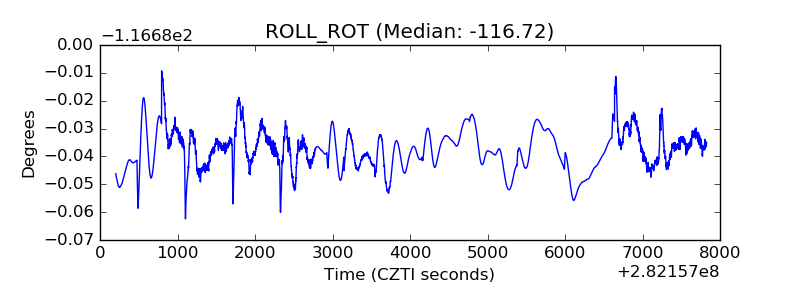 |
| _Roll_DEC | 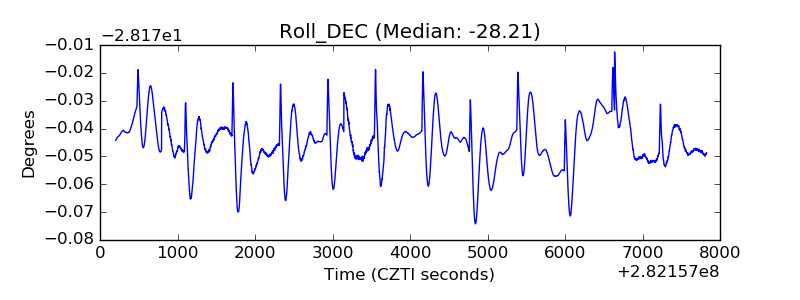 |
| _Roll_RA | 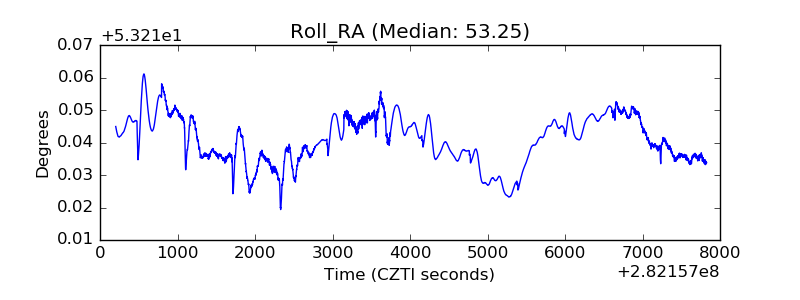 |
| Veto Counter | 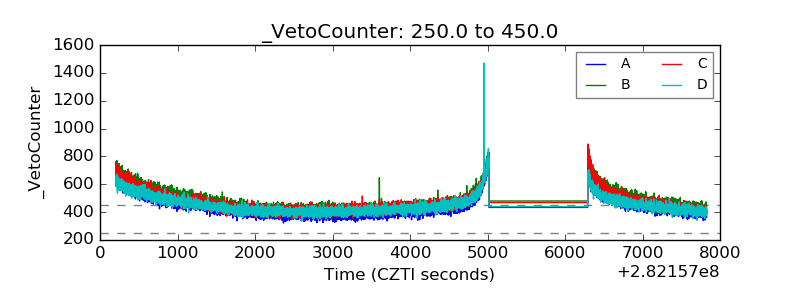 |