| Param | Original file | Final file |
|---|---|---|
| Filename | modeM0/AS1A05_010T02_9000002556_17313cztM0_level2.evt | modeM0/AS1A05_010T02_9000002556_17313cztM0_level2_quad_clean.evt |
| Size (bytes) | 525,271,680 | 93,625,920 |
| Size | 500.9 MB | 89.3 MB |
| Events in quadrant A | 3,142,050 | 619,072 |
| Events in quadrant B | 3,222,511 | 623,253 |
| Events in quadrant C | 3,122,582 | 578,955 |
| Events in quadrant D | 5,968,776 | 549,428 |
| Mode M0 | |||
|---|---|---|---|
| Quadrant | BADHDUFLAG | Total packets | Discarded packets |
| A | 0 | 13834 | 2 |
| B | 0 | 13919 | 2 |
| C | 0 | 13774 | 2 |
| D | 0 | 22394 | 2 |
| Mode M9 | |||
|---|---|---|---|
| Quadrant | BADHDUFLAG | Total packets | Discarded packets |
| A | 0 | 13 | 0 |
| B | 0 | 14 | 0 |
| C | 0 | 14 | 0 |
| D | 0 | 14 | 0 |
| Mode SS | |||
|---|---|---|---|
| Quadrant | BADHDUFLAG | Total packets | Discarded packets |
| A | 0 | 134 | 0 |
| B | 0 | 134 | 0 |
| C | 0 | 134 | 0 |
| D | 0 | 134 | 0 |
| Quadrant | Total seconds | Saturated seconds | Saturation percentage |
|---|---|---|---|
| A | 6666 | 34 | 0.510051% |
| B | 6666 | 41 | 0.615062% |
| C | 6666 | 37 | 0.555056% |
| D | 6666 | 634 | 9.510951% |
Noise dominated data is calculated using 1-second bins in cleaned event files. If a bin has >2000 counts, and if more than 50% of those come from <1% of pixels, then it is considered to be noise-dominated and hence unusable.
| Quadrant | # 1 sec bins | Bins with >0 counts | Bins with >2000 counts | High rate bins dominated by noise | Noise dominated (total time) | Noise dominated (detector-on time) | Marked lightcurve |
|---|---|---|---|---|---|---|---|
| A | 7786 | 6667 | 0 | 0 | 0.00% | 0.00% |  |
| B | 7786 | 6667 | 1 | 1 | 0.01% | 0.01% |  |
| C | 7786 | 6667 | 0 | 0 | 0.00% | 0.00% |  |
| D | 7786 | 6667 | 712 | 712 | 9.14% | 10.68% | 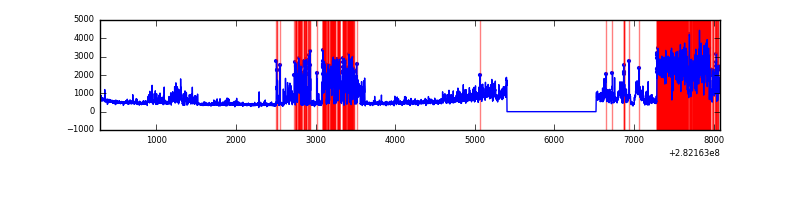 |
Top three noisy pixels from each quadrant. If the there are fewer than three noisy pixels in the level2.evt file, extra rows are filled as -1
| Pixel properties | Quadrant properties | ||||||
|---|---|---|---|---|---|---|---|
| Quadrant | DetID | PixID | Counts | Sigma | Mean | Median | Sigma |
| A | 0 | 226 | 7393 | 40.26 | 816 | 800 | 163.8 |
| A | 3 | 137 | 6178 | 32.84 | 816 | 800 | 163.8 |
| A | 12 | 194 | 5864 | 30.92 | 816 | 800 | 163.8 |
| B | 12 | 111 | 18663 | 114.0 | 816 | 795 | 156.7 |
| B | 0 | 229 | 17649 | 107.53 | 816 | 795 | 156.7 |
| B | 11 | 111 | 15968 | 96.8 | 816 | 795 | 156.7 |
| C | 14 | 238 | 120130 | 662.84 | 769 | 774 | 180.1 |
| C | 13 | 61 | 5265 | 24.94 | 769 | 774 | 180.1 |
| C | 3 | 233 | 4061 | 18.25 | 769 | 774 | 180.1 |
| D | 11 | 176 | 1759762 | 9570.13 | 759 | 738 | 183.8 |
| D | 5 | 222 | 1213074 | 6595.82 | 759 | 738 | 183.8 |
| D | 1 | 52 | 79257 | 427.19 | 759 | 738 | 183.8 |
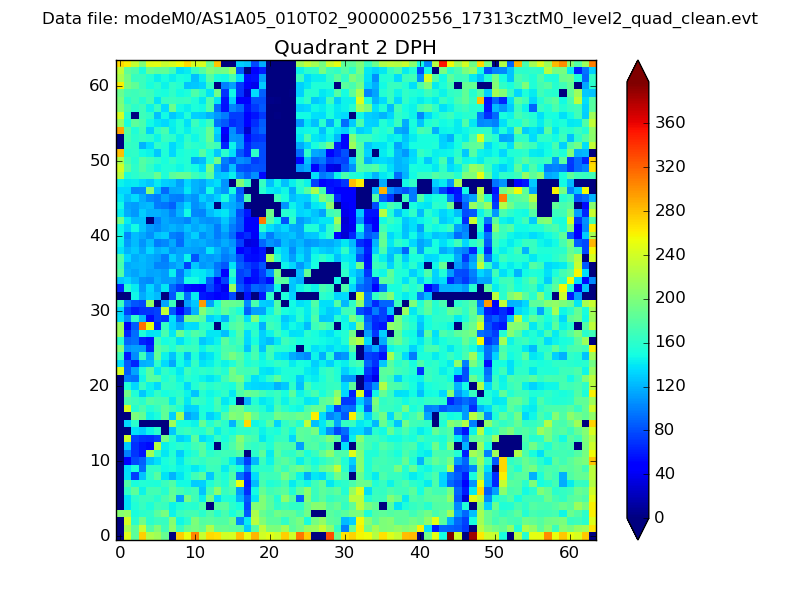
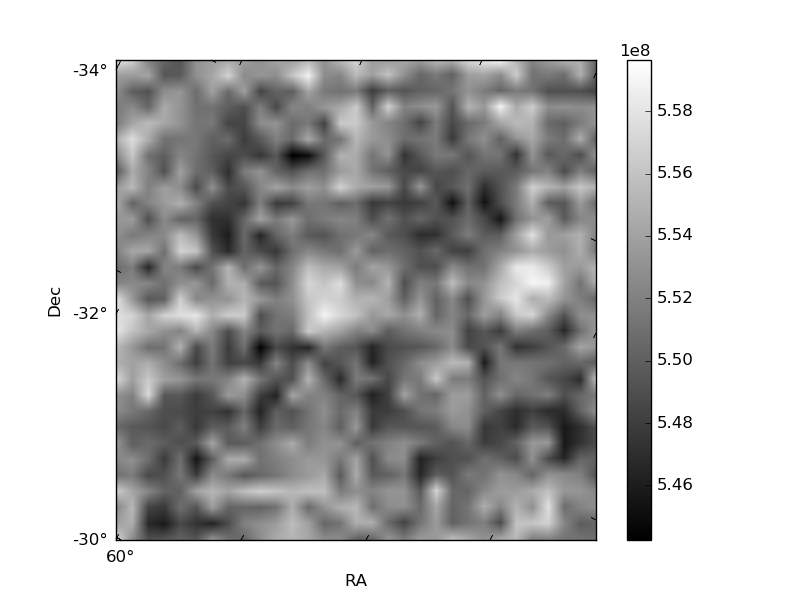
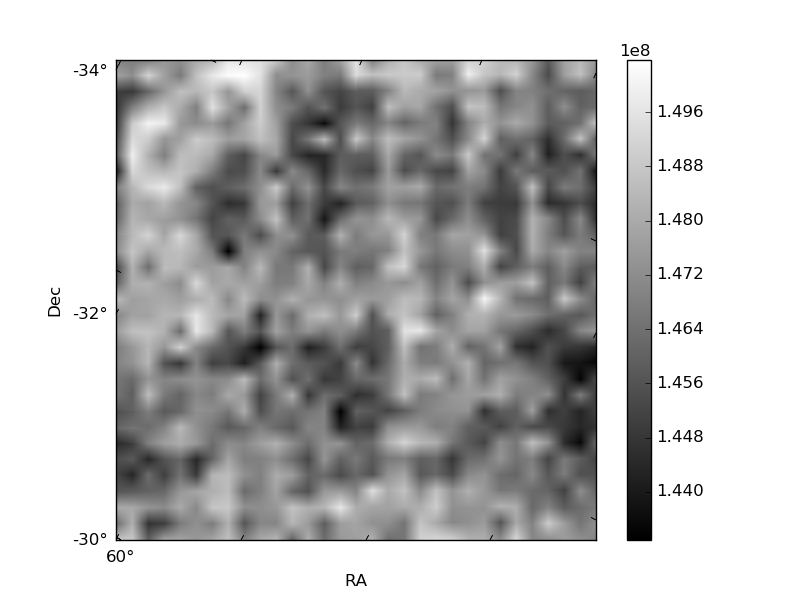
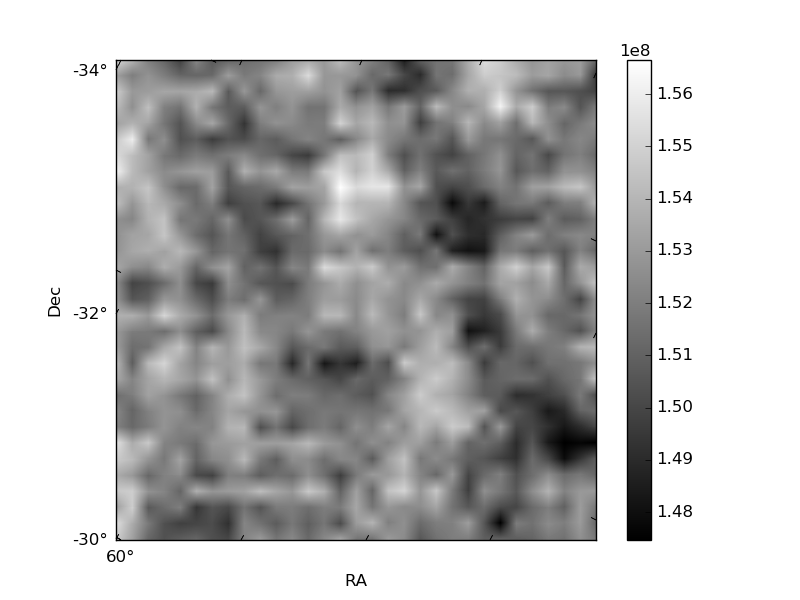
Histogram calculated using DETX and DETY for each event in the final _common_clean file
| Quadrant A | 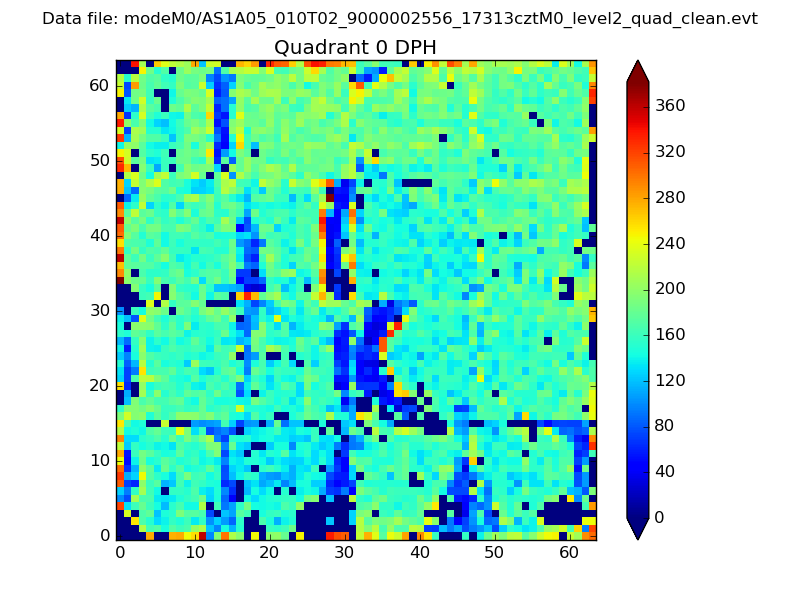 |
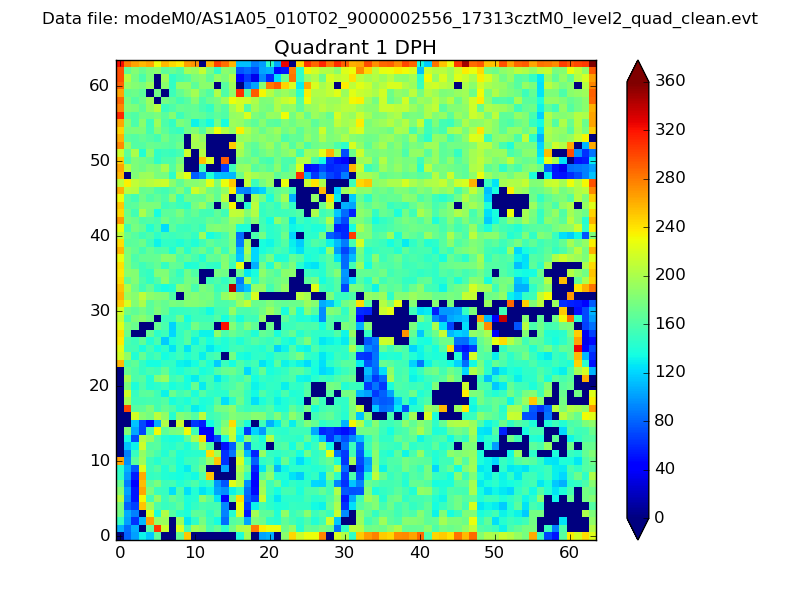 |
Quadrant B |
|---|---|---|---|
| Quadrant D | 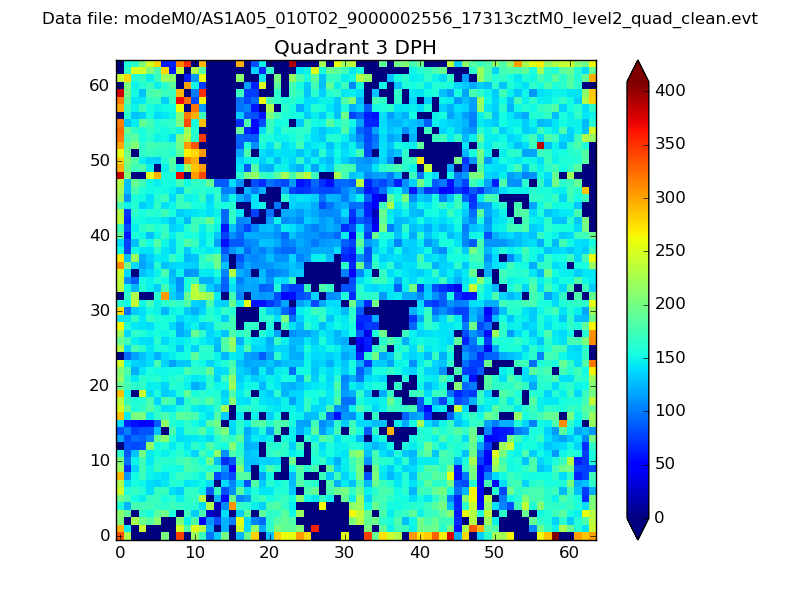 |
 |
Quadrant C |
| Plot type | Count rate plots | Images |
|---|---|---|
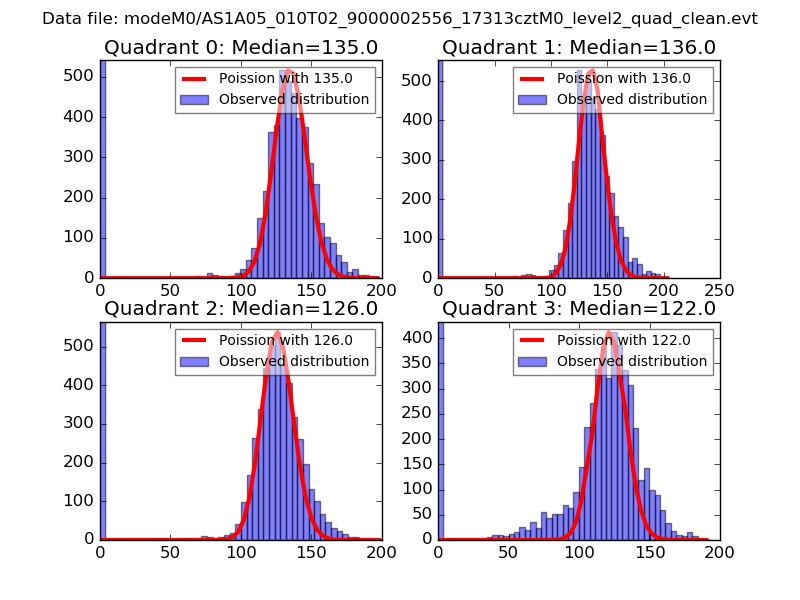
| Comparison with Poisson distribution Blue bars denote a histogram of data divided into 1 sec bins. Red curve is a Poisson curve with rate = median count rate of data. |
 |
 |
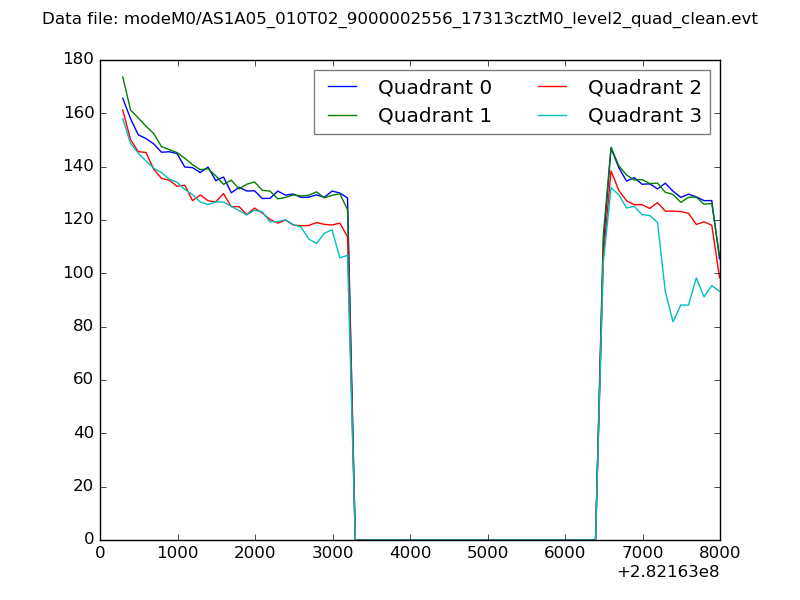
| Quadrant-wise count rates Data is divided into 100 sec bins |
 |
|
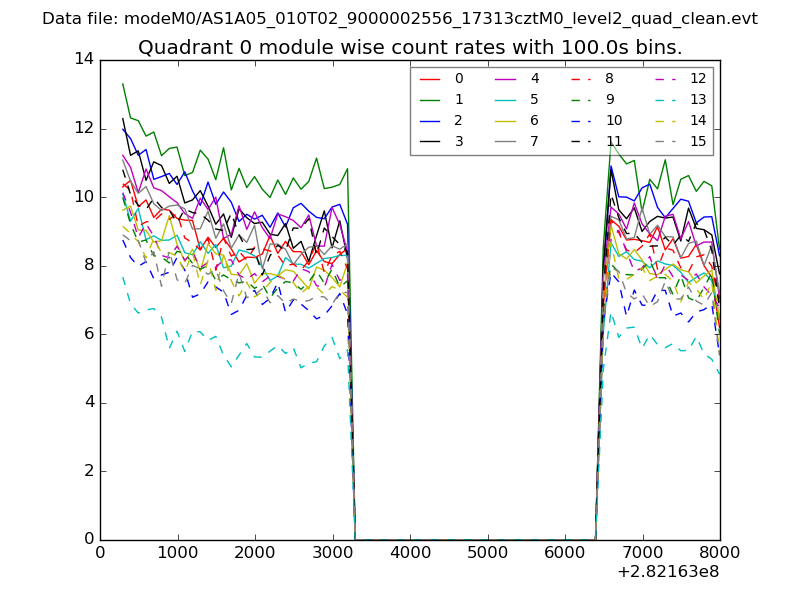
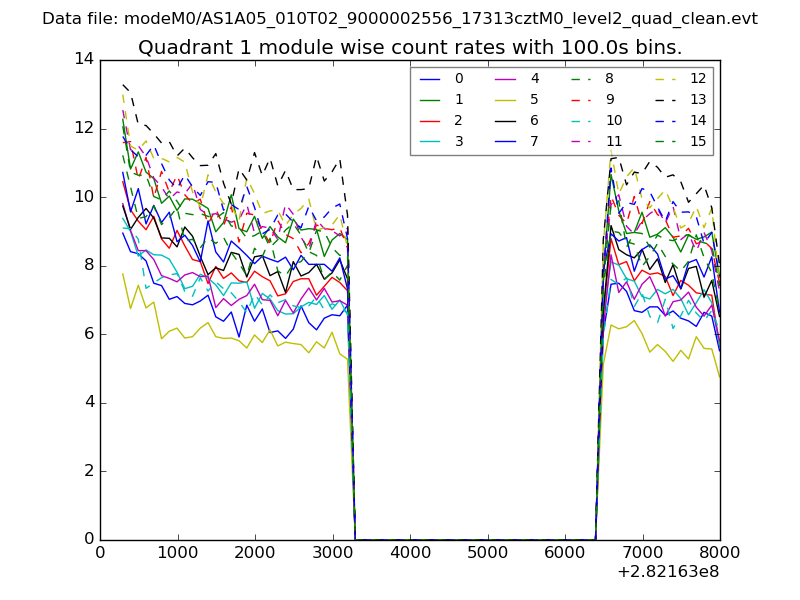
| Module-wise count rates for Quadrant A Data is divided into 100 sec bins |
 |
 |
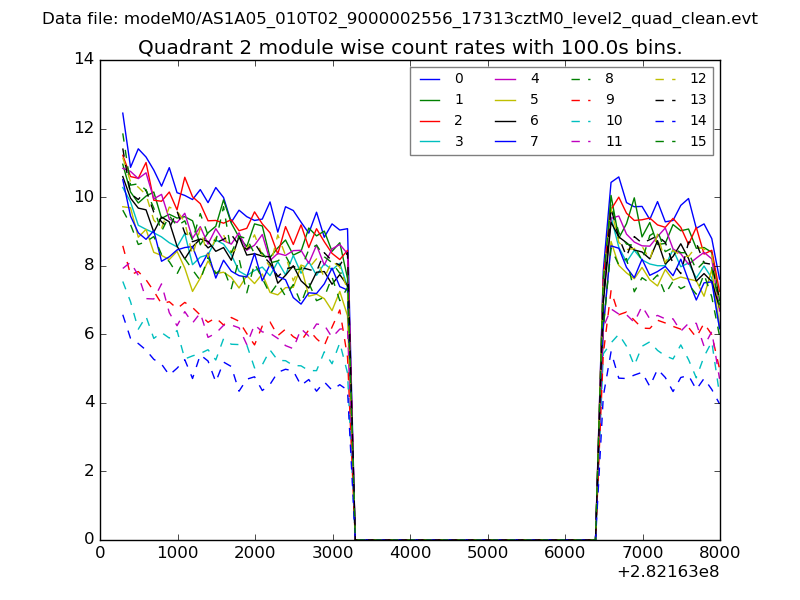
| Module-wise count rates for Quadrant B Data is divided into 100 sec bins |
 |
 |
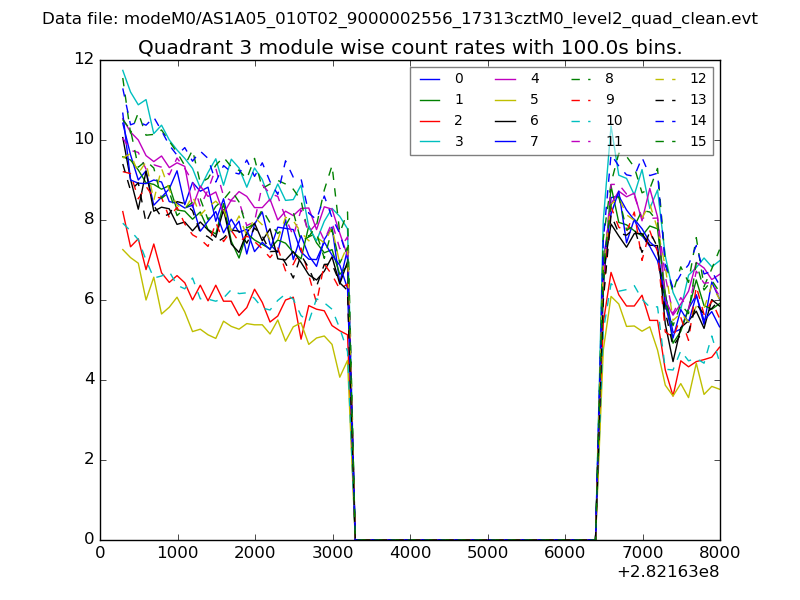
| Module-wise count rates for Quadrant C Data is divided into 100 sec bins |
 |
 |
| Module-wise count rates for Quadrant D Data is divided into 100 sec bins |
 |
 |
| Parameter | Plot |
|---|---|
| CZT HV Monitor | 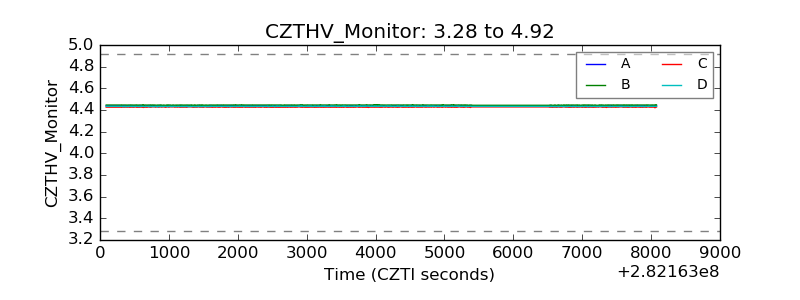 |
| D_VDD | 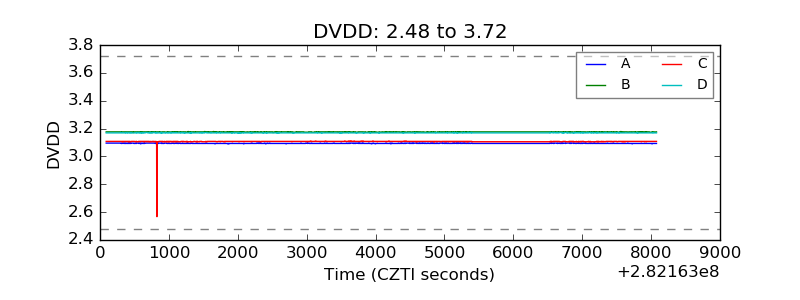 |
| Temperature 1 | 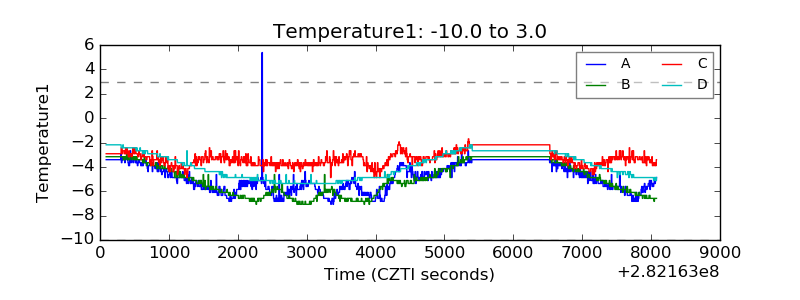 |
| Veto HV Monitor |  |
| Veto LLD | 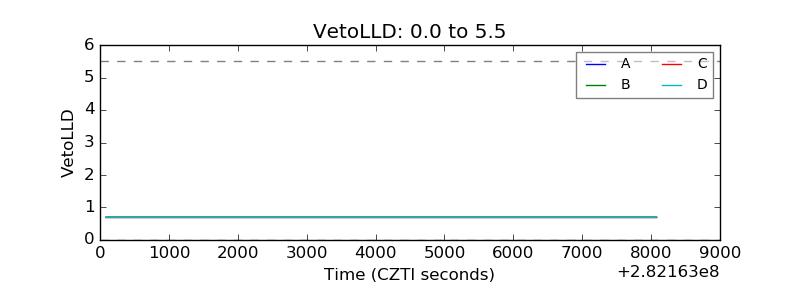 |
| Alpha Counter | 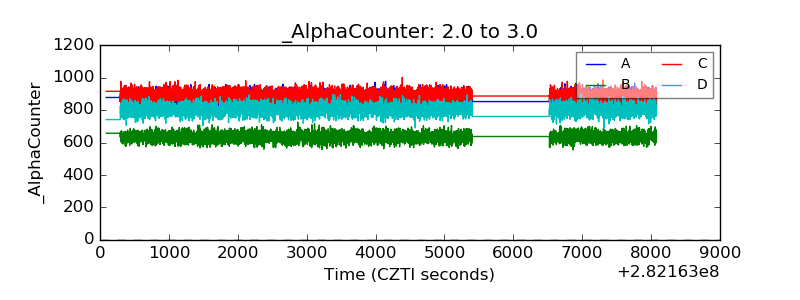 |
| _CPM_Rate | 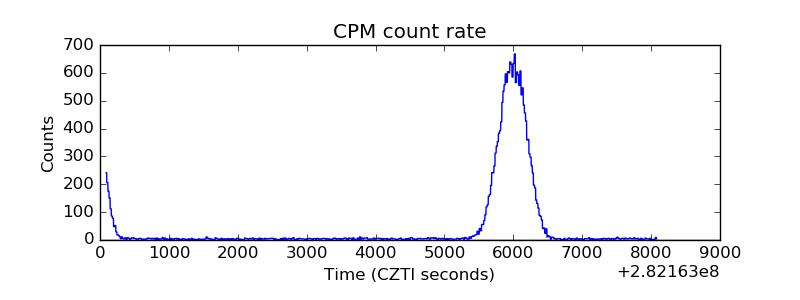 |
| CZT Counter | 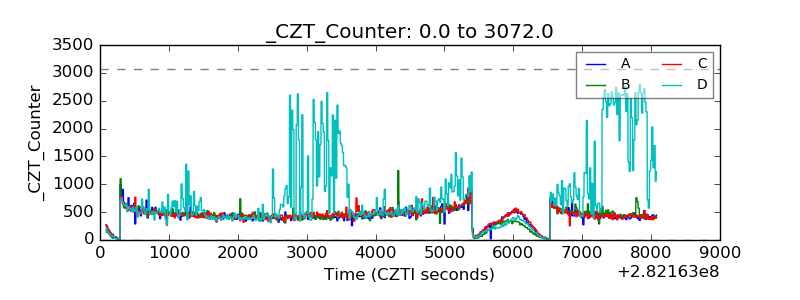 |
| +2.5 Volts monitor |  |
| +5 Volts monitor |  |
| _ROLL_ROT | 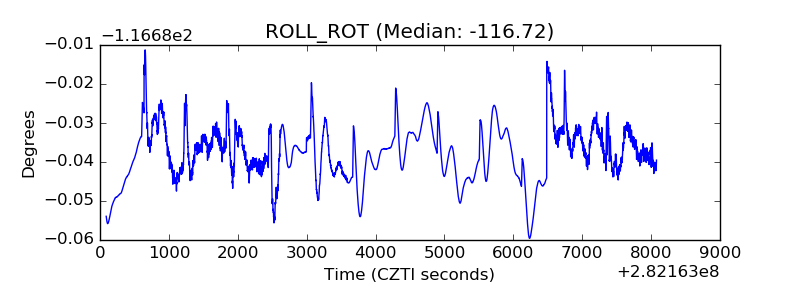 |
| _Roll_DEC | 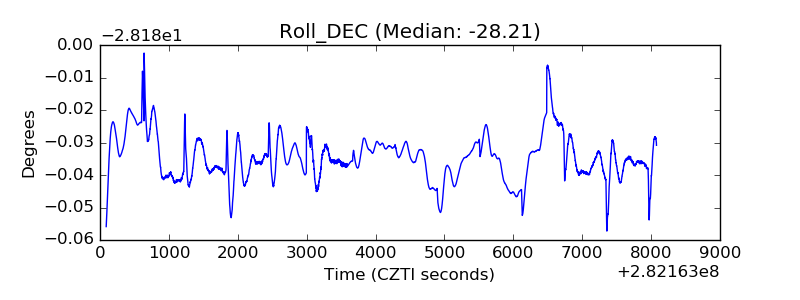 |
| _Roll_RA | 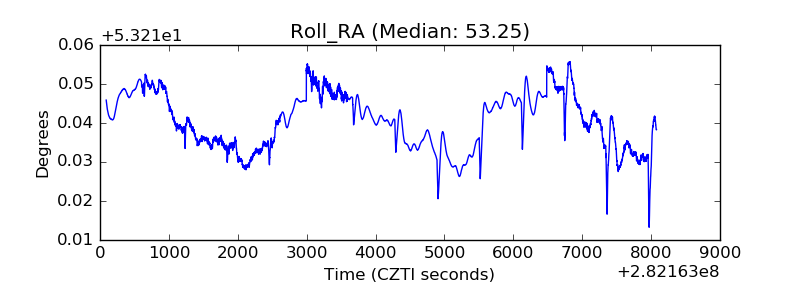 |
| Veto Counter | 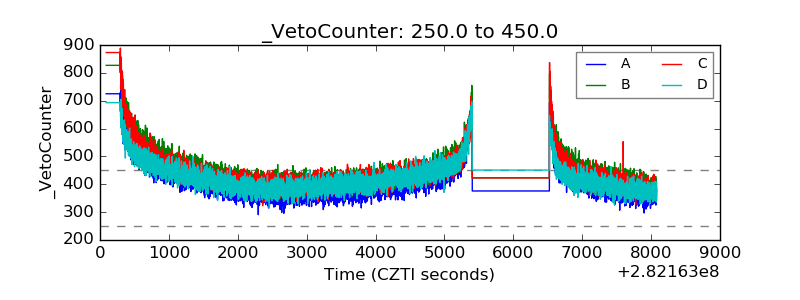 |