| Param | Original file | Final file |
|---|---|---|
| Filename | modeM0/AS1A05_010T02_9000002556_17315cztM0_level2.evt | modeM0/AS1A05_010T02_9000002556_17315cztM0_level2_quad_clean.evt |
| Size (bytes) | 517,786,560 | 111,551,040 |
| Size | 493.8 MB | 106.4 MB |
| Events in quadrant A | 3,600,723 | 726,702 |
| Events in quadrant B | 3,687,838 | 731,941 |
| Events in quadrant C | 3,629,374 | 689,157 |
| Events in quadrant D | 4,229,509 | 684,236 |
| Mode M0 | |||
|---|---|---|---|
| Quadrant | BADHDUFLAG | Total packets | Discarded packets |
| A | 0 | 16110 | 2 |
| B | 0 | 16174 | 3 |
| C | 0 | 16068 | 2 |
| D | 0 | 17909 | 2 |
| Mode M9 | |||
|---|---|---|---|
| Quadrant | BADHDUFLAG | Total packets | Discarded packets |
| A | 0 | 12 | 0 |
| B | 0 | 12 | 0 |
| C | 0 | 12 | 0 |
| D | 0 | 12 | 0 |
| Mode SS | |||
|---|---|---|---|
| Quadrant | BADHDUFLAG | Total packets | Discarded packets |
| A | 0 | 160 | 0 |
| B | 0 | 160 | 0 |
| C | 0 | 160 | 0 |
| D | 0 | 160 | 0 |
| Quadrant | Total seconds | Saturated seconds | Saturation percentage |
|---|---|---|---|
| A | 7857 | 28 | 0.356370% |
| B | 7857 | 50 | 0.636375% |
| C | 7857 | 68 | 0.865470% |
| D | 7857 | 52 | 0.661830% |
Noise dominated data is calculated using 1-second bins in cleaned event files. If a bin has >2000 counts, and if more than 50% of those come from <1% of pixels, then it is considered to be noise-dominated and hence unusable.
| Quadrant | # 1 sec bins | Bins with >0 counts | Bins with >2000 counts | High rate bins dominated by noise | Noise dominated (total time) | Noise dominated (detector-on time) | Marked lightcurve |
|---|---|---|---|---|---|---|---|
| A | 9062 | 7859 | 0 | 0 | 0.00% | 0.00% | 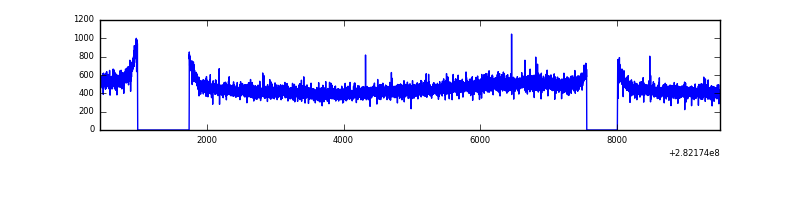 |
| B | 9062 | 7859 | 0 | 0 | 0.00% | 0.00% | 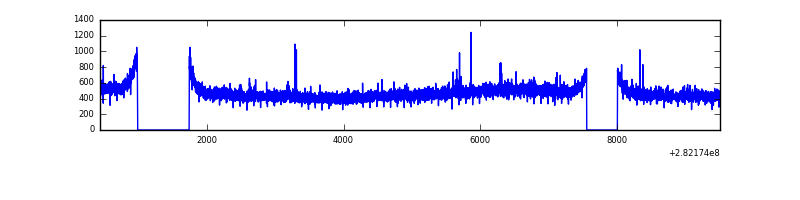 |
| C | 9062 | 7859 | 0 | 0 | 0.00% | 0.00% | 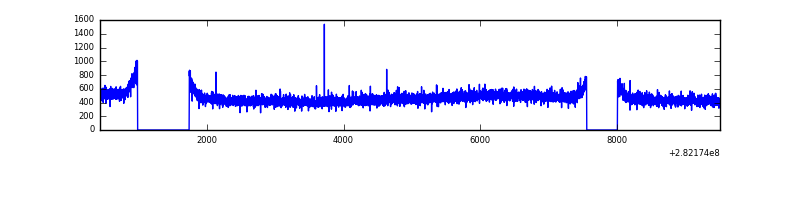 |
| D | 9062 | 7859 | 37 | 37 | 0.41% | 0.47% | 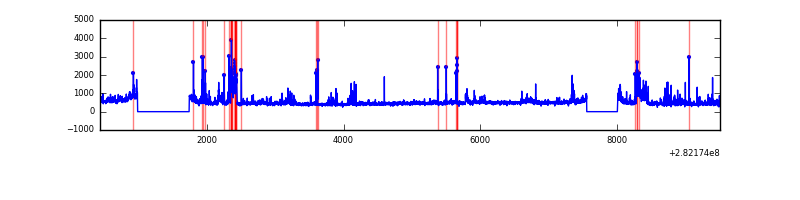 |
Top three noisy pixels from each quadrant. If the there are fewer than three noisy pixels in the level2.evt file, extra rows are filled as -1
| Pixel properties | Quadrant properties | ||||||
|---|---|---|---|---|---|---|---|
| Quadrant | DetID | PixID | Counts | Sigma | Mean | Median | Sigma |
| A | 0 | 226 | 8028 | 37.37 | 937 | 917 | 190.3 |
| A | 3 | 137 | 7248 | 33.27 | 937 | 917 | 190.3 |
| A | 12 | 194 | 6661 | 30.18 | 937 | 917 | 190.3 |
| B | 12 | 111 | 22190 | 118.42 | 935 | 911 | 179.7 |
| B | 11 | 111 | 19336 | 102.54 | 935 | 911 | 179.7 |
| B | 14 | 111 | 16748 | 88.14 | 935 | 911 | 179.7 |
| C | 14 | 238 | 135762 | 640.73 | 890 | 894 | 210.5 |
| C | 8 | 128 | 8718 | 37.17 | 890 | 894 | 210.5 |
| C | 13 | 61 | 6366 | 26.0 | 890 | 894 | 210.5 |
| D | 5 | 222 | 412328 | 1874.19 | 899 | 870 | 219.5 |
| D | 11 | 176 | 211359 | 958.78 | 899 | 870 | 219.5 |
| D | 1 | 52 | 103254 | 466.36 | 899 | 870 | 219.5 |
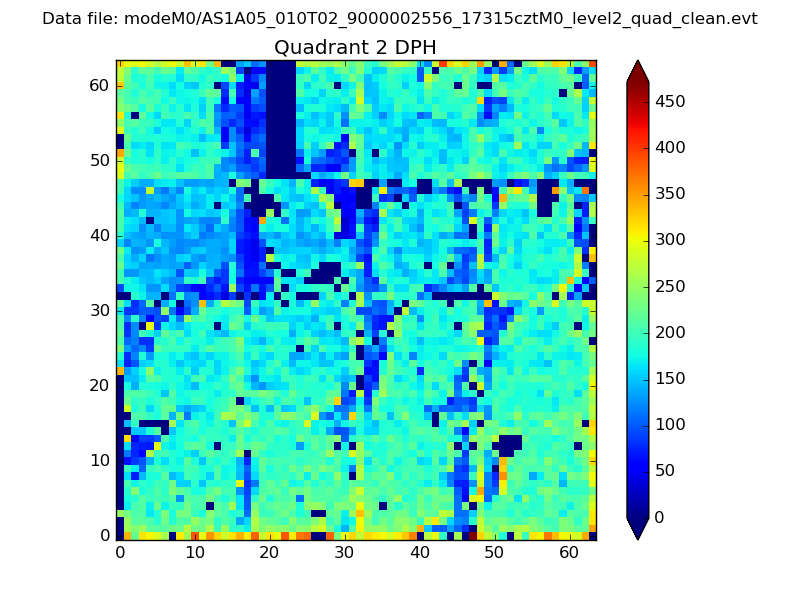
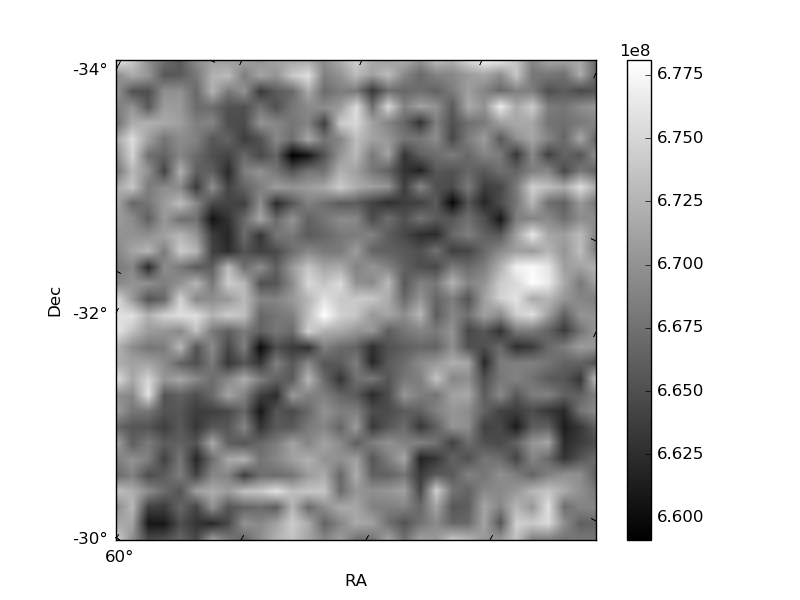
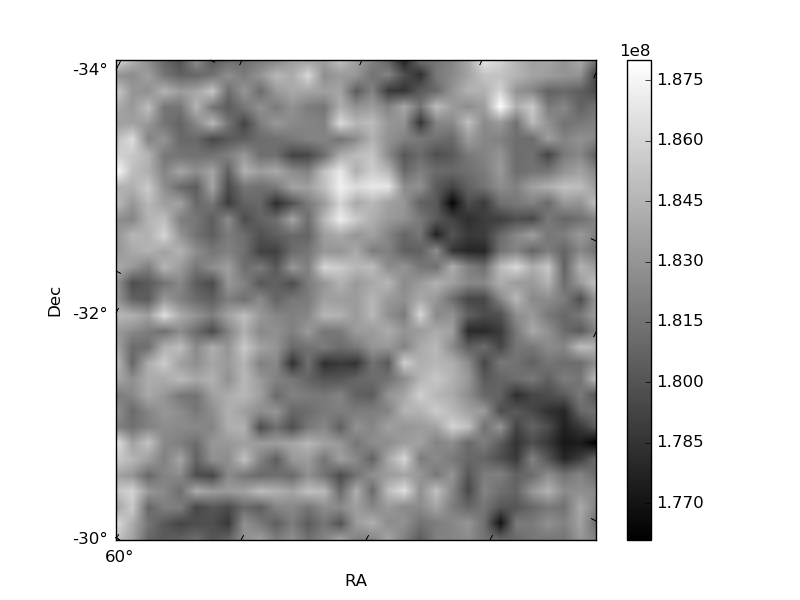
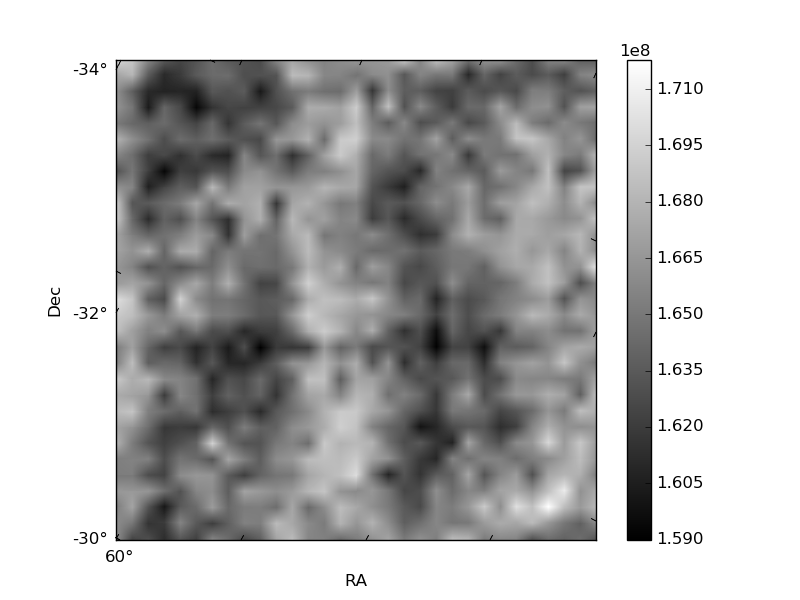
Histogram calculated using DETX and DETY for each event in the final _common_clean file
| Quadrant A | 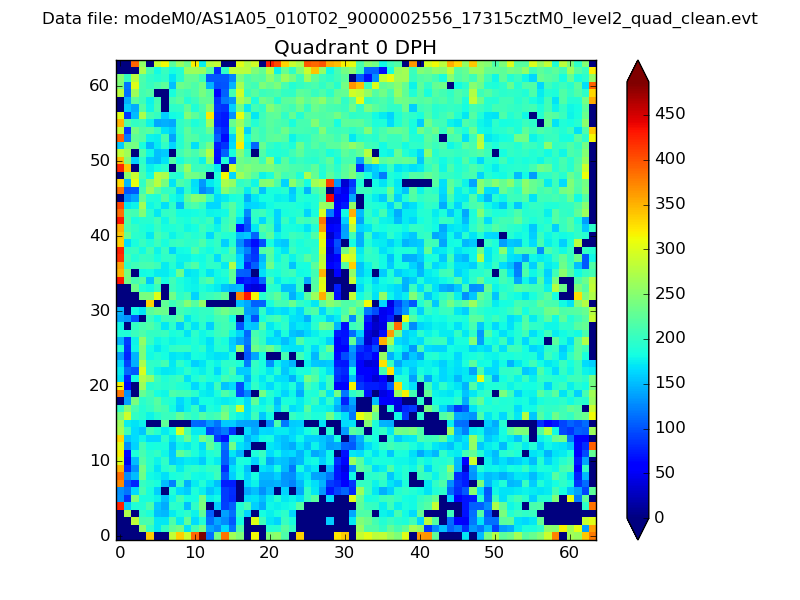 |
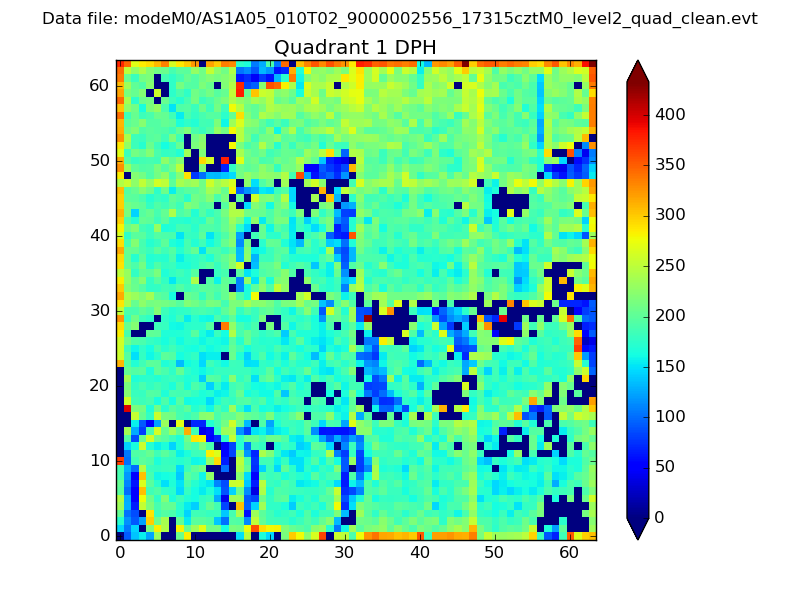 |
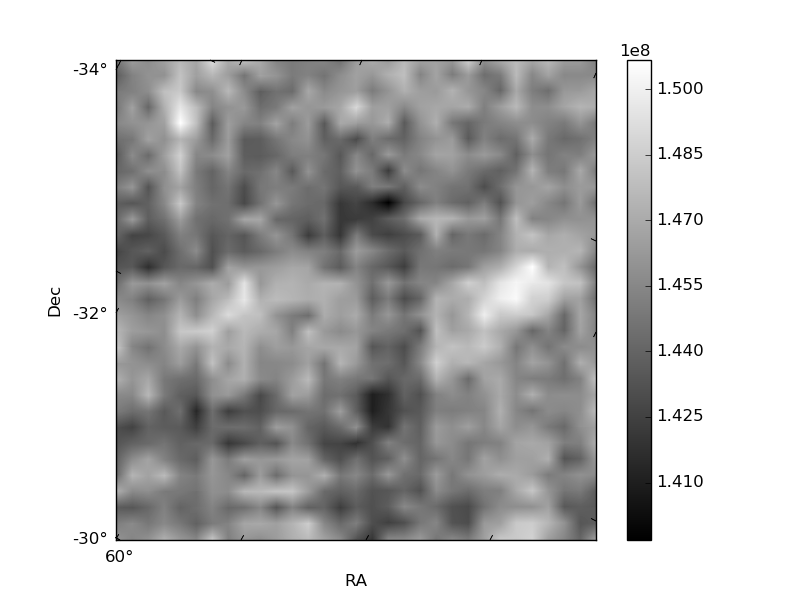
Quadrant B |
|---|---|---|---|
| Quadrant D | 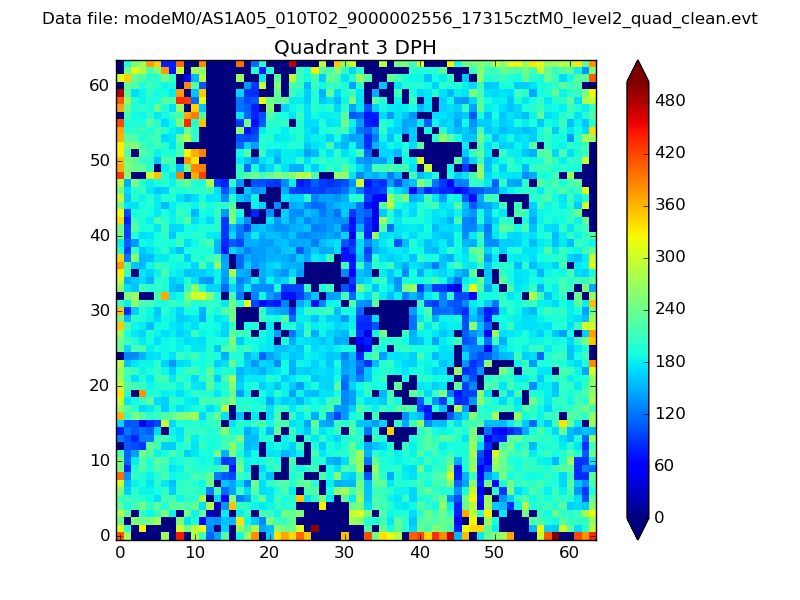 |
 |
Quadrant C |
| Plot type | Count rate plots | Images |
|---|---|---|
| Comparison with Poisson distribution Blue bars denote a histogram of data divided into 1 sec bins. Red curve is a Poisson curve with rate = median count rate of data. |
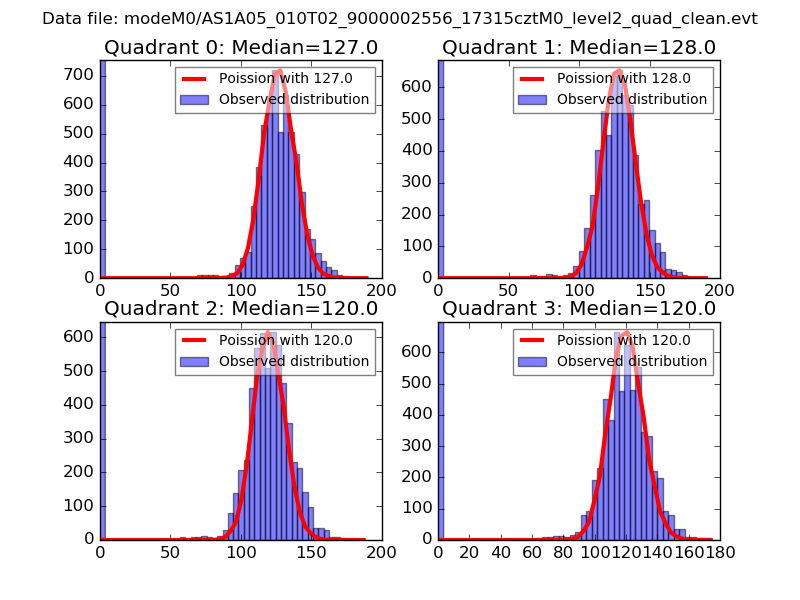 |
 |
| Quadrant-wise count rates Data is divided into 100 sec bins |
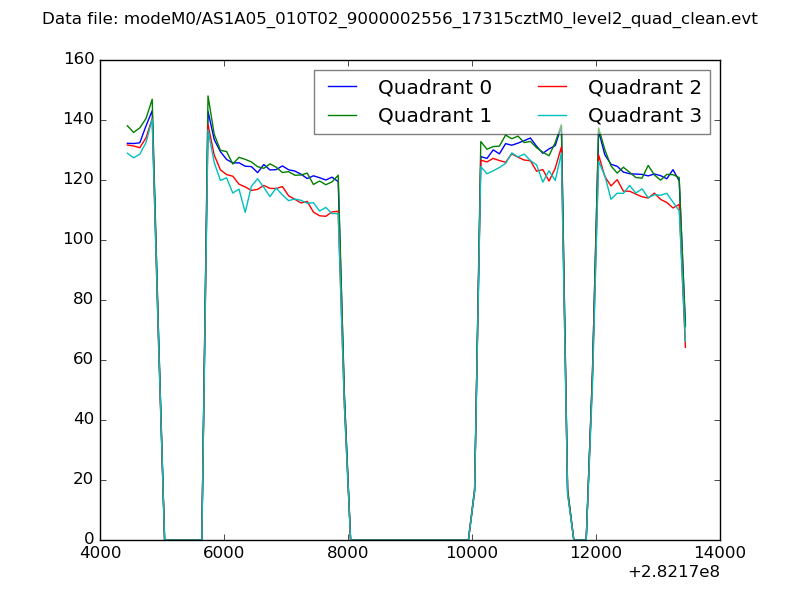 |
|
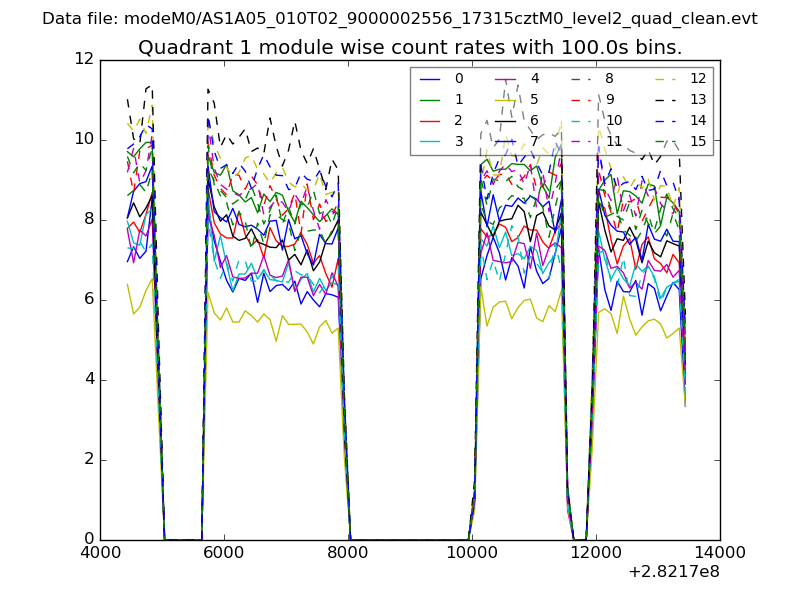
| Module-wise count rates for Quadrant A Data is divided into 100 sec bins |
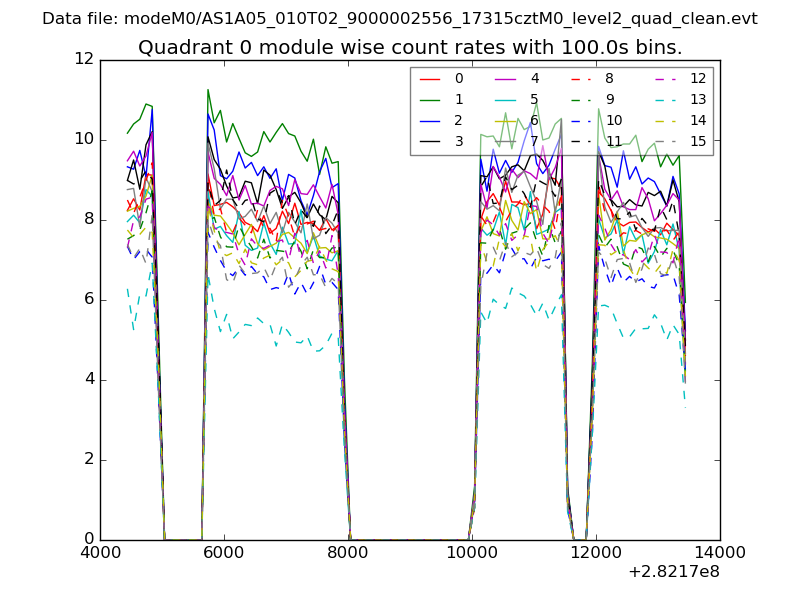 |
 |
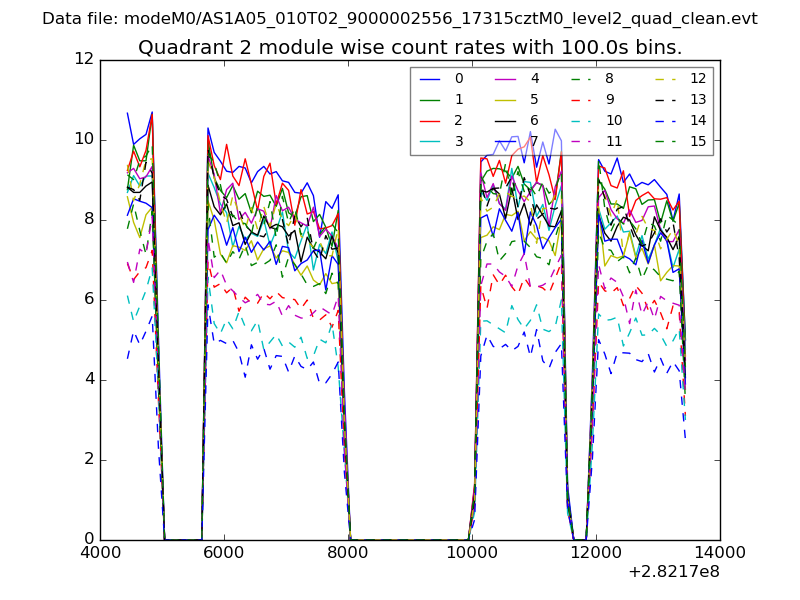
| Module-wise count rates for Quadrant B Data is divided into 100 sec bins |
 |
 |
| Module-wise count rates for Quadrant C Data is divided into 100 sec bins |
 |
 |
| Module-wise count rates for Quadrant D Data is divided into 100 sec bins |
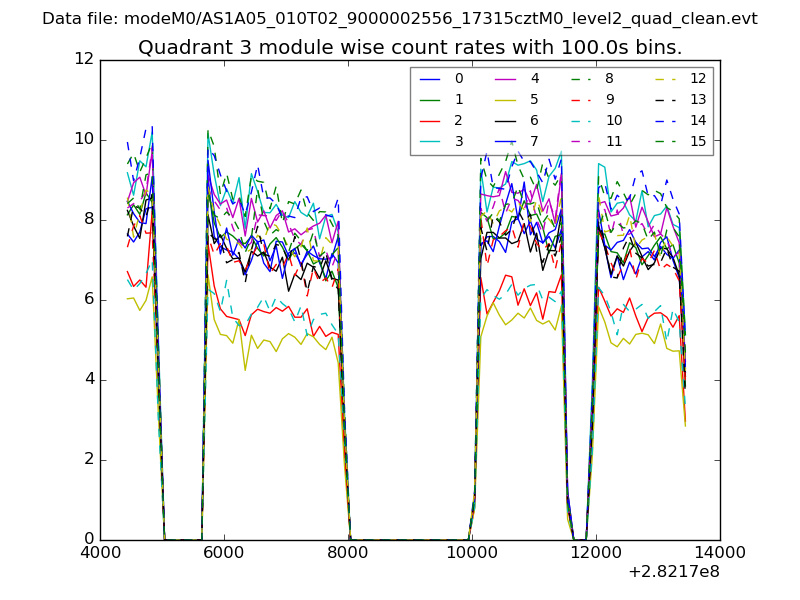 |
 |
| Parameter | Plot |
|---|---|
| CZT HV Monitor | 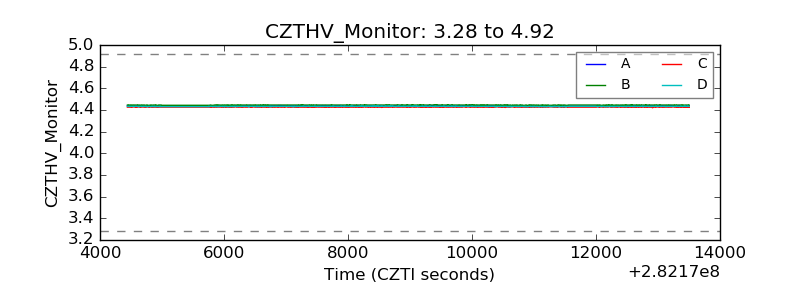 |
| D_VDD | 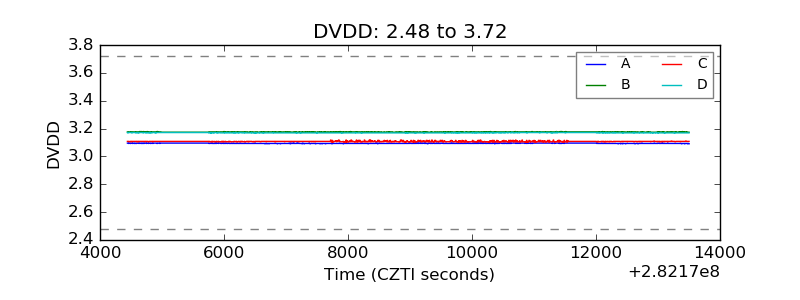 |
| Temperature 1 |  |
| Veto HV Monitor | 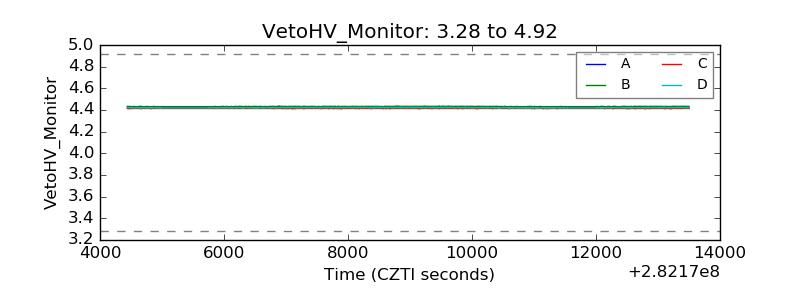 |
| Veto LLD | 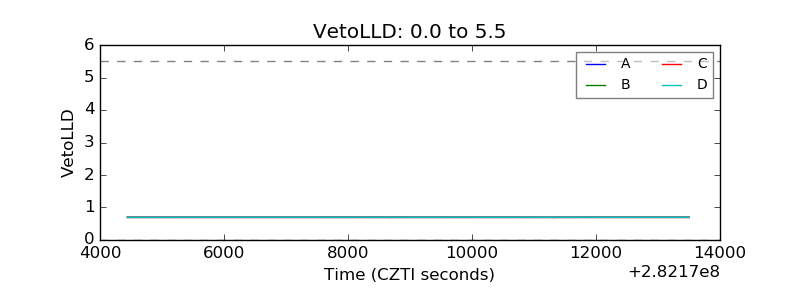 |
| Alpha Counter | 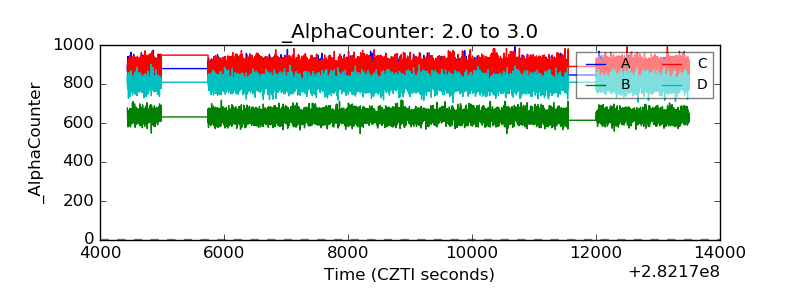 |
| _CPM_Rate | 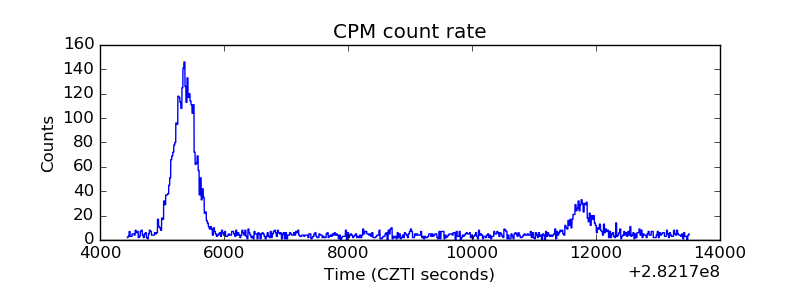 |
| CZT Counter | 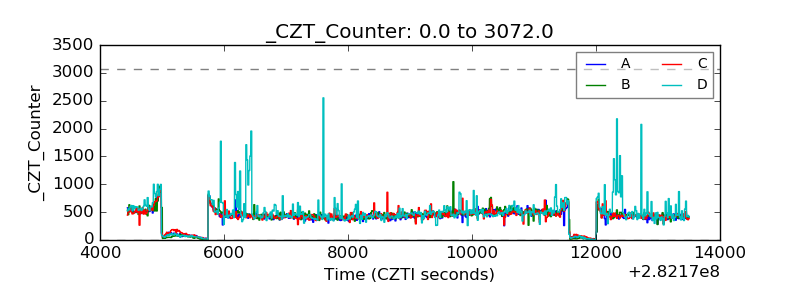 |
| +2.5 Volts monitor |  |
| +5 Volts monitor |  |
| _ROLL_ROT | 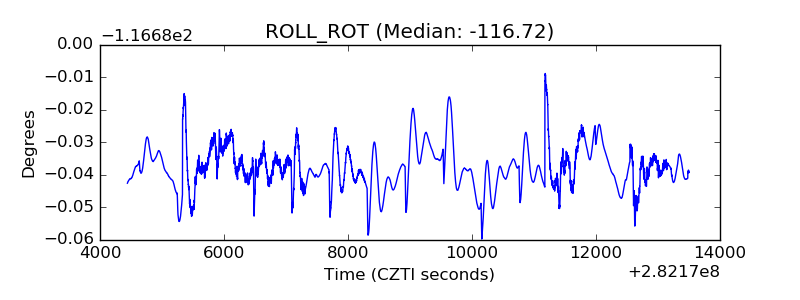 |
| _Roll_DEC | 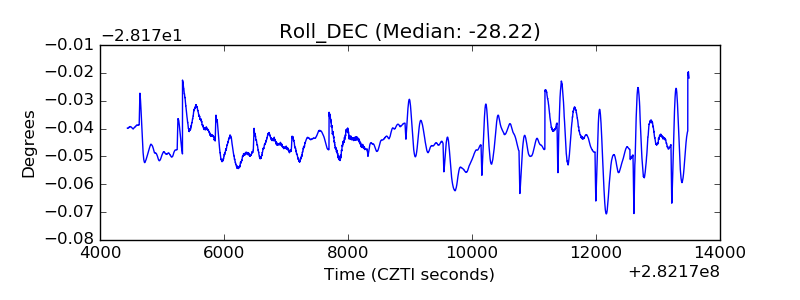 |
| _Roll_RA | 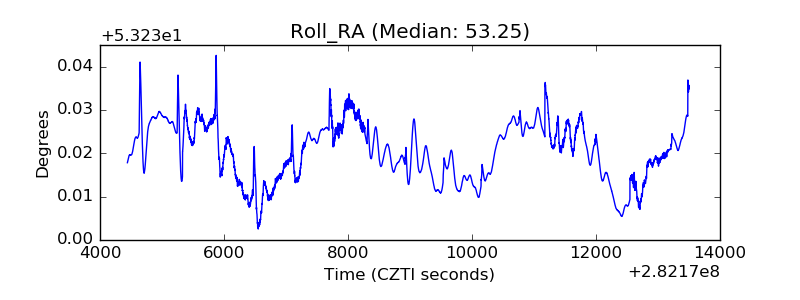 |
| Veto Counter | 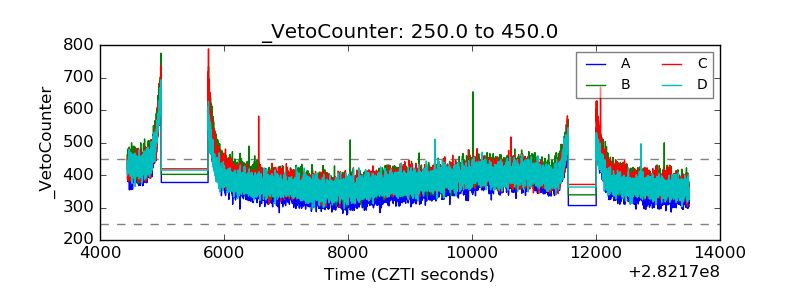 |