| Param | Original file | Final file |
|---|---|---|
| Filename | modeM0/AS1A05_010T02_9000002556_17316cztM0_level2.evt | modeM0/AS1A05_010T02_9000002556_17316cztM0_level2_quad_clean.evt |
| Size (bytes) | 522,875,520 | 110,540,160 |
| Size | 498.7 MB | 105.4 MB |
| Events in quadrant A | 3,804,594 | 717,346 |
| Events in quadrant B | 3,711,247 | 720,757 |
| Events in quadrant C | 3,665,243 | 678,393 |
| Events in quadrant D | 4,110,509 | 674,922 |
| Mode M0 | |||
|---|---|---|---|
| Quadrant | BADHDUFLAG | Total packets | Discarded packets |
| A | 0 | 16715 | 2 |
| B | 0 | 16426 | 2 |
| C | 0 | 16378 | 2 |
| D | 0 | 17847 | 2 |
| Mode M9 | |||
|---|---|---|---|
| Quadrant | BADHDUFLAG | Total packets | Discarded packets |
| A | 0 | 7 | 0 |
| B | 0 | 7 | 0 |
| C | 0 | 7 | 0 |
| D | 0 | 7 | 0 |
| Mode SS | |||
|---|---|---|---|
| Quadrant | BADHDUFLAG | Total packets | Discarded packets |
| A | 0 | 164 | 0 |
| B | 0 | 164 | 0 |
| C | 0 | 164 | 0 |
| D | 0 | 164 | 0 |
| Quadrant | Total seconds | Saturated seconds | Saturation percentage |
|---|---|---|---|
| A | 8005 | 66 | 0.824485% |
| B | 8005 | 111 | 1.386633% |
| C | 8005 | 119 | 1.486571% |
| D | 8005 | 93 | 1.161774% |
Noise dominated data is calculated using 1-second bins in cleaned event files. If a bin has >2000 counts, and if more than 50% of those come from <1% of pixels, then it is considered to be noise-dominated and hence unusable.
| Quadrant | # 1 sec bins | Bins with >0 counts | Bins with >2000 counts | High rate bins dominated by noise | Noise dominated (total time) | Noise dominated (detector-on time) | Marked lightcurve |
|---|---|---|---|---|---|---|---|
| A | 8690 | 8008 | 0 | 0 | 0.00% | 0.00% | 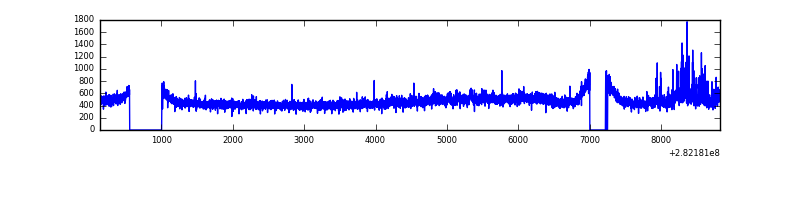 |
| B | 8690 | 8008 | 0 | 0 | 0.00% | 0.00% | 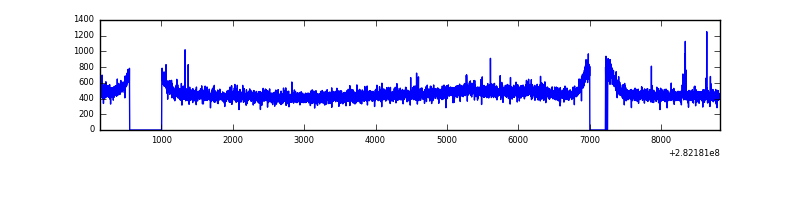 |
| C | 8690 | 8008 | 0 | 0 | 0.00% | 0.00% | 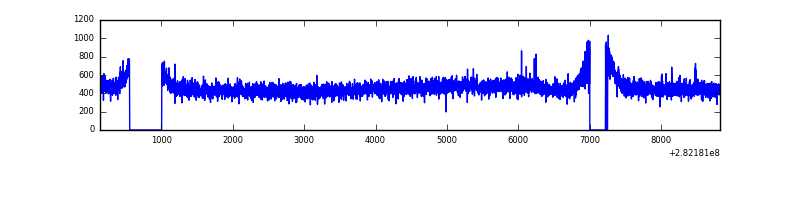 |
| D | 8690 | 8008 | 26 | 26 | 0.30% | 0.32% | 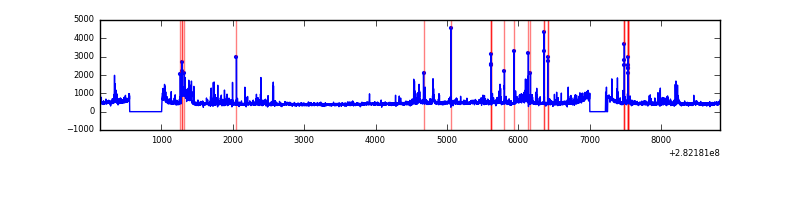 |
Top three noisy pixels from each quadrant. If the there are fewer than three noisy pixels in the level2.evt file, extra rows are filled as -1
| Pixel properties | Quadrant properties | ||||||
|---|---|---|---|---|---|---|---|
| Quadrant | DetID | PixID | Counts | Sigma | Mean | Median | Sigma |
| A | 13 | 210 | 183144 | 956.76 | 941 | 919 | 190.5 |
| A | 0 | 226 | 8342 | 38.97 | 941 | 919 | 190.5 |
| A | 3 | 137 | 7332 | 33.67 | 941 | 919 | 190.5 |
| B | 12 | 111 | 22342 | 117.36 | 944 | 915 | 182.6 |
| B | 11 | 111 | 19606 | 102.37 | 944 | 915 | 182.6 |
| B | 14 | 111 | 17055 | 88.4 | 944 | 915 | 182.6 |
| C | 14 | 238 | 137666 | 642.27 | 901 | 905 | 212.9 |
| C | 3 | 233 | 6486 | 26.21 | 901 | 905 | 212.9 |
| C | 13 | 61 | 6418 | 25.89 | 901 | 905 | 212.9 |
| D | 5 | 222 | 366347 | 1639.37 | 911 | 884 | 222.9 |
| D | 1 | 52 | 222192 | 992.73 | 911 | 884 | 222.9 |
| D | 2 | 152 | 48973 | 215.71 | 911 | 884 | 222.9 |
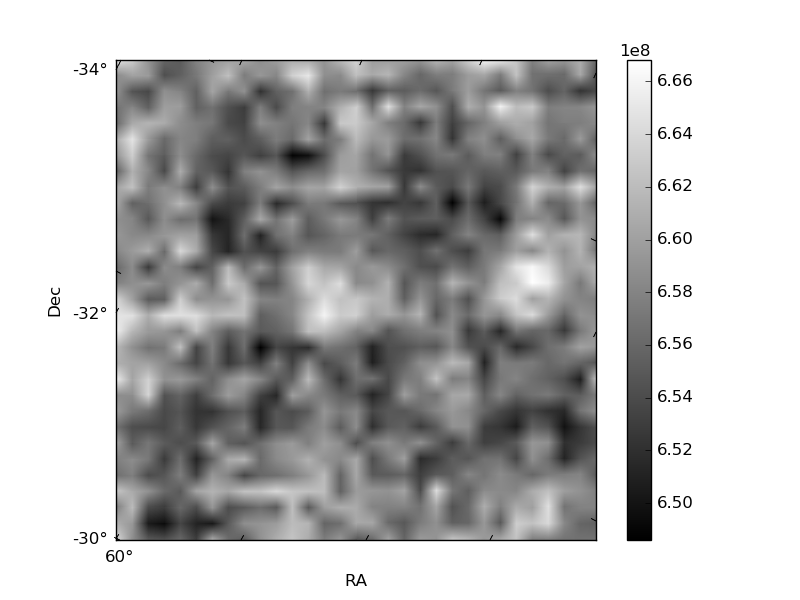
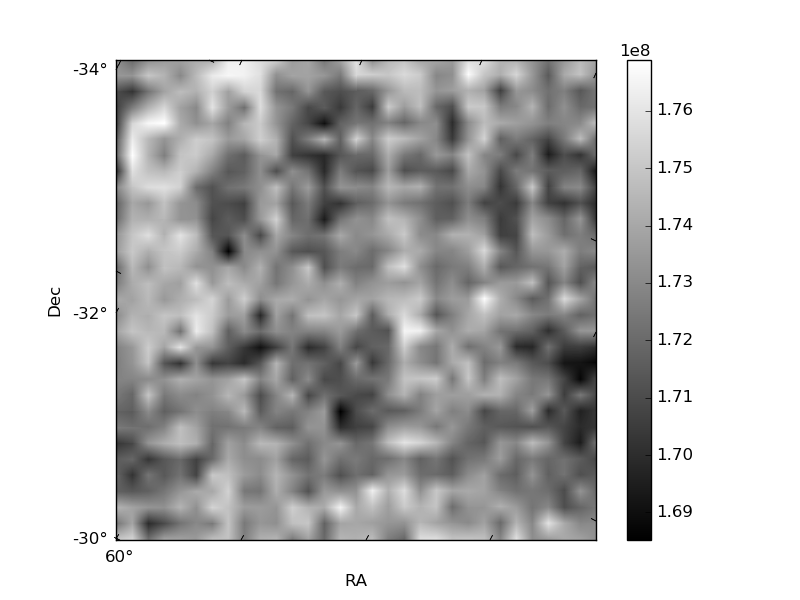
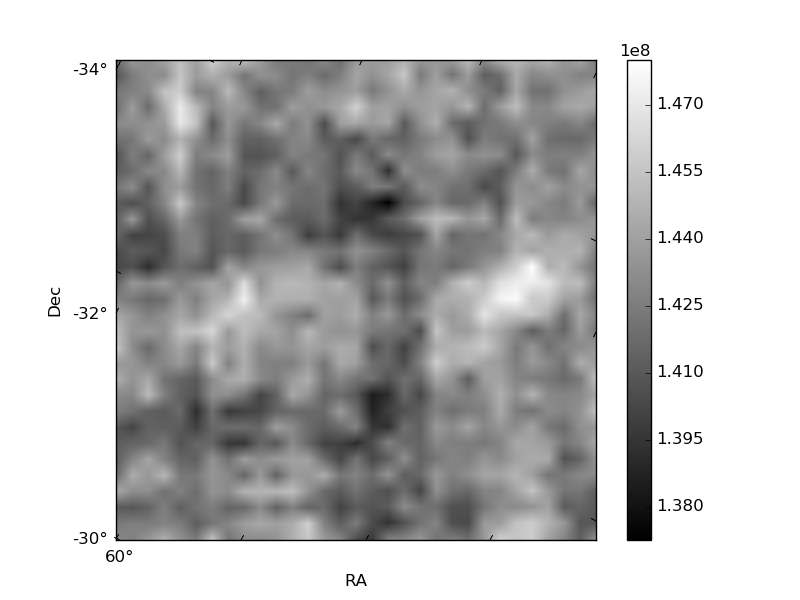
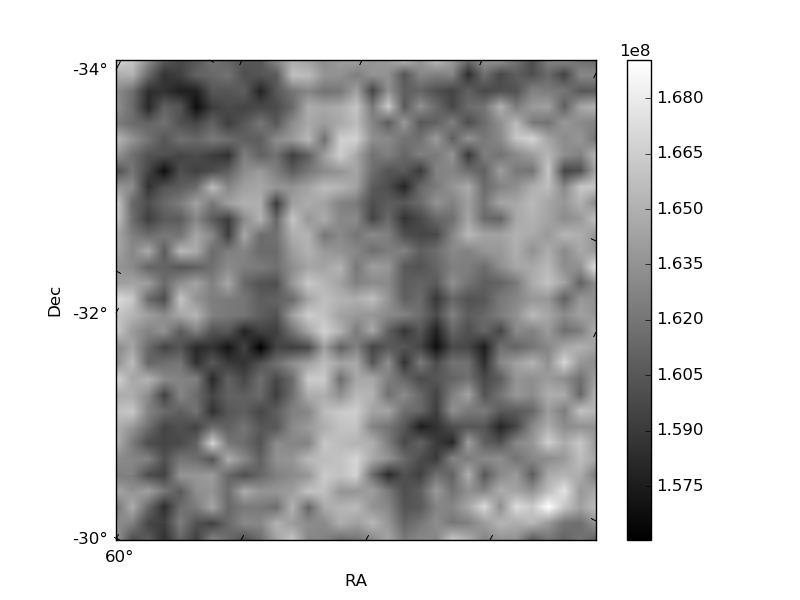
Histogram calculated using DETX and DETY for each event in the final _common_clean file
| Quadrant A | 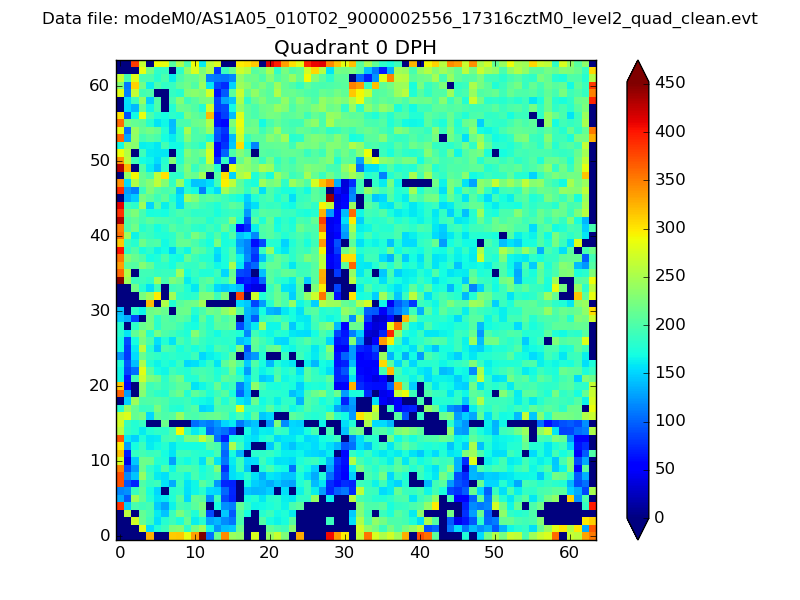 |
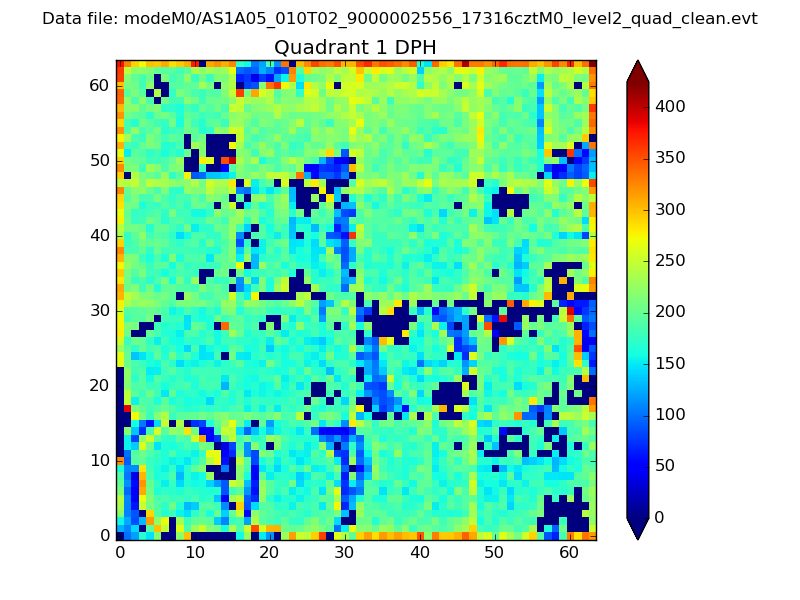 |
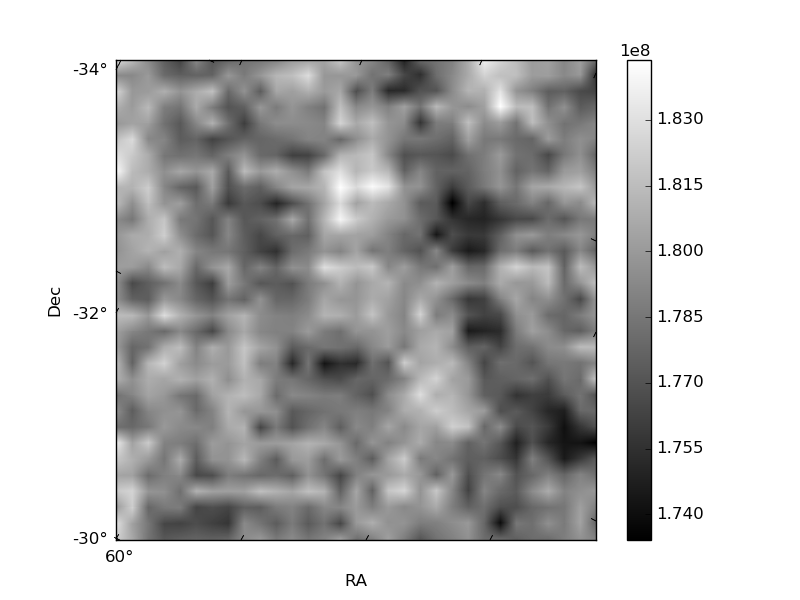
Quadrant B |
|---|---|---|---|
| Quadrant D | 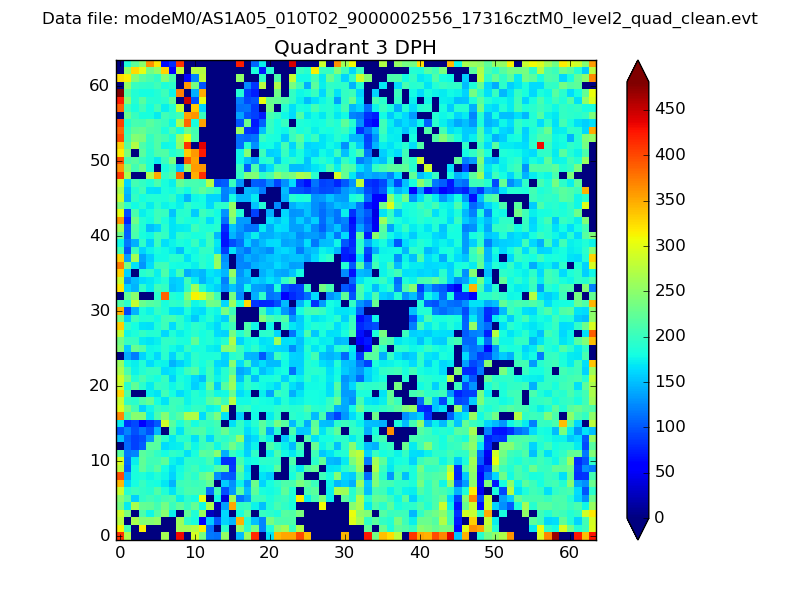 |
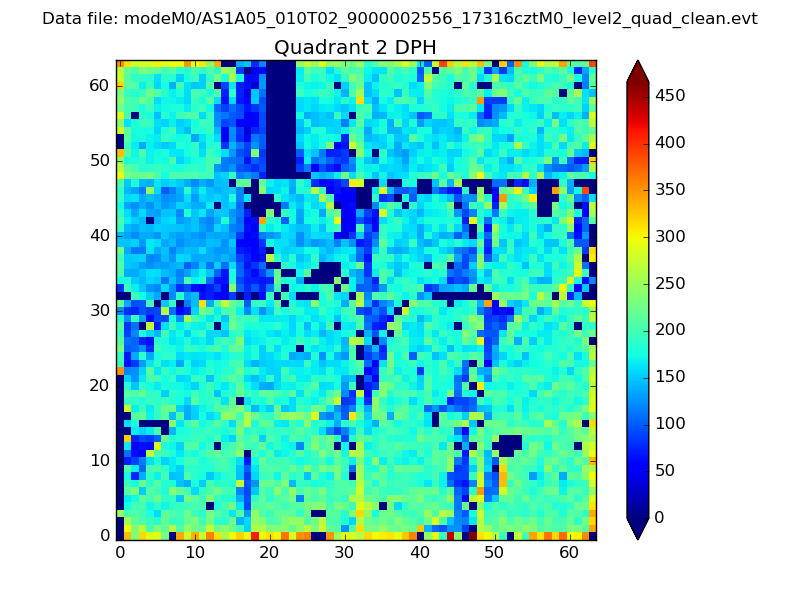 |
Quadrant C |
| Plot type | Count rate plots | Images |
|---|---|---|
| Comparison with Poisson distribution Blue bars denote a histogram of data divided into 1 sec bins. Red curve is a Poisson curve with rate = median count rate of data. |
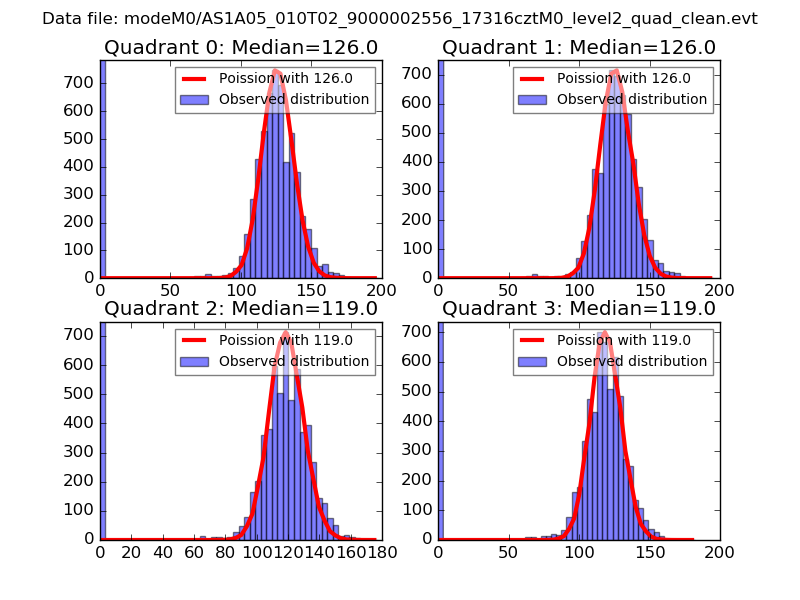 |
 |
| Quadrant-wise count rates Data is divided into 100 sec bins |
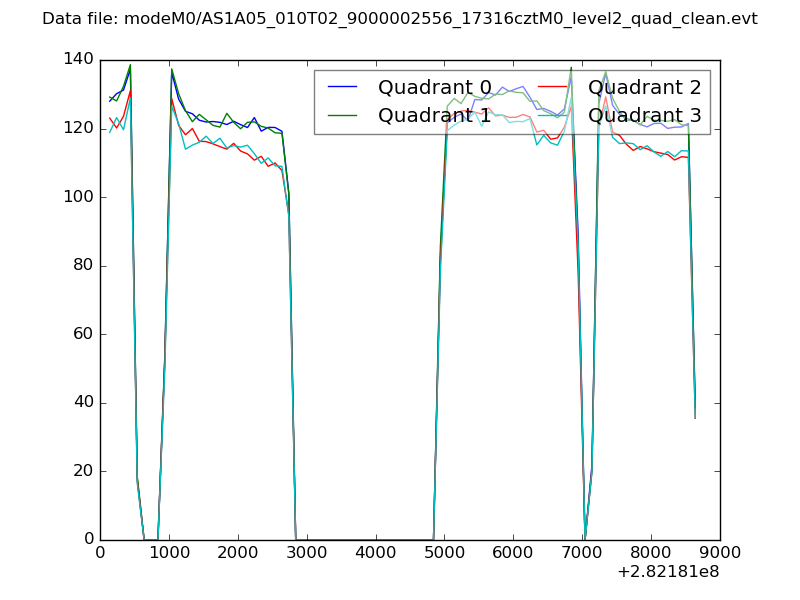 |
|
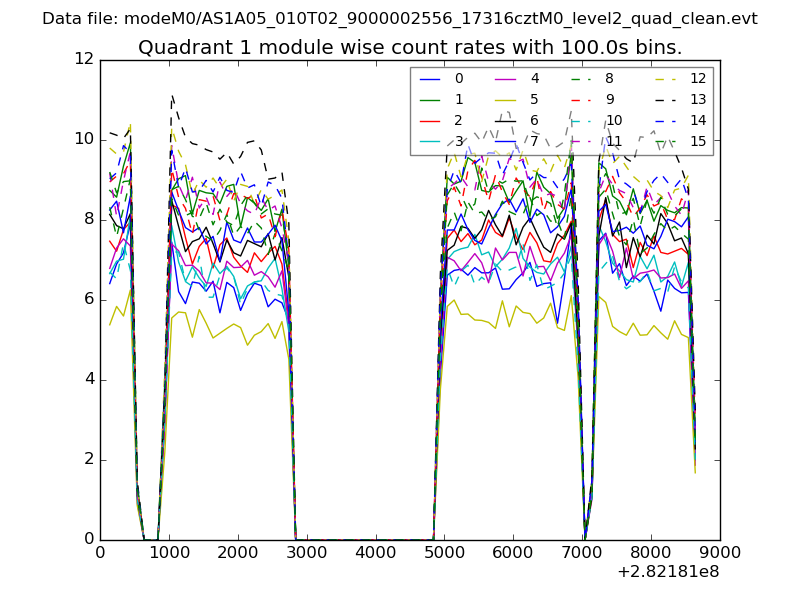
| Module-wise count rates for Quadrant A Data is divided into 100 sec bins |
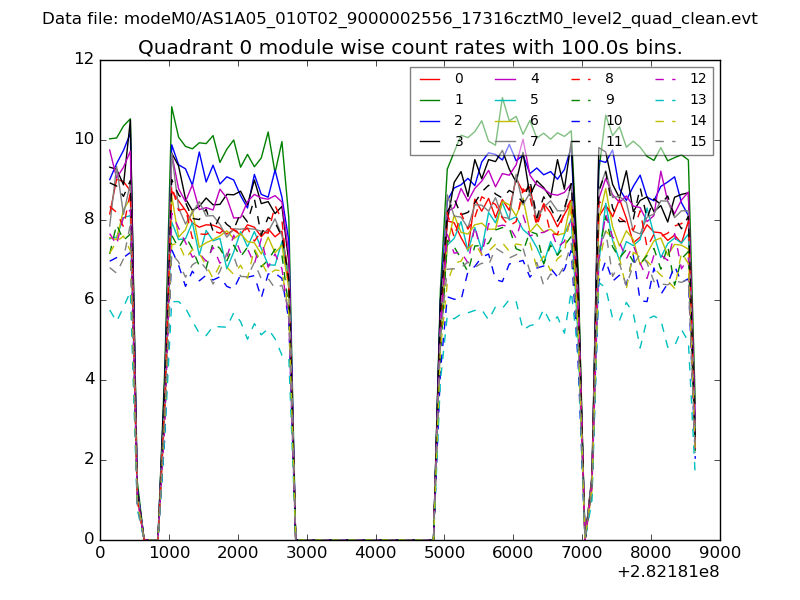 |
 |
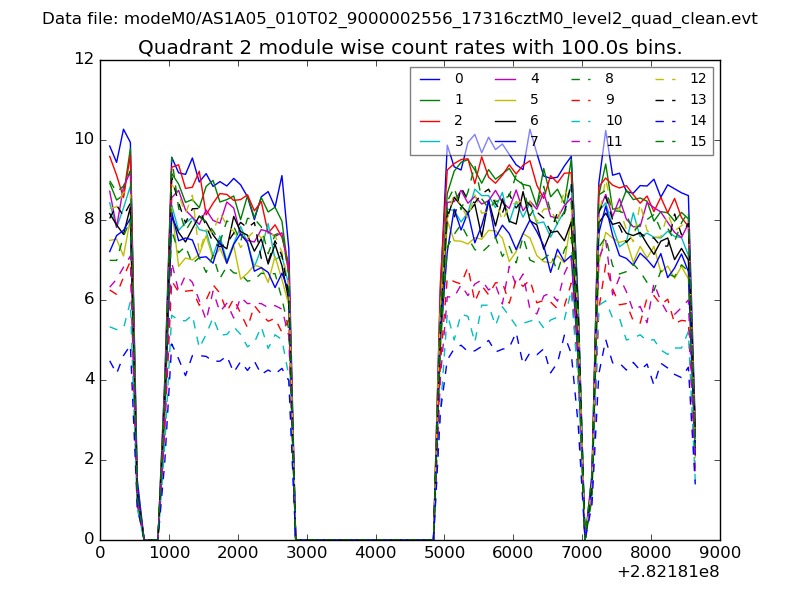
| Module-wise count rates for Quadrant B Data is divided into 100 sec bins |
 |
 |
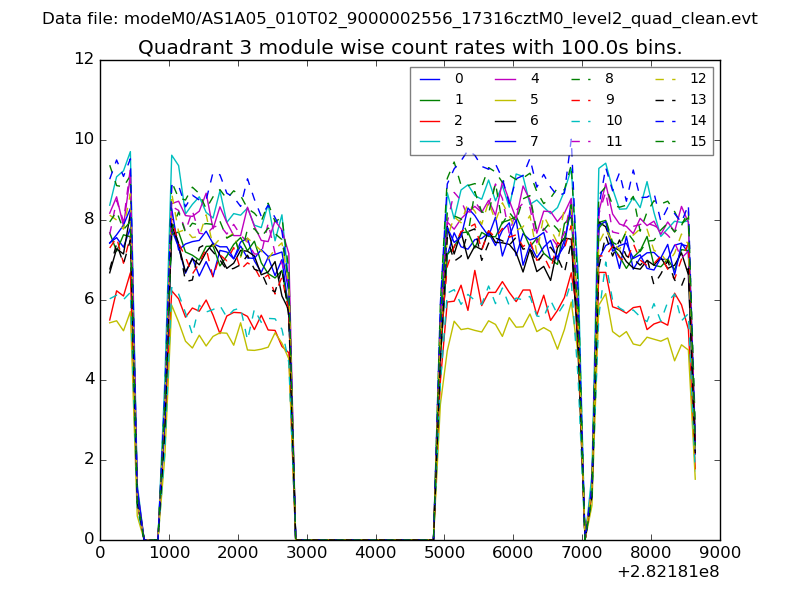
| Module-wise count rates for Quadrant C Data is divided into 100 sec bins |
 |
 |
| Module-wise count rates for Quadrant D Data is divided into 100 sec bins |
 |
 |
| Parameter | Plot |
|---|---|
| CZT HV Monitor | 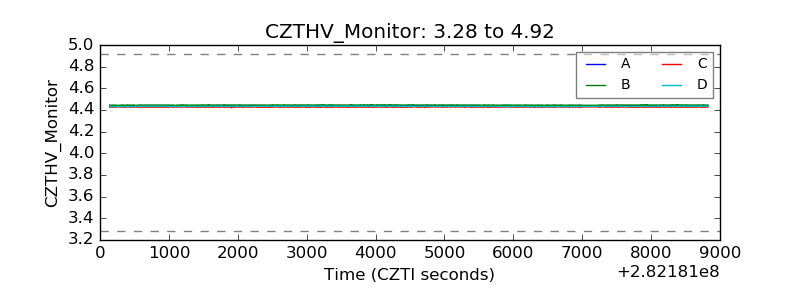 |
| D_VDD | 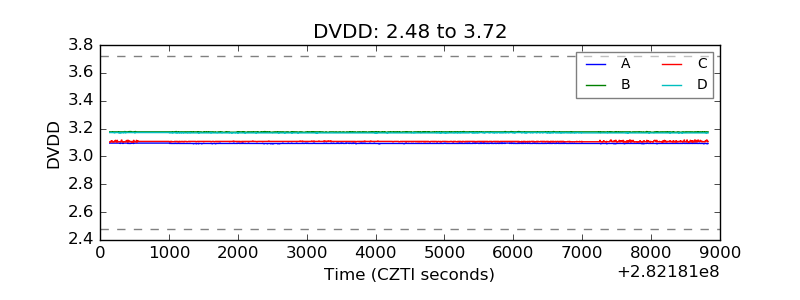 |
| Temperature 1 | 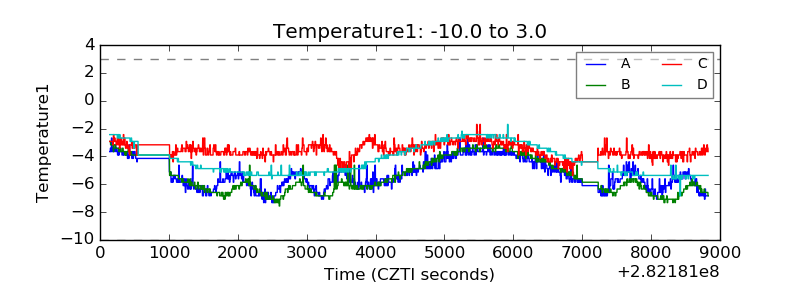 |
| Veto HV Monitor | 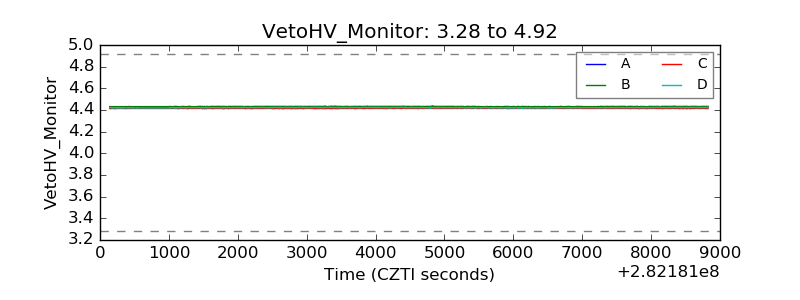 |
| Veto LLD | 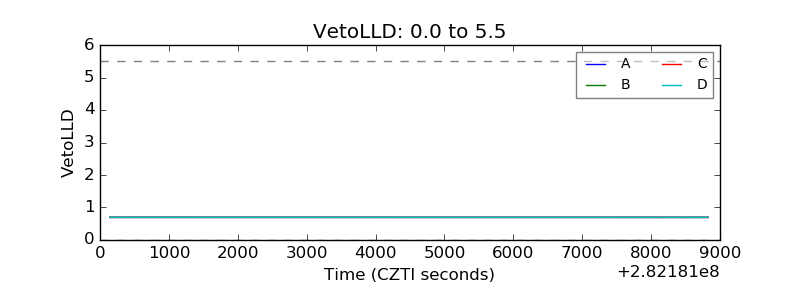 |
| Alpha Counter | 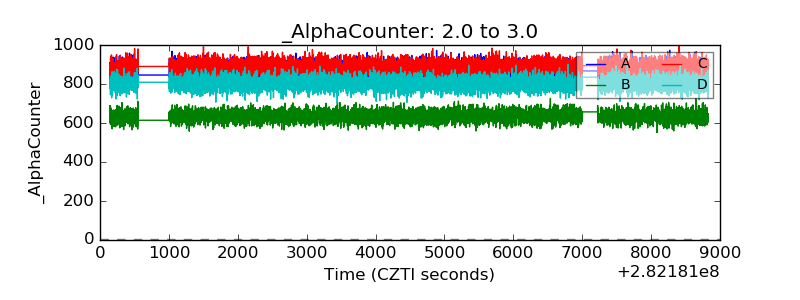 |
| _CPM_Rate | 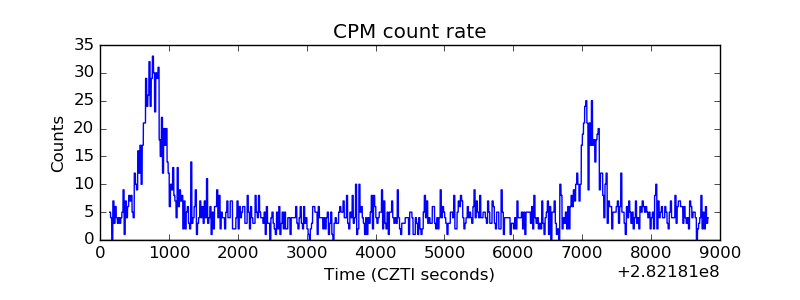 |
| CZT Counter | 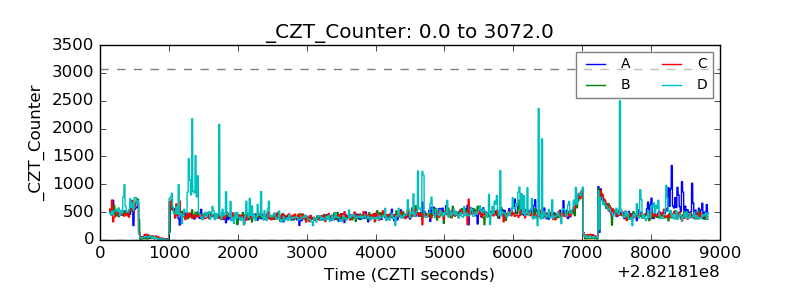 |
| +2.5 Volts monitor |  |
| +5 Volts monitor |  |
| _ROLL_ROT | 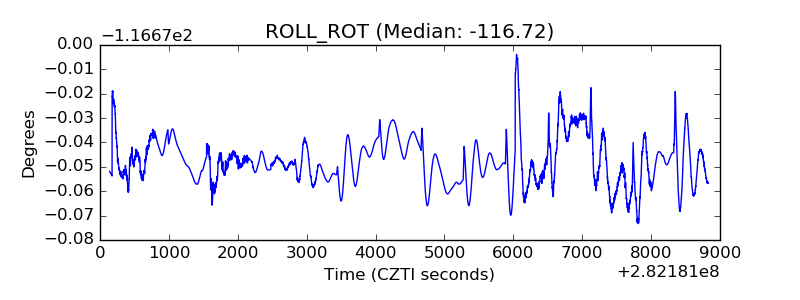 |
| _Roll_DEC |  |
| _Roll_RA | 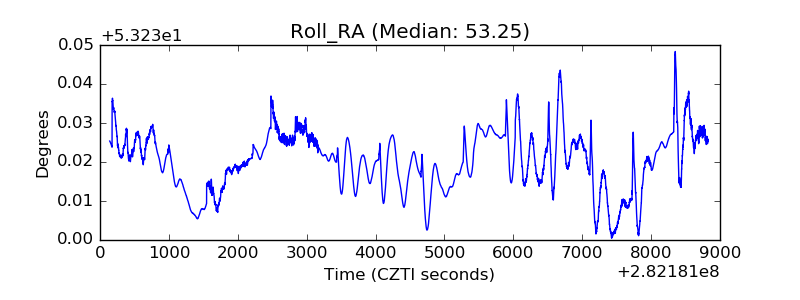 |
| Veto Counter | 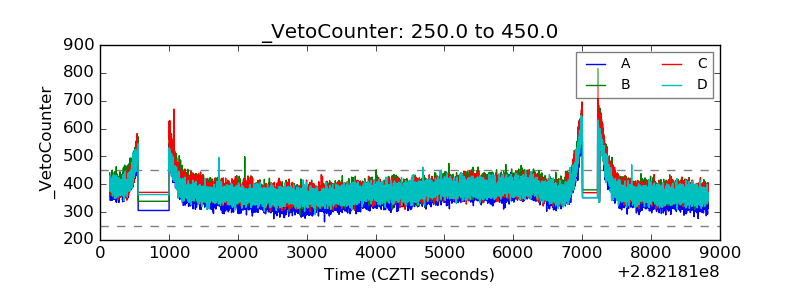 |