| Param | Original file | Final file |
|---|---|---|
| Filename | modeM0/AS1A05_010T02_9000002556_17319cztM0_level2.evt | modeM0/AS1A05_010T02_9000002556_17319cztM0_level2_quad_clean.evt |
| Size (bytes) | 842,195,520 | 146,502,720 |
| Size | 803.2 MB | 139.7 MB |
| Events in quadrant A | 5,978,730 | 904,890 |
| Events in quadrant B | 6,151,961 | 905,159 |
| Events in quadrant C | 6,156,769 | 859,980 |
| Events in quadrant D | 6,331,276 | 862,067 |
| Mode M0 | |||
|---|---|---|---|
| Quadrant | BADHDUFLAG | Total packets | Discarded packets |
| A | 0 | 26830 | 3 |
| B | 0 | 26998 | 3 |
| C | 0 | 27097 | 3 |
| D | 0 | 28080 | 3 |
| Mode M9 | |||
|---|---|---|---|
| Quadrant | BADHDUFLAG | Total packets | Discarded packets |
| A | 0 | 16 | 0 |
| B | 0 | 16 | 0 |
| C | 0 | 16 | 0 |
| D | 0 | 16 | 0 |
| Mode SS | |||
|---|---|---|---|
| Quadrant | BADHDUFLAG | Total packets | Discarded packets |
| A | 0 | 266 | 0 |
| B | 0 | 266 | 0 |
| C | 0 | 266 | 0 |
| D | 0 | 266 | 0 |
| Quadrant | Total seconds | Saturated seconds | Saturation percentage |
|---|---|---|---|
| A | 13089 | 154 | 1.176560% |
| B | 13090 | 203 | 1.550802% |
| C | 13090 | 270 | 2.062643% |
| D | 13090 | 158 | 1.207028% |
Noise dominated data is calculated using 1-second bins in cleaned event files. If a bin has >2000 counts, and if more than 50% of those come from <1% of pixels, then it is considered to be noise-dominated and hence unusable.
| Quadrant | # 1 sec bins | Bins with >0 counts | Bins with >2000 counts | High rate bins dominated by noise | Noise dominated (total time) | Noise dominated (detector-on time) | Marked lightcurve |
|---|---|---|---|---|---|---|---|
| A | 14734 | 13092 | 0 | 0 | 0.00% | 0.00% | 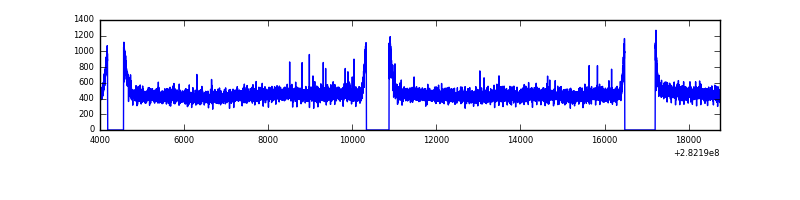 |
| B | 14735 | 13093 | 2 | 2 | 0.01% | 0.02% | 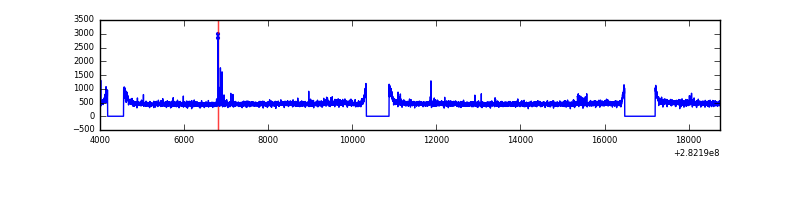 |
| C | 14735 | 13092 | 23 | 23 | 0.16% | 0.18% | 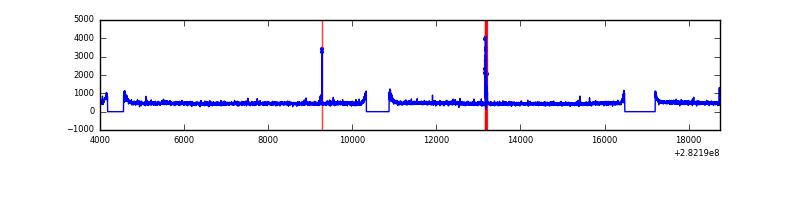 |
| D | 14735 | 13093 | 19 | 19 | 0.13% | 0.15% | 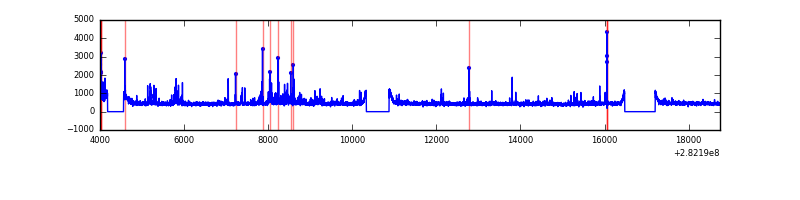 |
Top three noisy pixels from each quadrant. If the there are fewer than three noisy pixels in the level2.evt file, extra rows are filled as -1
| Pixel properties | Quadrant properties | ||||||
|---|---|---|---|---|---|---|---|
| Quadrant | DetID | PixID | Counts | Sigma | Mean | Median | Sigma |
| A | 0 | 226 | 13565 | 38.49 | 1554 | 1520 | 313.0 |
| A | 3 | 137 | 12295 | 34.43 | 1554 | 1520 | 313.0 |
| A | 12 | 194 | 11006 | 30.31 | 1554 | 1520 | 313.0 |
| B | 4 | 173 | 45341 | 146.6 | 1549 | 1506 | 299.0 |
| B | 12 | 111 | 37474 | 120.29 | 1549 | 1506 | 299.0 |
| B | 11 | 111 | 33023 | 105.4 | 1549 | 1506 | 299.0 |
| C | 14 | 238 | 227542 | 643.8 | 1490 | 1500 | 351.1 |
| C | 14 | 128 | 76709 | 214.21 | 1490 | 1500 | 351.1 |
| C | 3 | 233 | 28853 | 77.91 | 1490 | 1500 | 351.1 |
| D | 5 | 222 | 327445 | 887.52 | 1510 | 1469 | 367.3 |
| D | 1 | 52 | 237037 | 641.37 | 1510 | 1469 | 367.3 |
| D | 2 | 152 | 58795 | 156.08 | 1510 | 1469 | 367.3 |
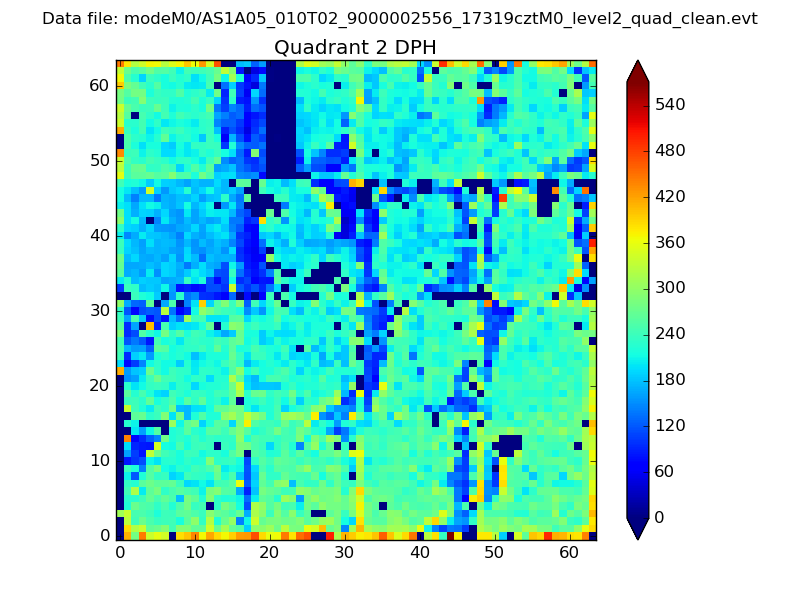
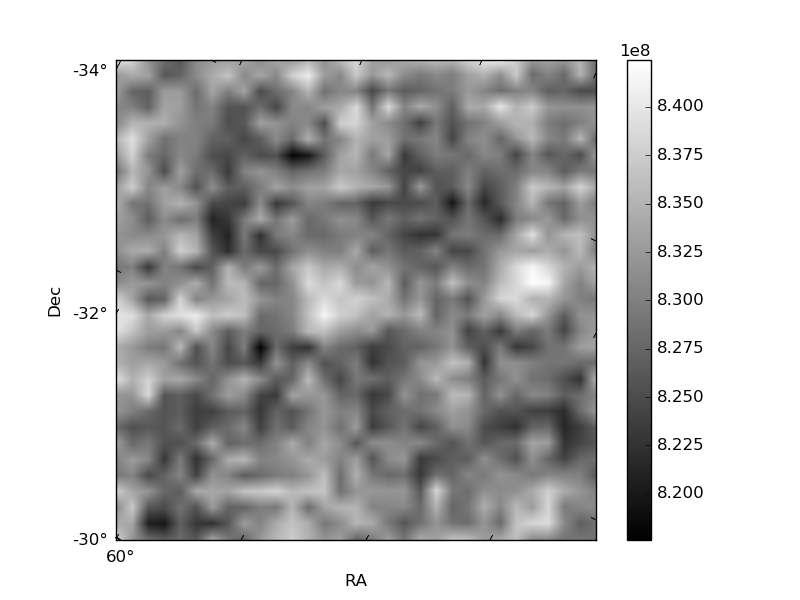
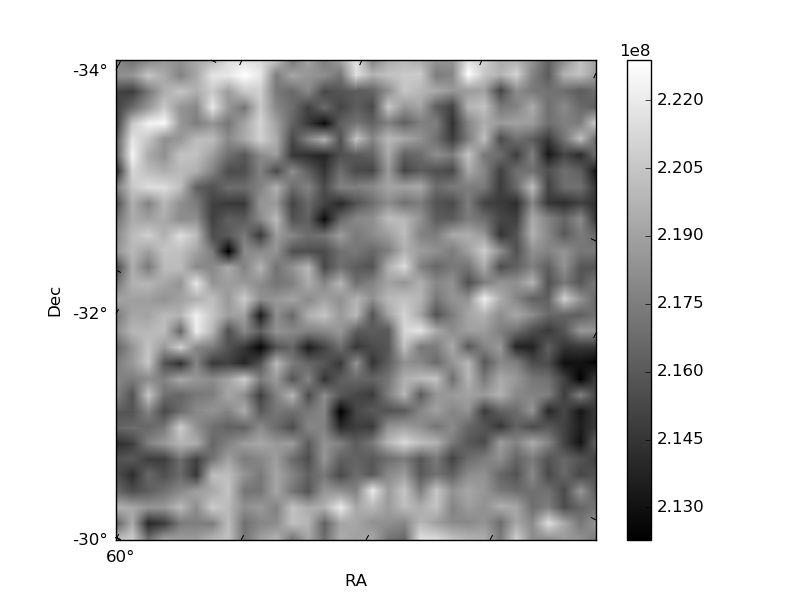
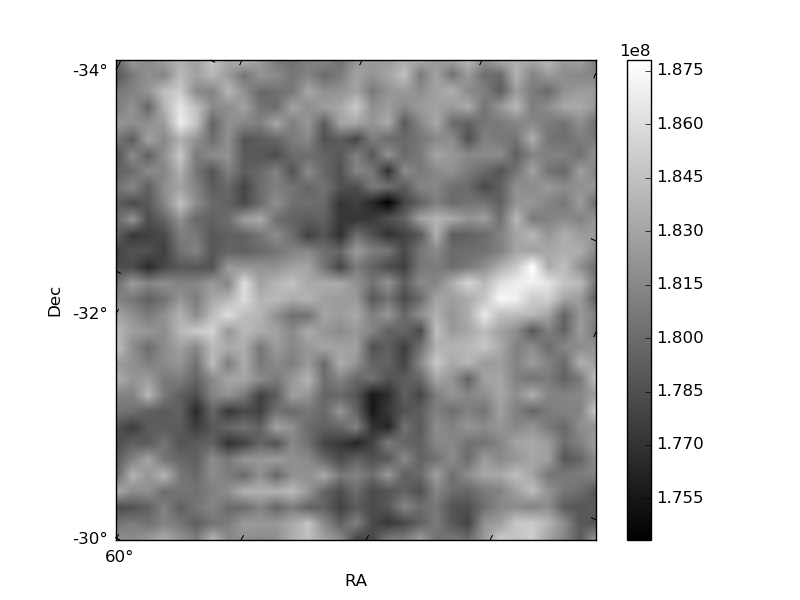
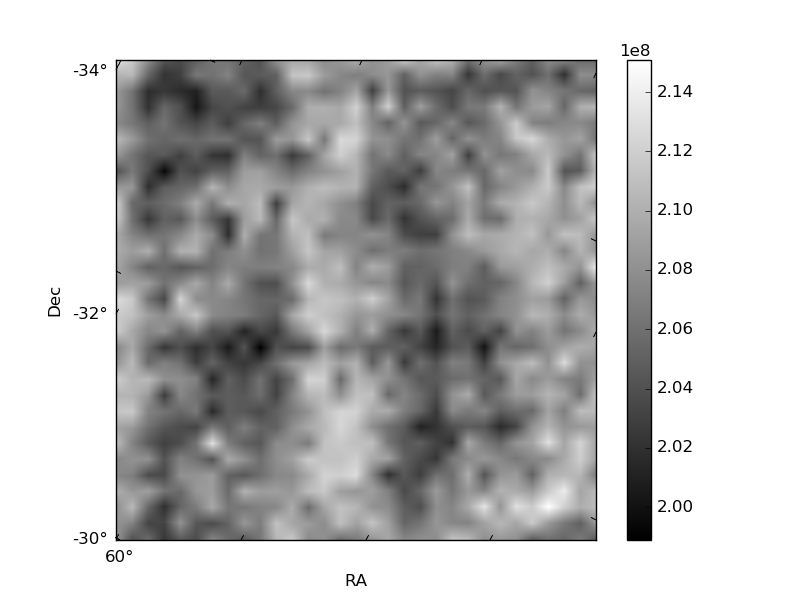
Histogram calculated using DETX and DETY for each event in the final _common_clean file
| Quadrant A | 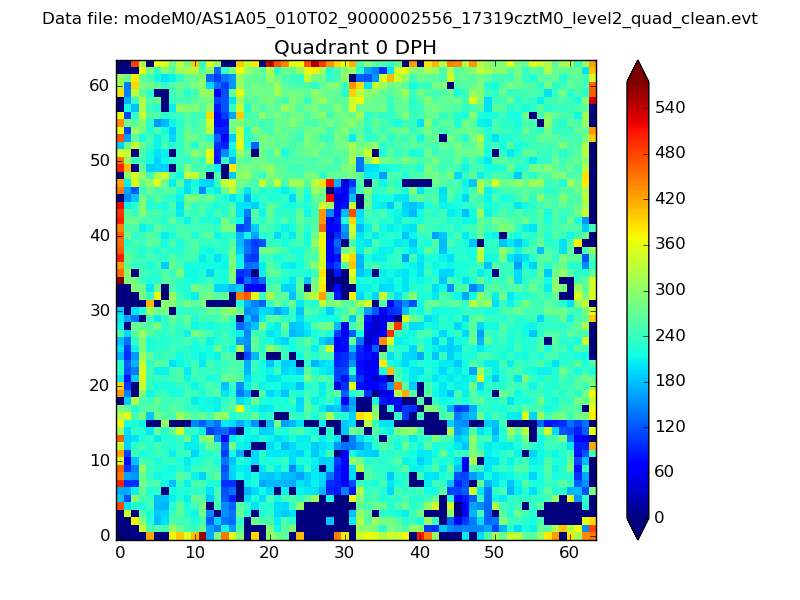 |
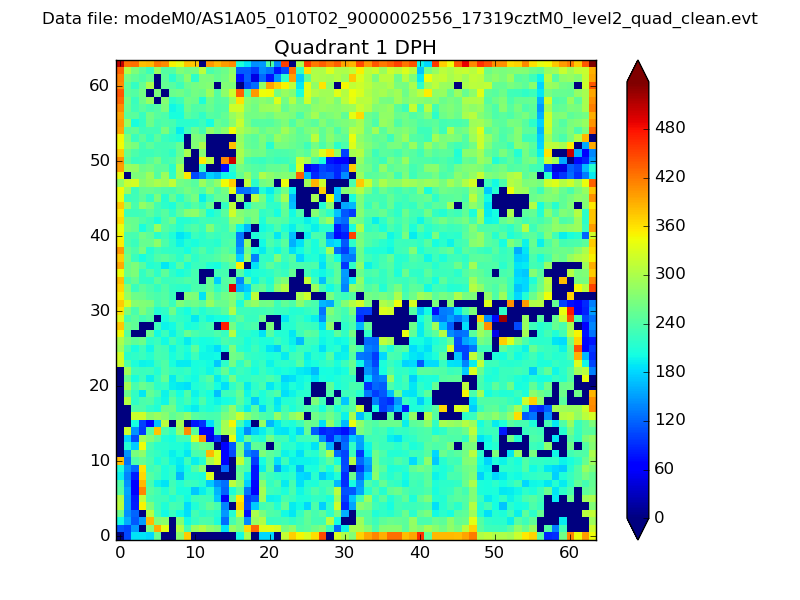 |
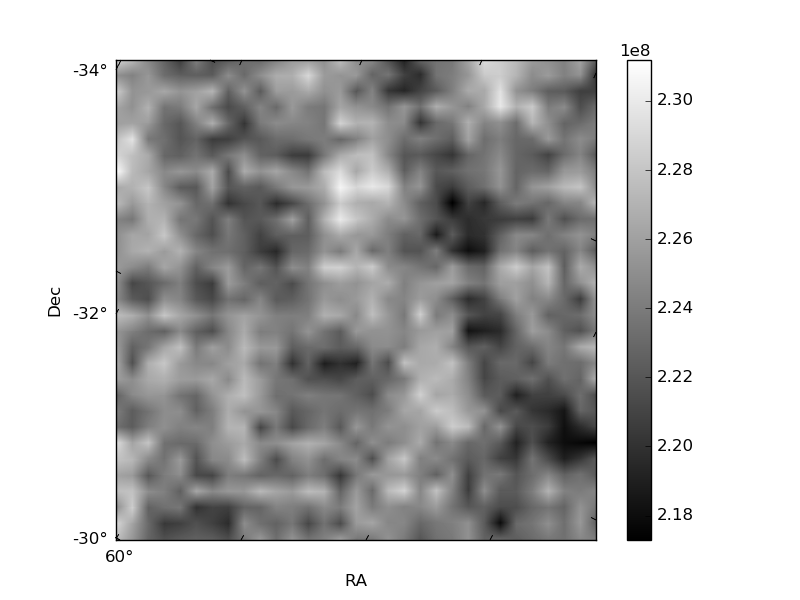
Quadrant B |
|---|---|---|---|
| Quadrant D | 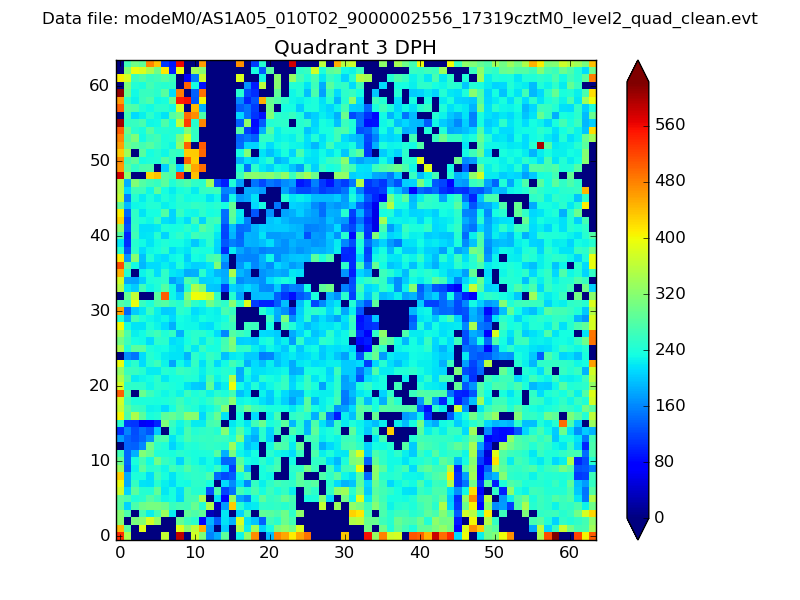 |
 |
Quadrant C |
| Plot type | Count rate plots | Images |
|---|---|---|
| Comparison with Poisson distribution Blue bars denote a histogram of data divided into 1 sec bins. Red curve is a Poisson curve with rate = median count rate of data. |
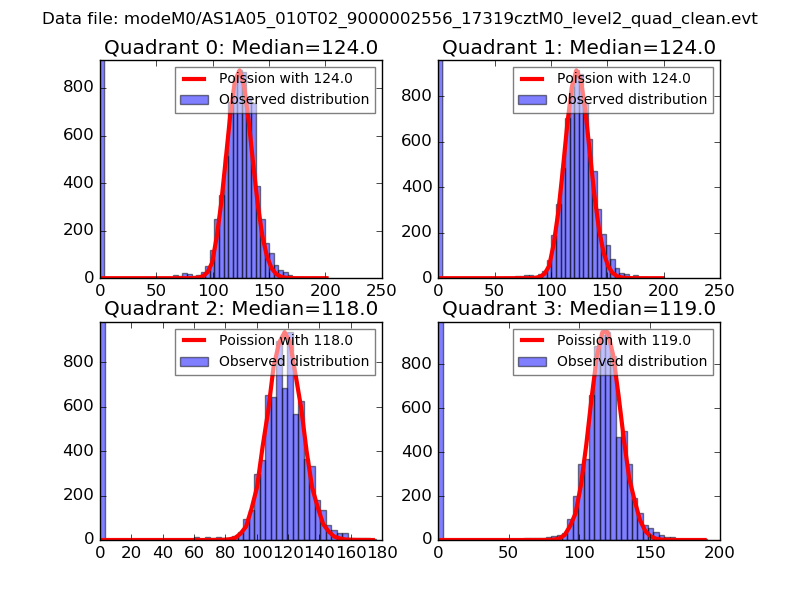 |
 |
| Quadrant-wise count rates Data is divided into 100 sec bins |
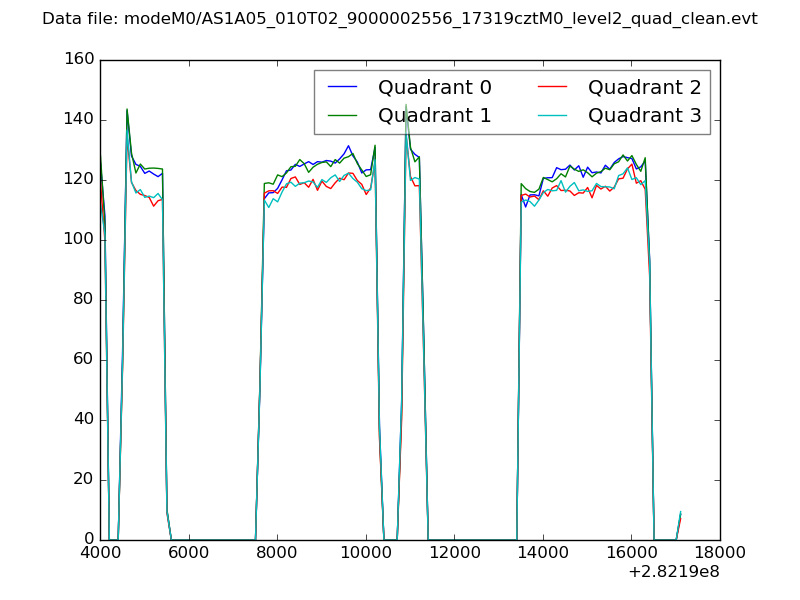 |
|
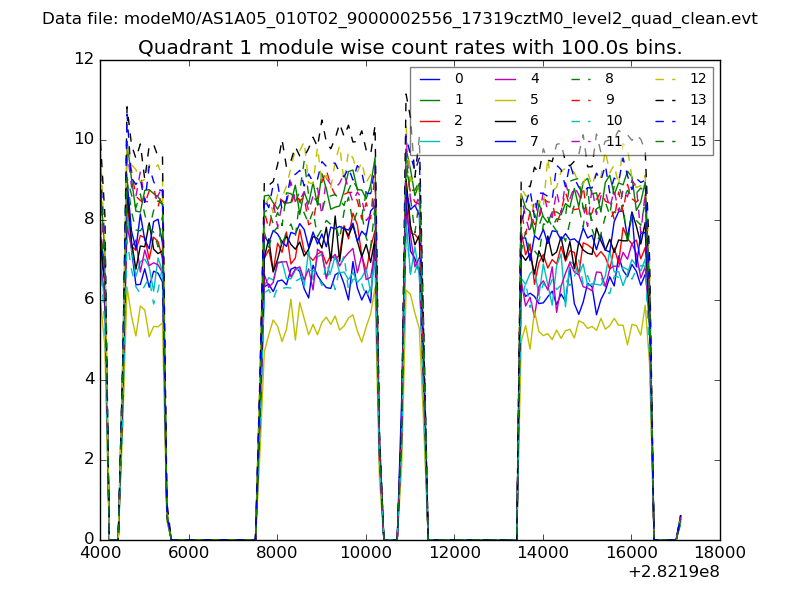
| Module-wise count rates for Quadrant A Data is divided into 100 sec bins |
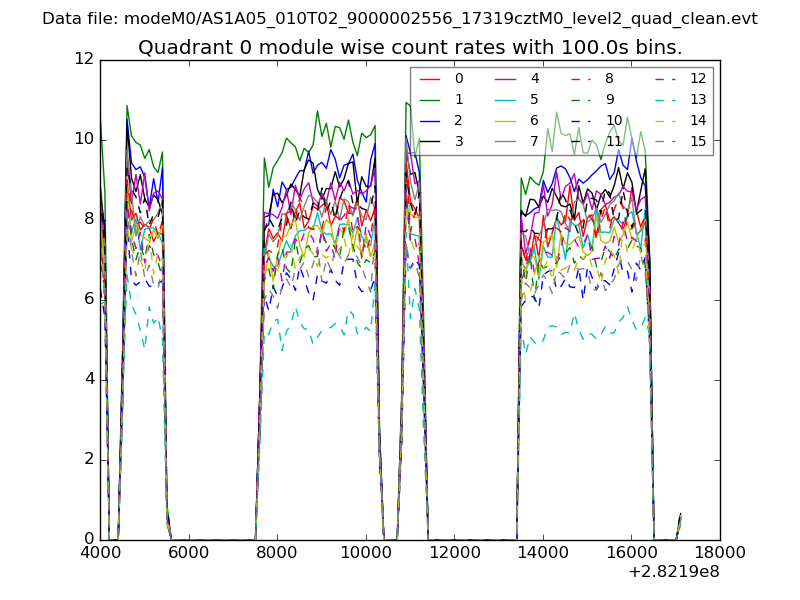 |
 |
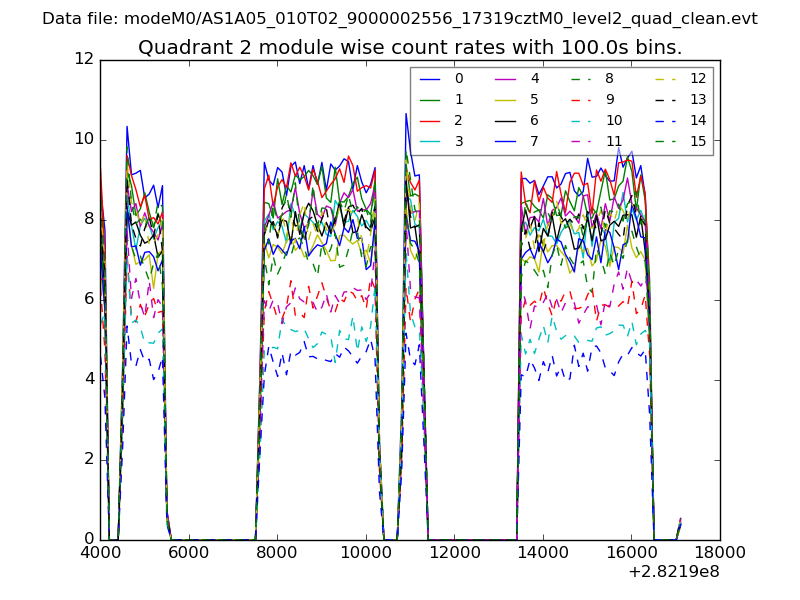
| Module-wise count rates for Quadrant B Data is divided into 100 sec bins |
 |
 |
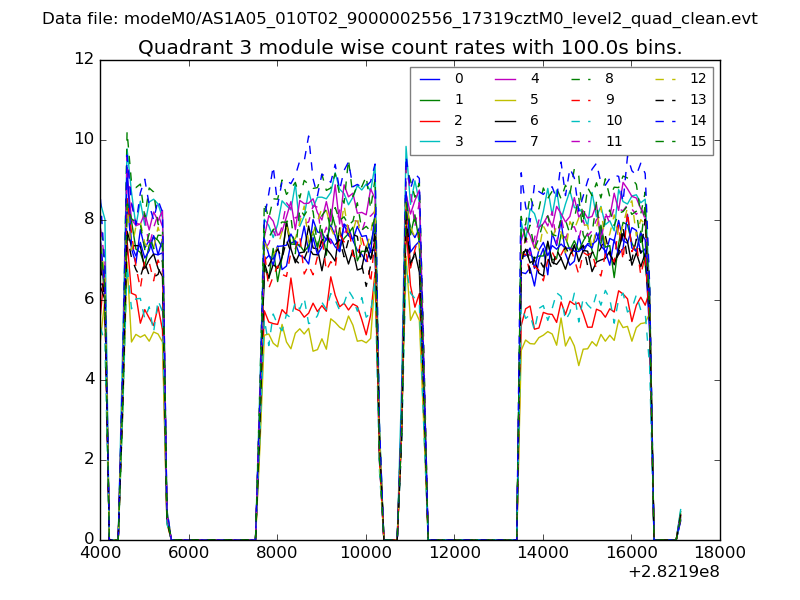
| Module-wise count rates for Quadrant C Data is divided into 100 sec bins |
 |
 |
| Module-wise count rates for Quadrant D Data is divided into 100 sec bins |
 |
 |
| Parameter | Plot |
|---|---|
| CZT HV Monitor | 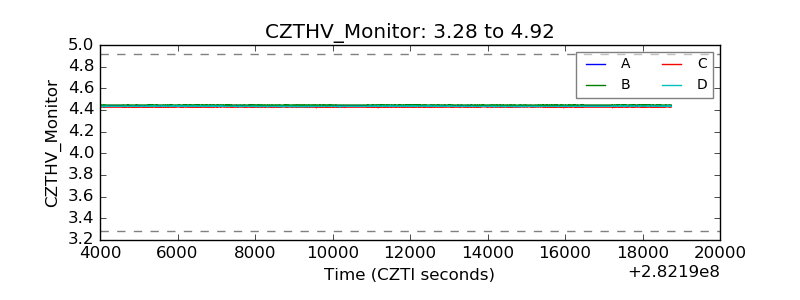 |
| D_VDD | 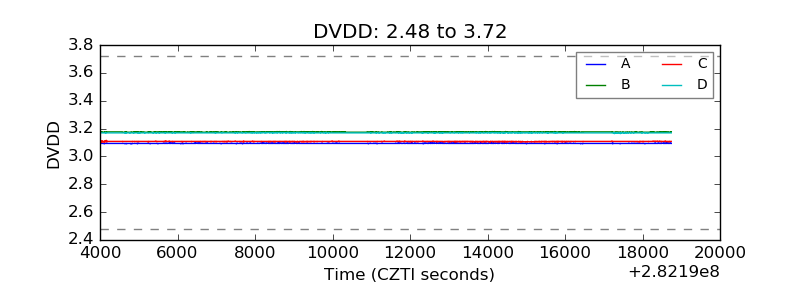 |
| Temperature 1 |  |
| Veto HV Monitor | 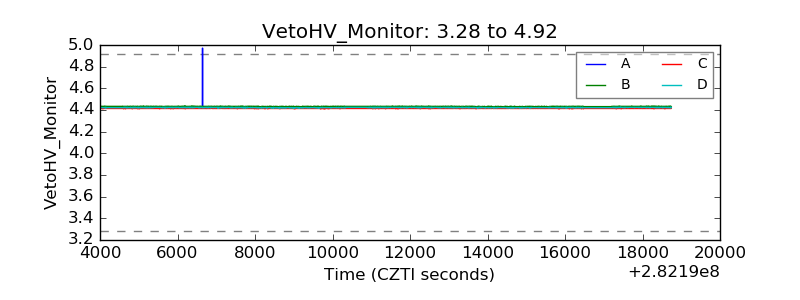 |
| Veto LLD | 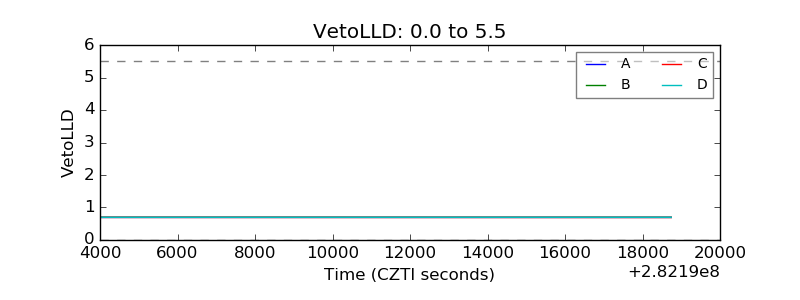 |
| Alpha Counter | 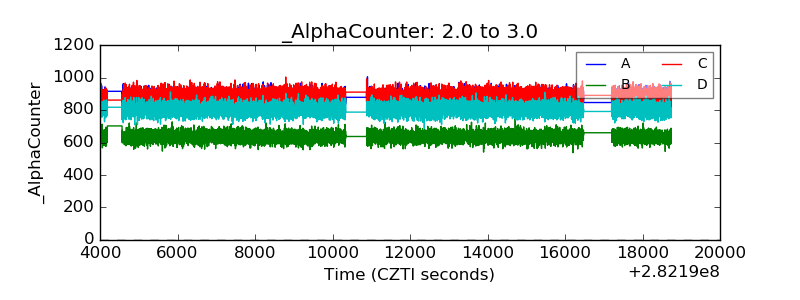 |
| _CPM_Rate | 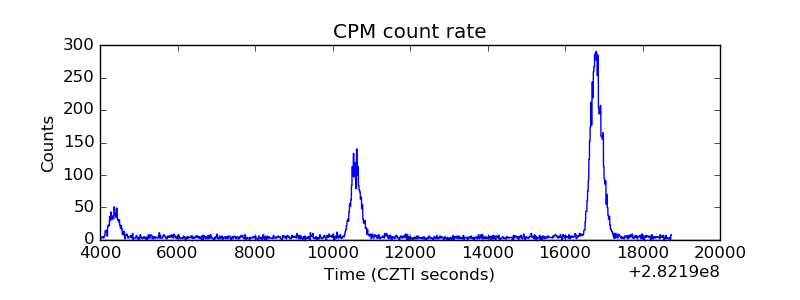 |
| CZT Counter | 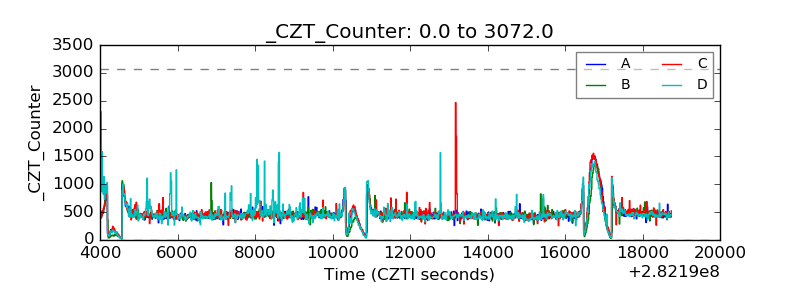 |
| +2.5 Volts monitor | 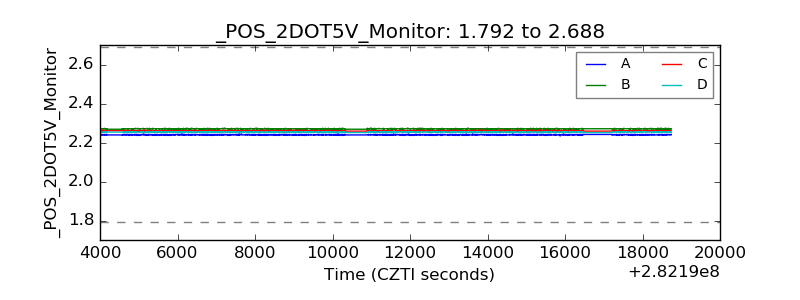 |
| +5 Volts monitor |  |
| _ROLL_ROT | 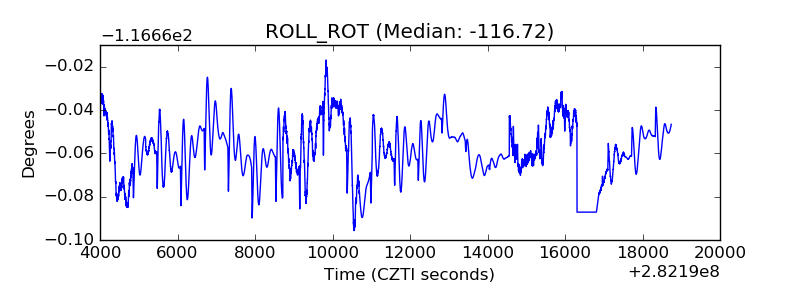 |
| _Roll_DEC | 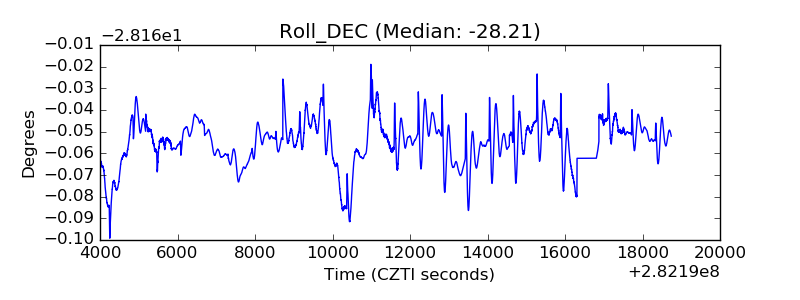 |
| _Roll_RA | 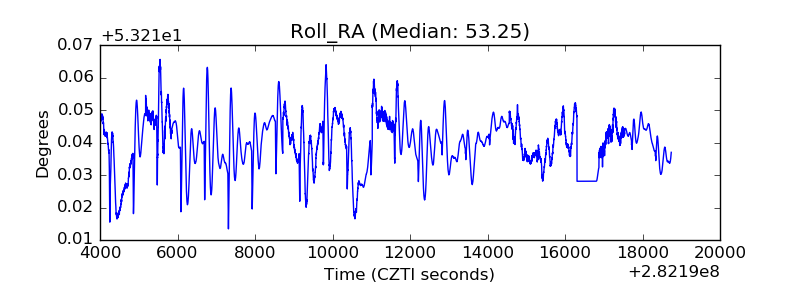 |
| Veto Counter | 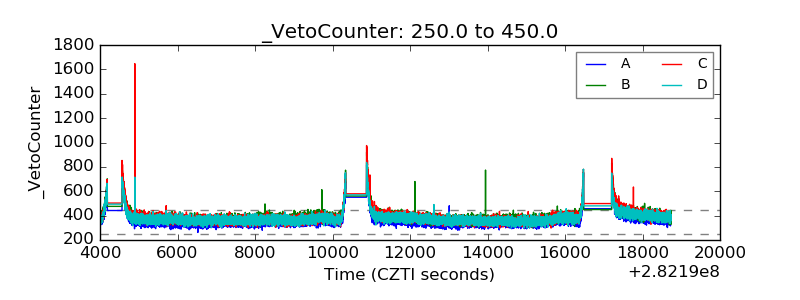 |