| Param | Original file | Final file |
|---|---|---|
| Filename | modeM0/AS1A05_010T02_9000002556_17321cztM0_level2.evt | modeM0/AS1A05_010T02_9000002556_17321cztM0_level2_quad_clean.evt |
| Size (bytes) | 311,745,600 | 62,602,560 |
| Size | 297.3 MB | 59.7 MB |
| Events in quadrant A | 2,224,644 | 396,188 |
| Events in quadrant B | 2,262,190 | 397,117 |
| Events in quadrant C | 2,240,483 | 379,801 |
| Events in quadrant D | 2,379,149 | 378,166 |
| Mode M0 | |||
|---|---|---|---|
| Quadrant | BADHDUFLAG | Total packets | Discarded packets |
| A | 0 | 9936 | 1 |
| B | 0 | 9990 | 1 |
| C | 0 | 10018 | 1 |
| D | 0 | 10492 | 1 |
| Mode M9 | |||
|---|---|---|---|
| Quadrant | BADHDUFLAG | Total packets | Discarded packets |
| A | 0 | 6 | 0 |
| B | 0 | 7 | 0 |
| C | 0 | 7 | 0 |
| D | 0 | 7 | 0 |
| Mode SS | |||
|---|---|---|---|
| Quadrant | BADHDUFLAG | Total packets | Discarded packets |
| A | 0 | 98 | 0 |
| B | 0 | 98 | 0 |
| C | 0 | 98 | 0 |
| D | 0 | 98 | 0 |
| Quadrant | Total seconds | Saturated seconds | Saturation percentage |
|---|---|---|---|
| A | 4906 | 12 | 0.244598% |
| B | 4906 | 19 | 0.387281% |
| C | 4906 | 32 | 0.652263% |
| D | 4906 | 34 | 0.693029% |
Noise dominated data is calculated using 1-second bins in cleaned event files. If a bin has >2000 counts, and if more than 50% of those come from <1% of pixels, then it is considered to be noise-dominated and hence unusable.
| Quadrant | # 1 sec bins | Bins with >0 counts | Bins with >2000 counts | High rate bins dominated by noise | Noise dominated (total time) | Noise dominated (detector-on time) | Marked lightcurve |
|---|---|---|---|---|---|---|---|
| A | 4906 | 4906 | 0 | 0 | 0.00% | 0.00% | 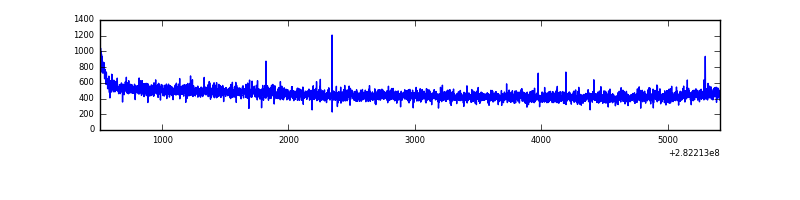 |
| B | 4906 | 4906 | 0 | 0 | 0.00% | 0.00% | 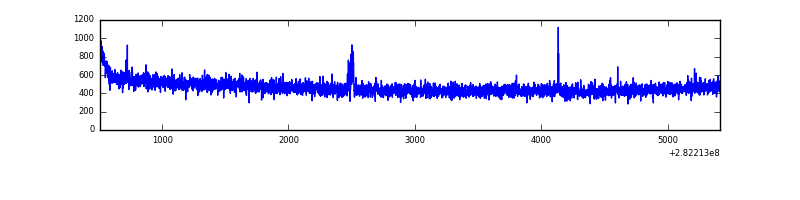 |
| C | 4906 | 4906 | 0 | 0 | 0.00% | 0.00% | 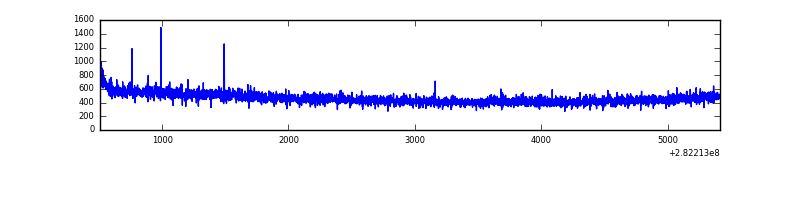 |
| D | 4906 | 4906 | 20 | 20 | 0.41% | 0.41% | 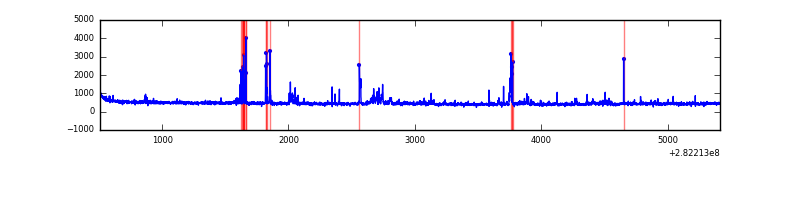 |
Top three noisy pixels from each quadrant. If the there are fewer than three noisy pixels in the level2.evt file, extra rows are filled as -1
| Pixel properties | Quadrant properties | ||||||
|---|---|---|---|---|---|---|---|
| Quadrant | DetID | PixID | Counts | Sigma | Mean | Median | Sigma |
| A | 0 | 226 | 5100 | 38.32 | 578 | 567 | 118.3 |
| A | 3 | 137 | 4362 | 32.08 | 578 | 567 | 118.3 |
| A | 12 | 194 | 4124 | 30.07 | 578 | 567 | 118.3 |
| B | 12 | 111 | 13197 | 113.34 | 575 | 562 | 111.5 |
| B | 0 | 230 | 12229 | 104.66 | 575 | 562 | 111.5 |
| B | 11 | 111 | 11802 | 100.83 | 575 | 562 | 111.5 |
| C | 14 | 238 | 85235 | 650.08 | 550 | 552 | 130.3 |
| C | 5 | 112 | 6470 | 45.43 | 550 | 552 | 130.3 |
| C | 3 | 233 | 4074 | 27.04 | 550 | 552 | 130.3 |
| D | 5 | 222 | 102539 | 748.79 | 557 | 540 | 136.2 |
| D | 13 | 238 | 41527 | 300.89 | 557 | 540 | 136.2 |
| D | 9 | 65 | 39909 | 289.01 | 557 | 540 | 136.2 |
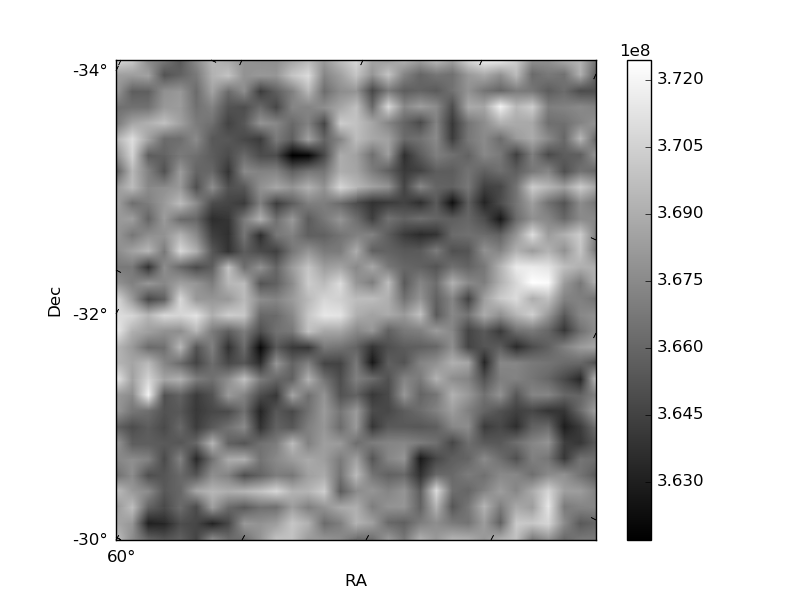
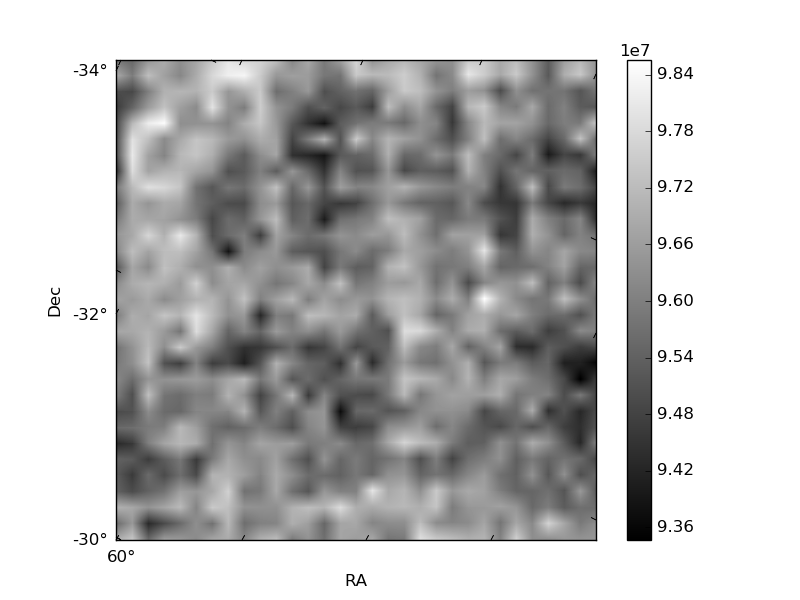
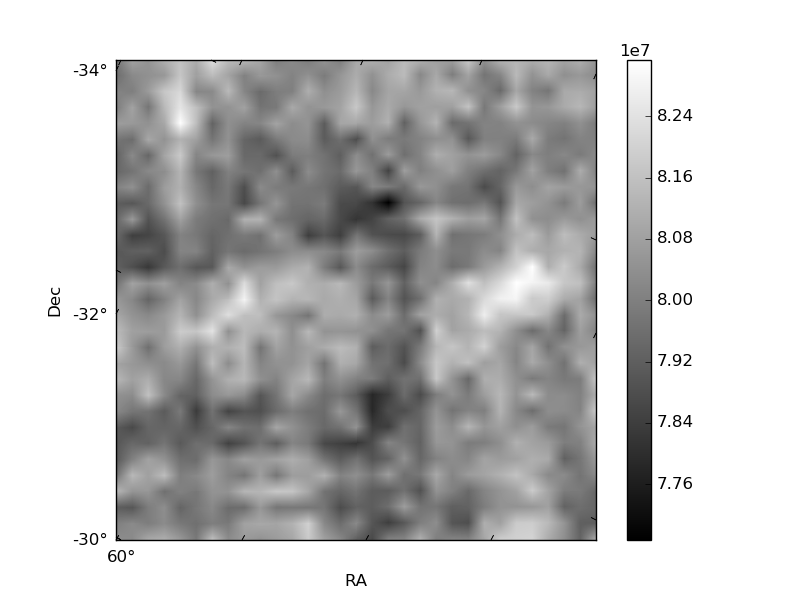
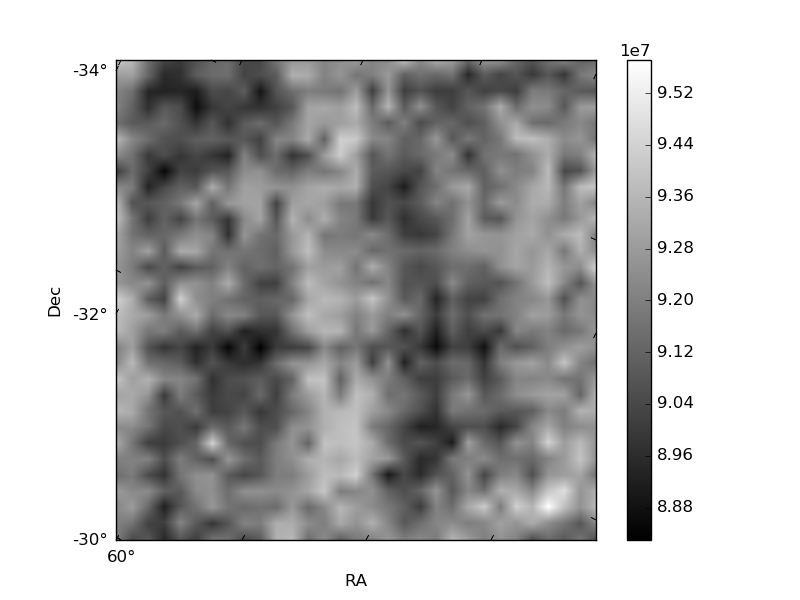
Histogram calculated using DETX and DETY for each event in the final _common_clean file
| Quadrant A | 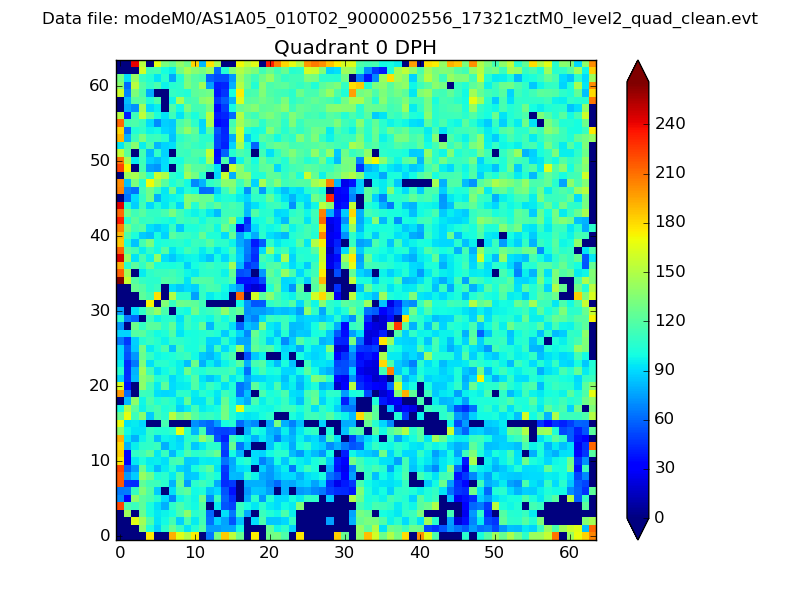 |
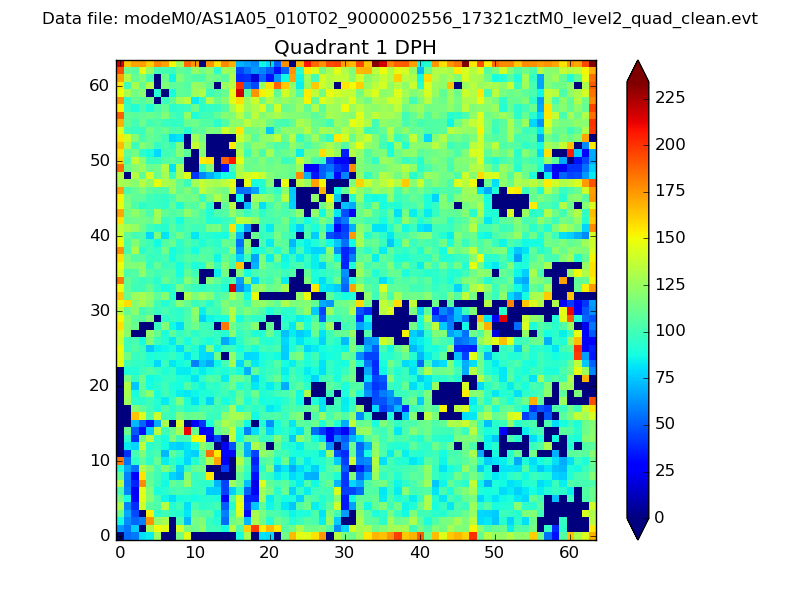 |
Quadrant B |
|---|---|---|---|
| Quadrant D | 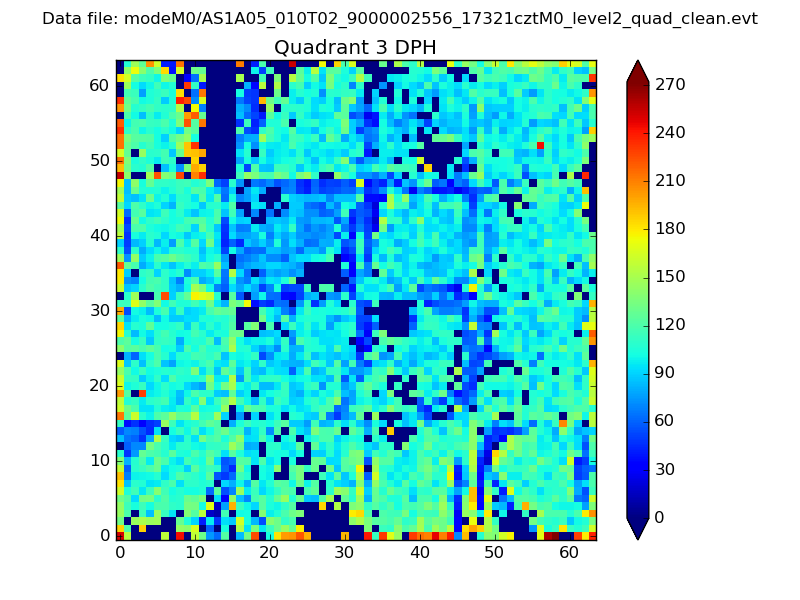 |
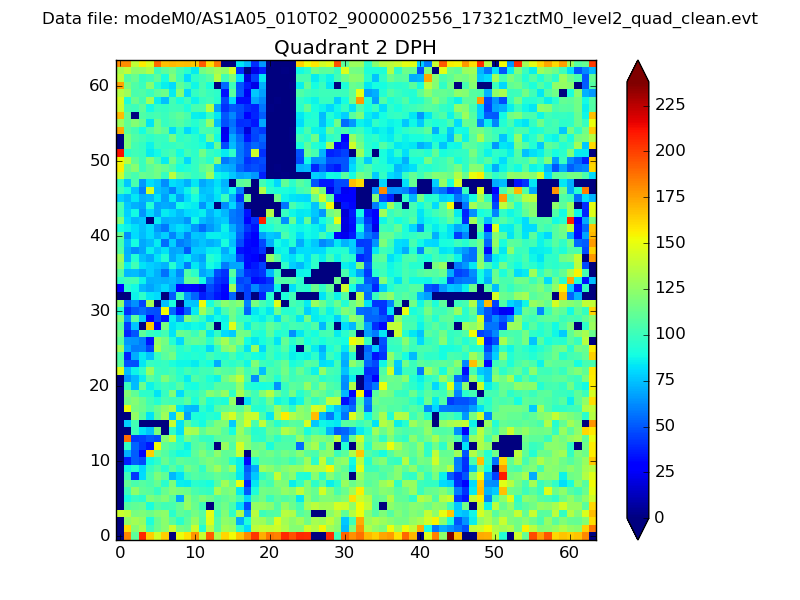 |
Quadrant C |
| Plot type | Count rate plots | Images |
|---|---|---|
| Comparison with Poisson distribution Blue bars denote a histogram of data divided into 1 sec bins. Red curve is a Poisson curve with rate = median count rate of data. |
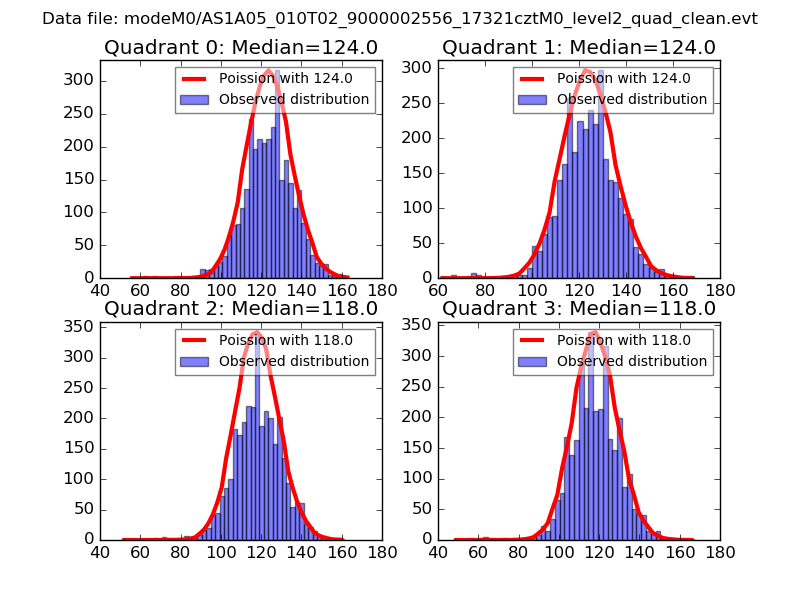 |
 |
| Quadrant-wise count rates Data is divided into 100 sec bins |
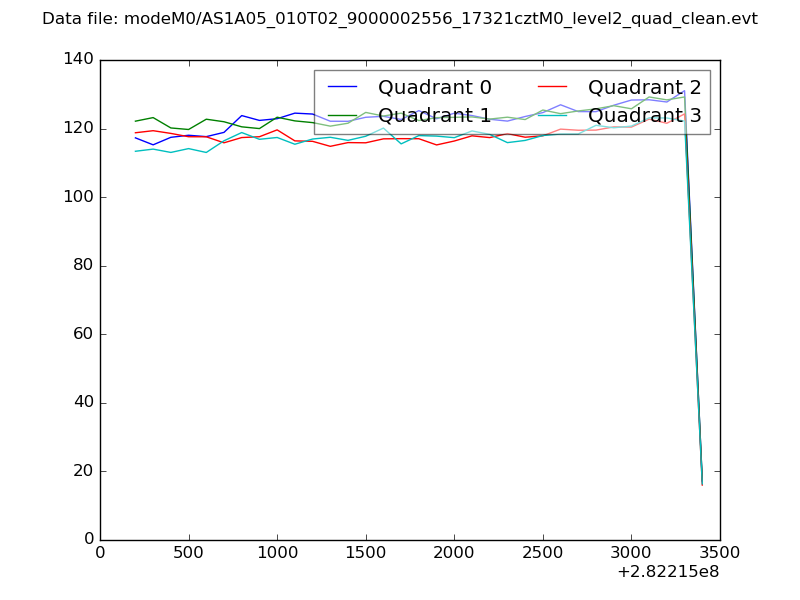 |
|
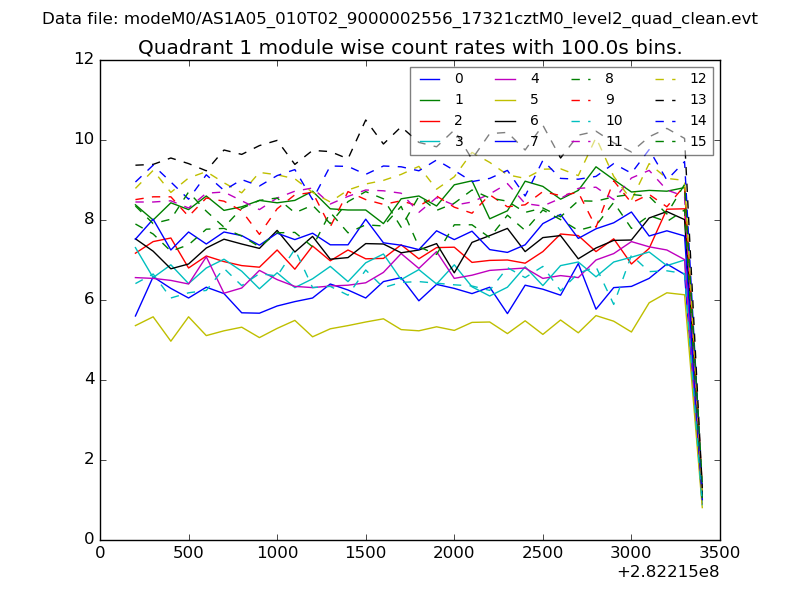
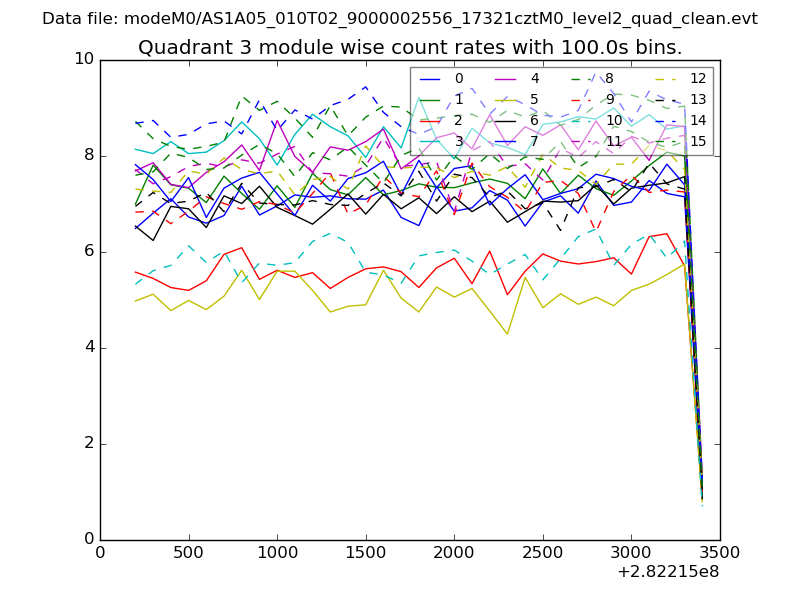
| Module-wise count rates for Quadrant A Data is divided into 100 sec bins |
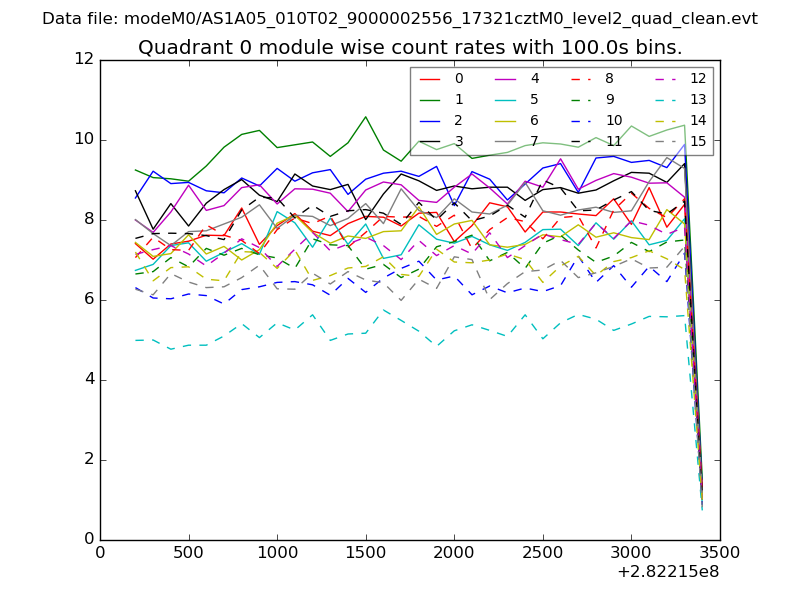 |
 |
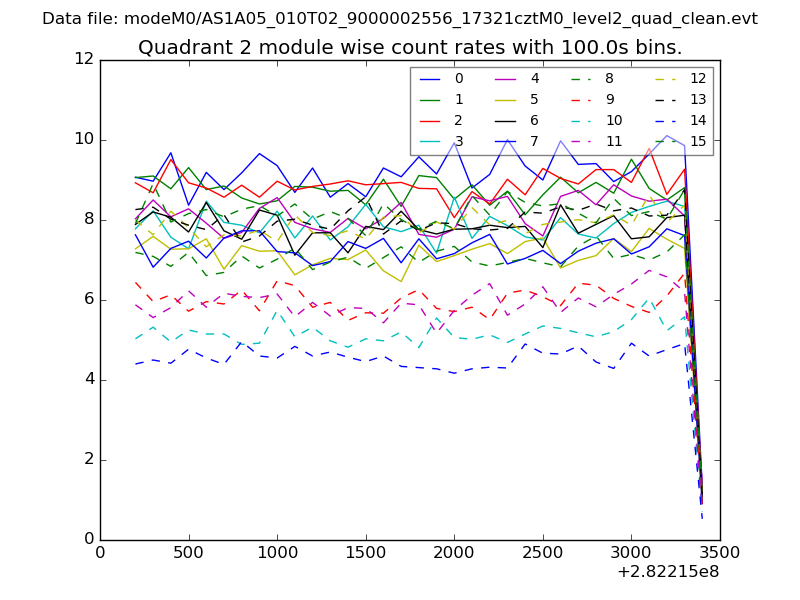
| Module-wise count rates for Quadrant B Data is divided into 100 sec bins |
 |
 |
| Module-wise count rates for Quadrant C Data is divided into 100 sec bins |
 |
 |
| Module-wise count rates for Quadrant D Data is divided into 100 sec bins |
 |
 |
| Parameter | Plot |
|---|---|
| CZT HV Monitor | 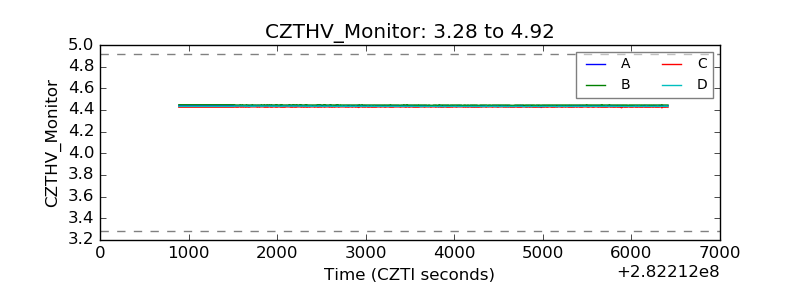 |
| D_VDD | 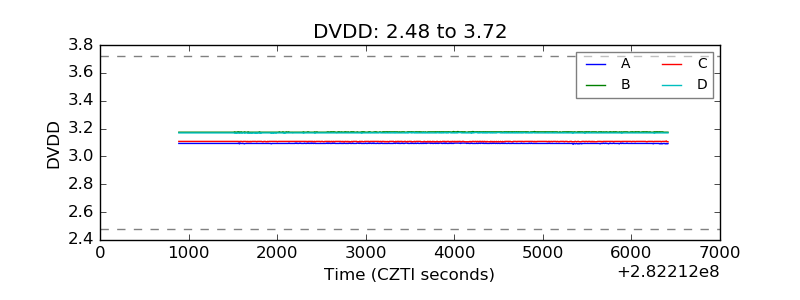 |
| Temperature 1 | 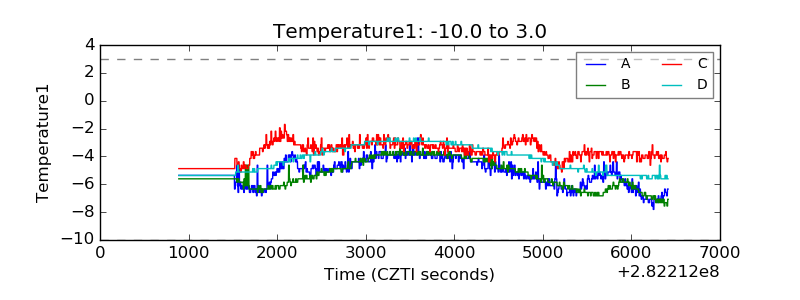 |
| Veto HV Monitor | 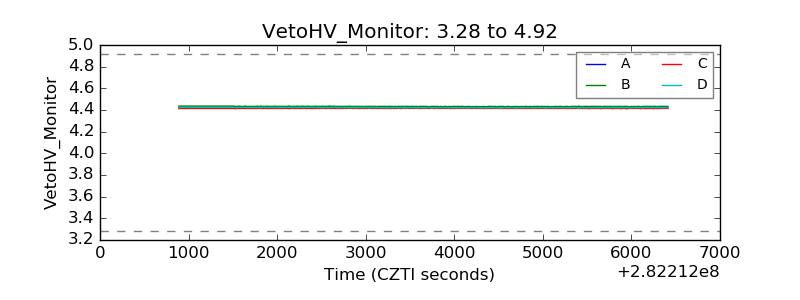 |
| Veto LLD | 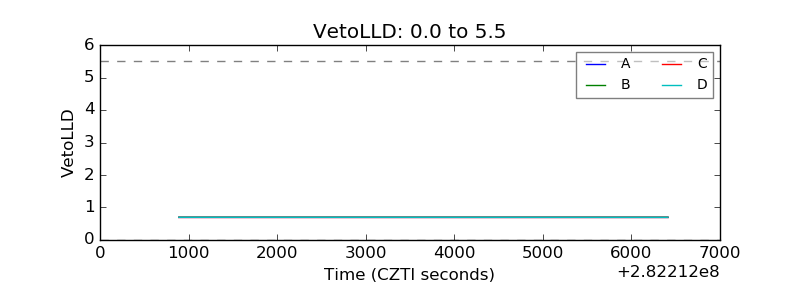 |
| Alpha Counter | 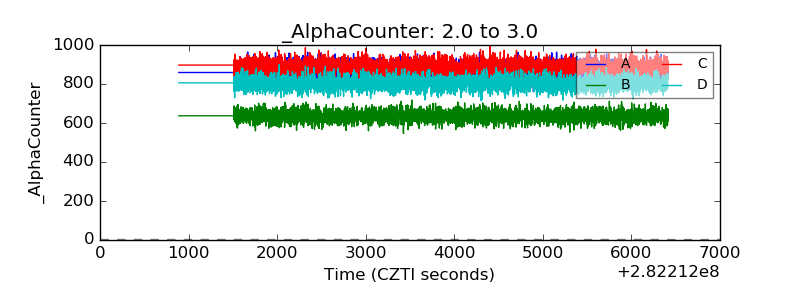 |
| _CPM_Rate | 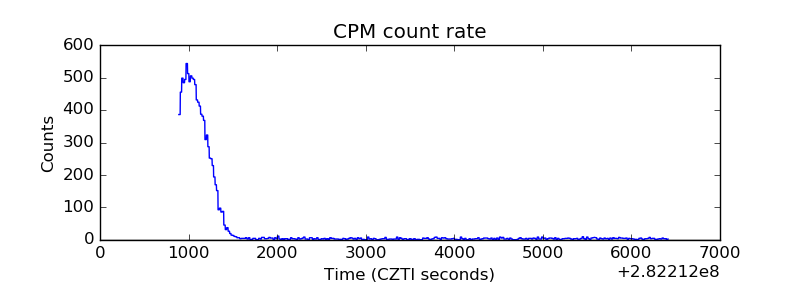 |
| CZT Counter | 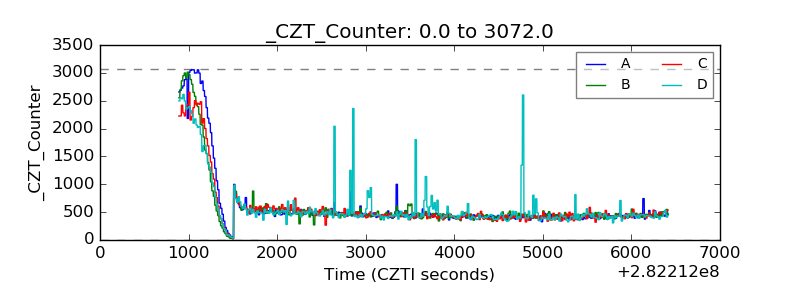 |
| +2.5 Volts monitor |  |
| +5 Volts monitor |  |
| _ROLL_ROT | 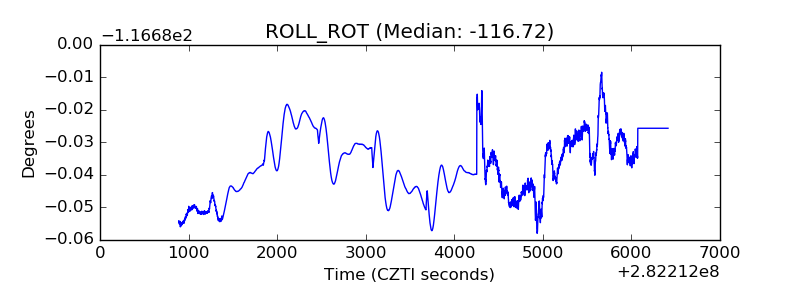 |
| _Roll_DEC | 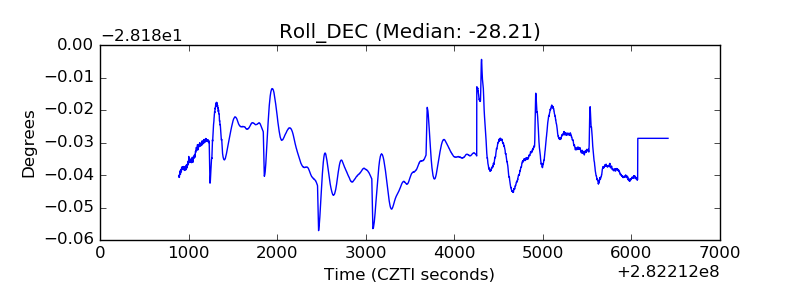 |
| _Roll_RA | 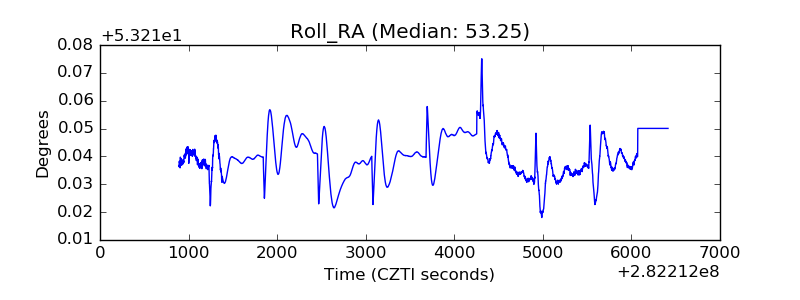 |
| Veto Counter | 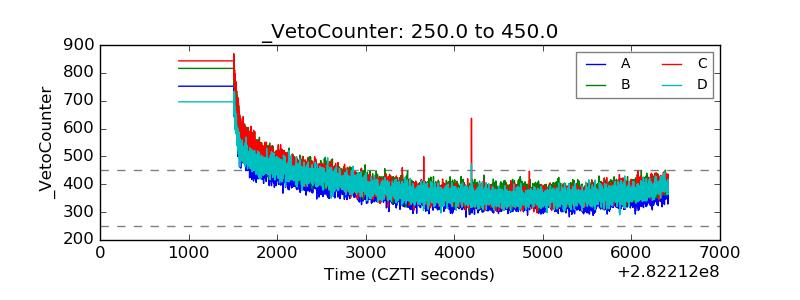 |