| Param | Original file | Final file |
|---|---|---|
| Filename | modeM0/AS1A05_169T01_9000002558_17323cztM0_level2.evt | modeM0/AS1A05_169T01_9000002558_17323cztM0_level2_quad_clean.evt |
| Size (bytes) | 447,661,440 | 67,720,320 |
| Size | 426.9 MB | 64.6 MB |
| Events in quadrant A | 3,241,639 | 409,742 |
| Events in quadrant B | 3,349,218 | 409,614 |
| Events in quadrant C | 3,292,936 | 389,762 |
| Events in quadrant D | 3,235,722 | 391,767 |
| Mode SS | |||
|---|---|---|---|
| Quadrant | BADHDUFLAG | Total packets | Discarded packets |
| A | 0 | 130 | 0 |
| B | 0 | 130 | 0 |
| C | 0 | 130 | 0 |
| D | 0 | 130 | 0 |
| Mode M0 | |||
|---|---|---|---|
| Quadrant | BADHDUFLAG | Total packets | Discarded packets |
| A | 0 | 13875 | 2 |
| B | 0 | 14200 | 2 |
| C | 0 | 14077 | 2 |
| D | 0 | 13967 | 3 |
| Mode M9 | |||
|---|---|---|---|
| Quadrant | BADHDUFLAG | Total packets | Discarded packets |
| A | 0 | 19 | 0 |
| B | 0 | 19 | 0 |
| C | 0 | 19 | 0 |
| D | 0 | 19 | 0 |
| Quadrant | Total seconds | Saturated seconds | Saturation percentage |
|---|---|---|---|
| A | 6447 | 81 | 1.256398% |
| B | 6447 | 111 | 1.721731% |
| C | 6447 | 127 | 1.969908% |
| D | 6446 | 61 | 0.946323% |
Noise dominated data is calculated using 1-second bins in cleaned event files. If a bin has >2000 counts, and if more than 50% of those come from <1% of pixels, then it is considered to be noise-dominated and hence unusable.
| Quadrant | # 1 sec bins | Bins with >0 counts | Bins with >2000 counts | High rate bins dominated by noise | Noise dominated (total time) | Noise dominated (detector-on time) | Marked lightcurve |
|---|---|---|---|---|---|---|---|
| A | 7587 | 6447 | 0 | 0 | 0.00% | 0.00% | 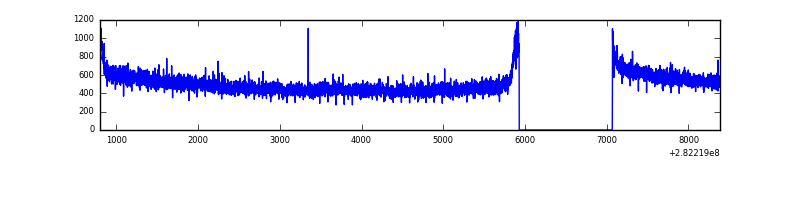 |
| B | 7587 | 6447 | 0 | 0 | 0.00% | 0.00% | 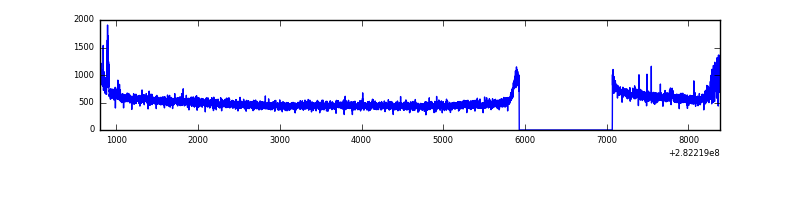 |
| C | 7587 | 6447 | 0 | 0 | 0.00% | 0.00% | 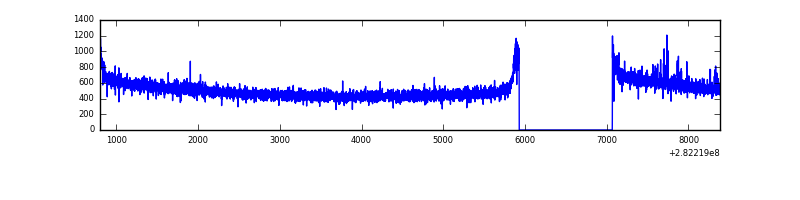 |
| D | 7586 | 6447 | 4 | 4 | 0.05% | 0.06% | 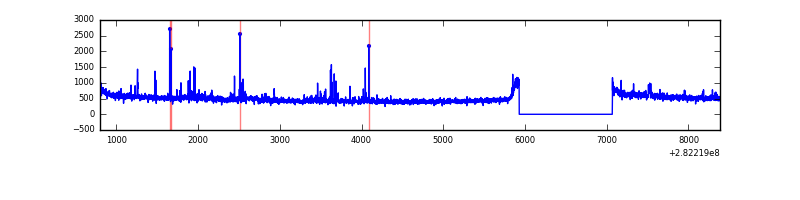 |
Top three noisy pixels from each quadrant. If the there are fewer than three noisy pixels in the level2.evt file, extra rows are filled as -1
| Pixel properties | Quadrant properties | ||||||
|---|---|---|---|---|---|---|---|
| Quadrant | DetID | PixID | Counts | Sigma | Mean | Median | Sigma |
| A | 0 | 226 | 7342 | 38.87 | 843 | 826 | 167.6 |
| A | 3 | 137 | 6149 | 31.75 | 843 | 826 | 167.6 |
| A | 12 | 194 | 5891 | 30.21 | 843 | 826 | 167.6 |
| B | 0 | 230 | 47432 | 297.8 | 837 | 818 | 156.5 |
| B | 4 | 173 | 28205 | 174.97 | 837 | 818 | 156.5 |
| B | 12 | 111 | 19181 | 117.32 | 837 | 818 | 156.5 |
| C | 14 | 238 | 126504 | 675.2 | 804 | 811 | 186.2 |
| C | 3 | 233 | 30968 | 162.0 | 804 | 811 | 186.2 |
| C | 13 | 61 | 5660 | 26.05 | 804 | 811 | 186.2 |
| D | 5 | 222 | 94199 | 472.2 | 814 | 792 | 197.8 |
| D | 2 | 152 | 49666 | 247.07 | 814 | 792 | 197.8 |
| D | 2 | 234 | 24708 | 120.9 | 814 | 792 | 197.8 |
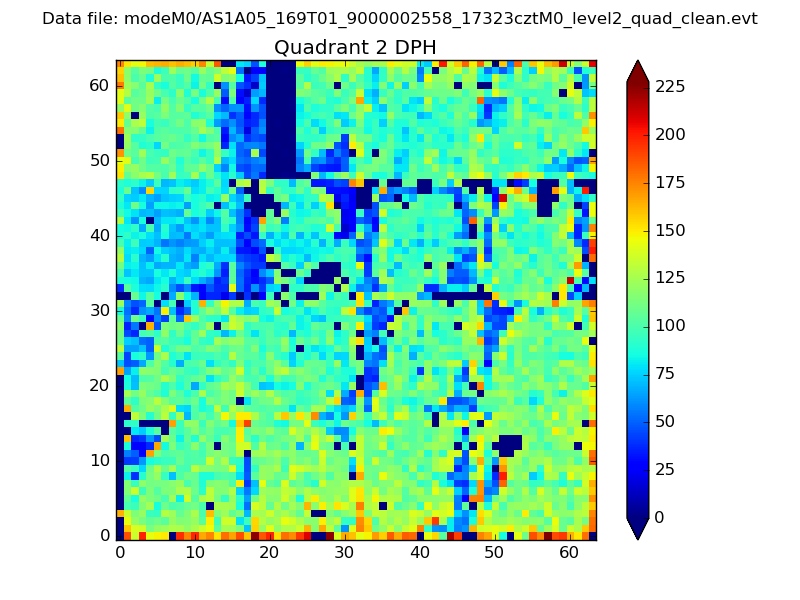
Histogram calculated using DETX and DETY for each event in the final _common_clean file
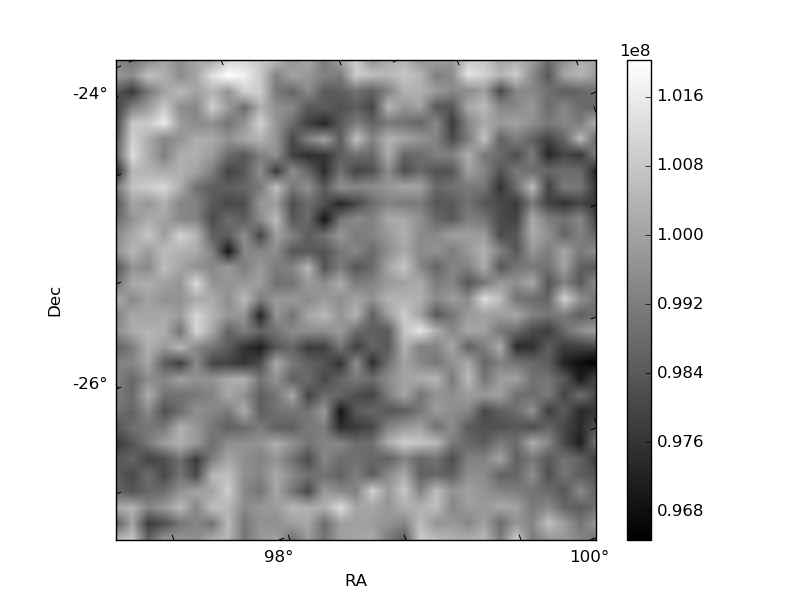
| Quadrant A |  |
 |
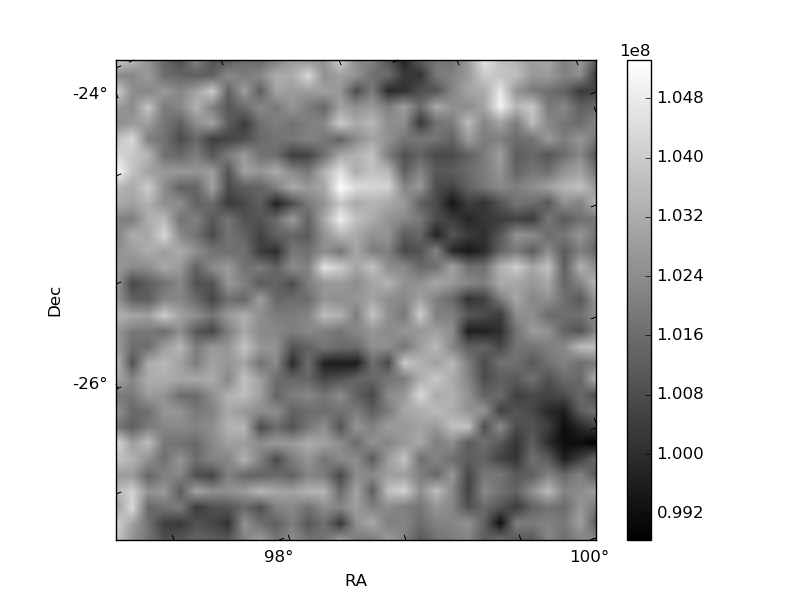
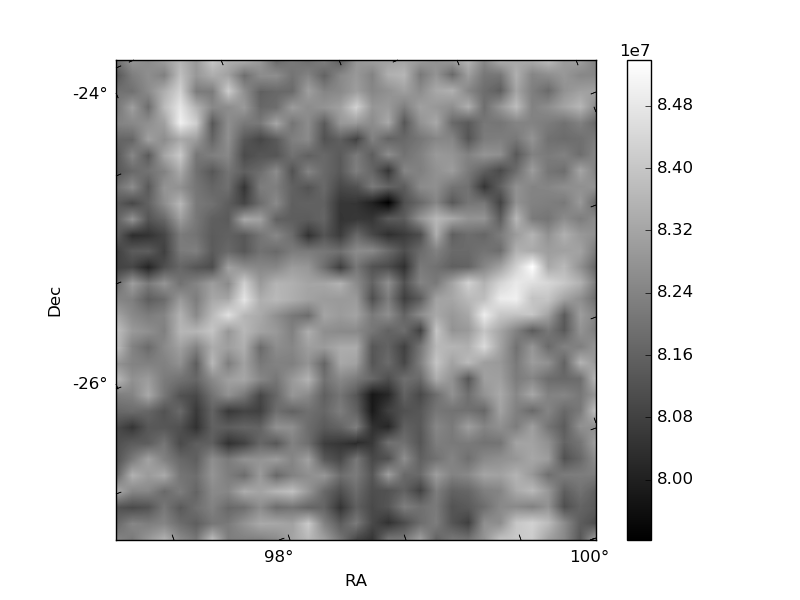
Quadrant B |
|---|---|---|---|
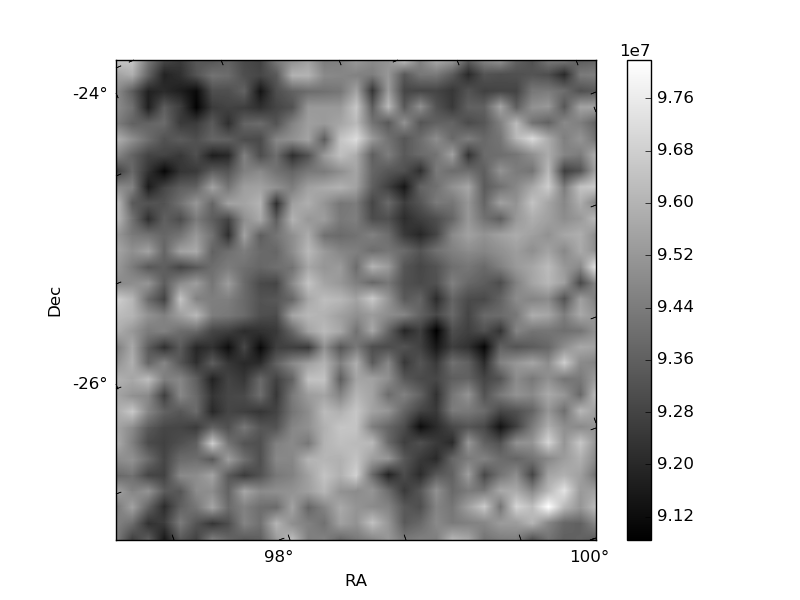
| Quadrant D | 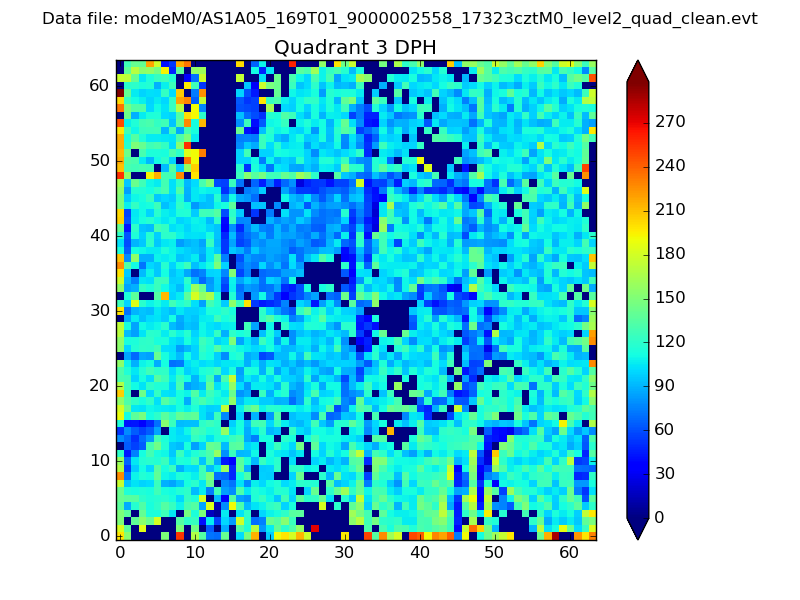 |
 |
Quadrant C |
| Plot type | Count rate plots | Images |
|---|---|---|
| Comparison with Poisson distribution Blue bars denote a histogram of data divided into 1 sec bins. Red curve is a Poisson curve with rate = median count rate of data. |
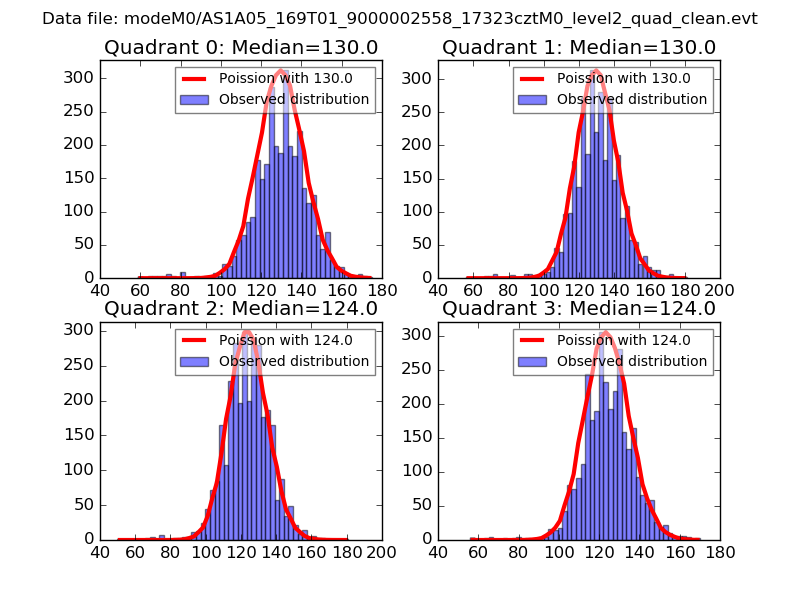 |
 |
| Quadrant-wise count rates Data is divided into 100 sec bins |
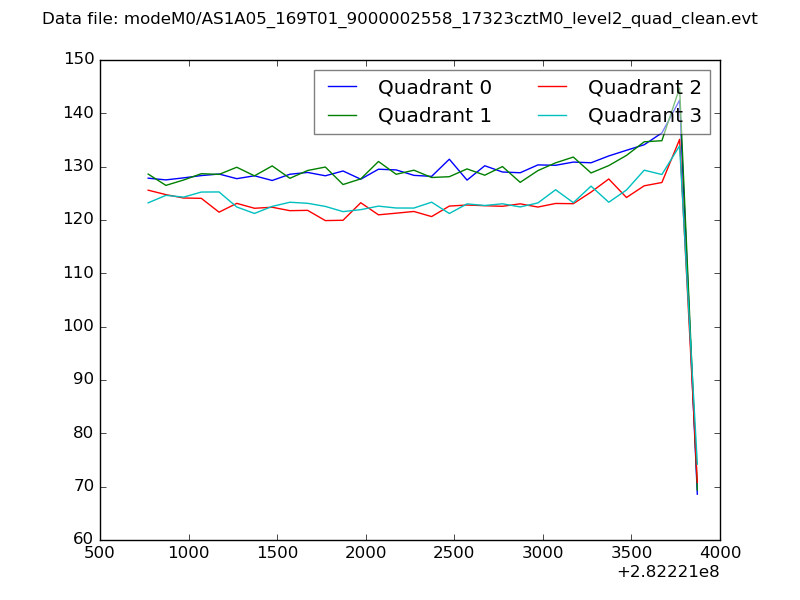 |
|
| Module-wise count rates for Quadrant A Data is divided into 100 sec bins |
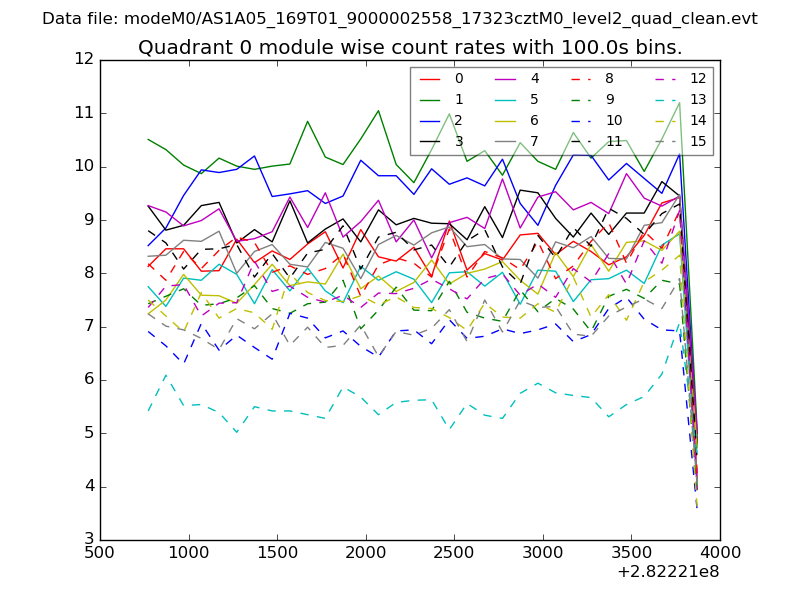 |
 |
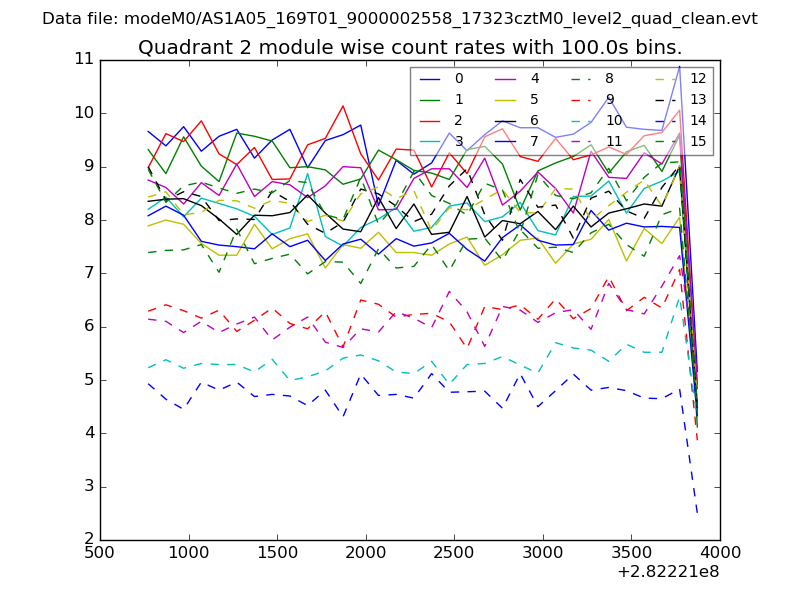
| Module-wise count rates for Quadrant B Data is divided into 100 sec bins |
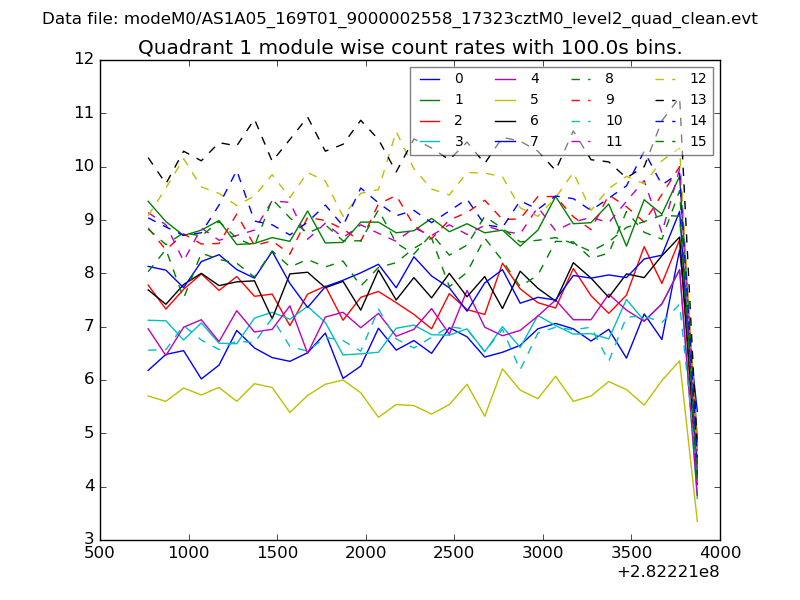 |
 |
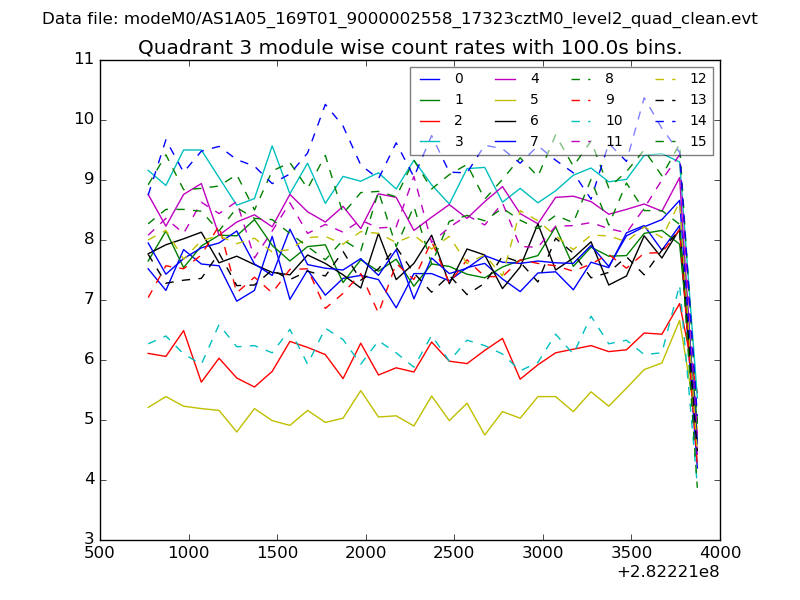
| Module-wise count rates for Quadrant C Data is divided into 100 sec bins |
 |
 |
| Module-wise count rates for Quadrant D Data is divided into 100 sec bins |
 |
 |
| Parameter | Plot |
|---|---|
| CZT HV Monitor | 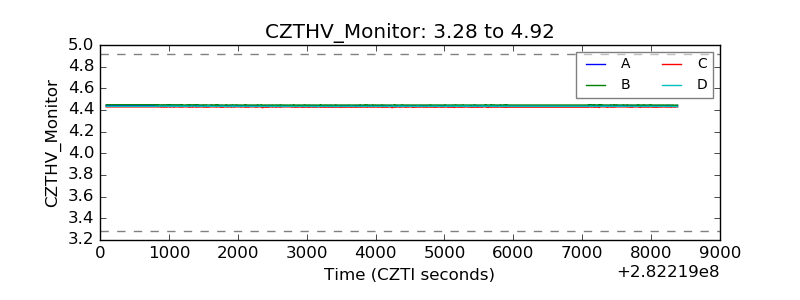 |
| D_VDD | 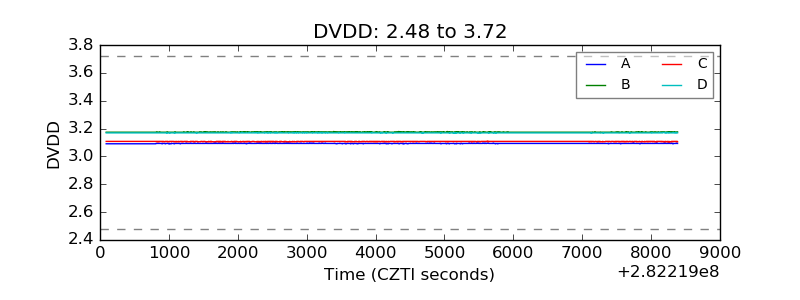 |
| Temperature 1 | 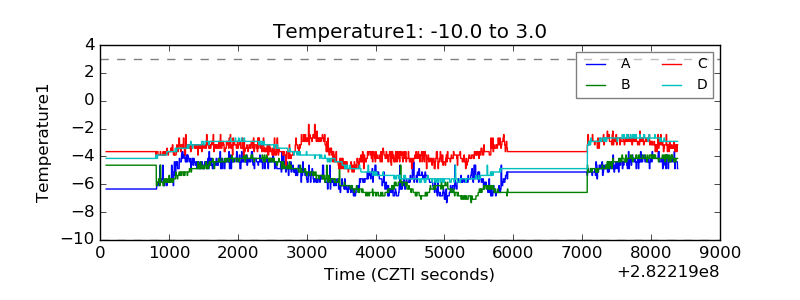 |
| Veto HV Monitor | 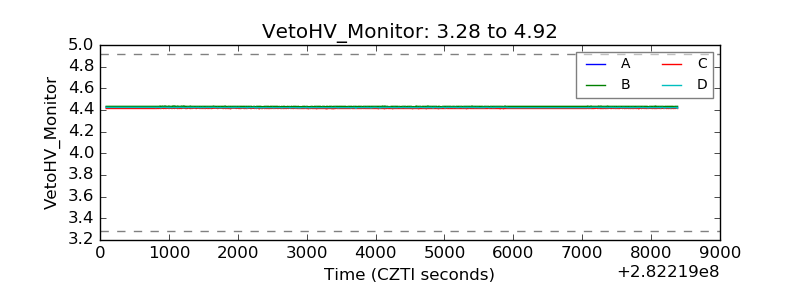 |
| Veto LLD |  |
| Alpha Counter | 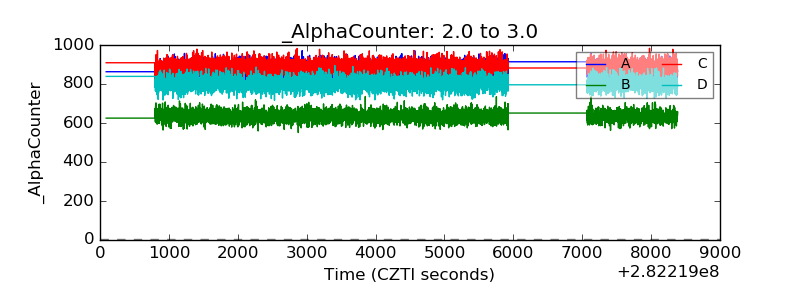 |
| _CPM_Rate | 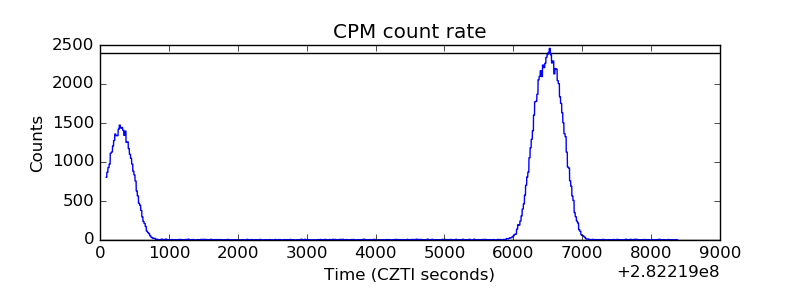 |
| CZT Counter | 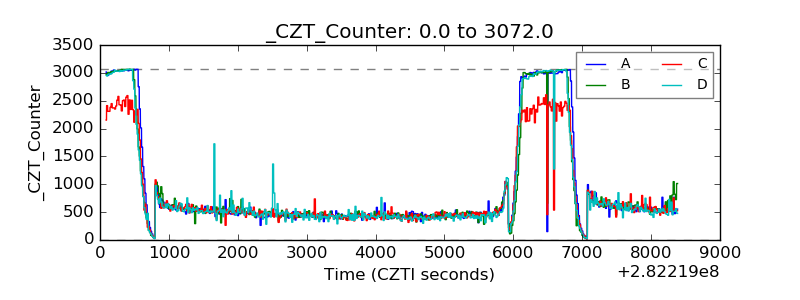 |
| +2.5 Volts monitor |  |
| +5 Volts monitor | 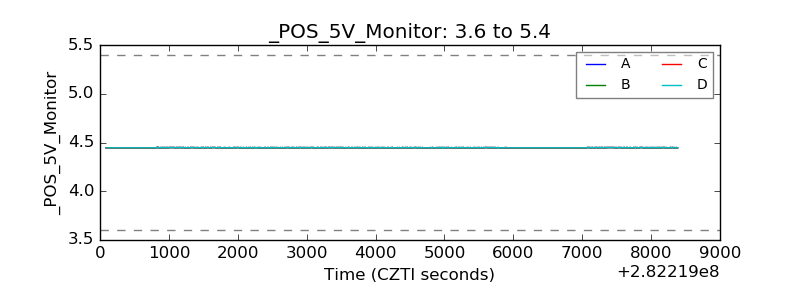 |
| _ROLL_ROT | 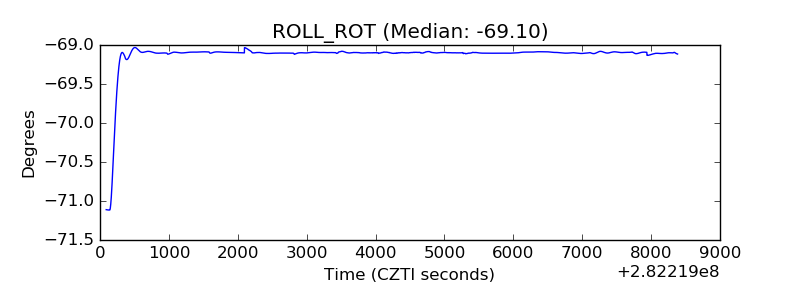 |
| _Roll_DEC | 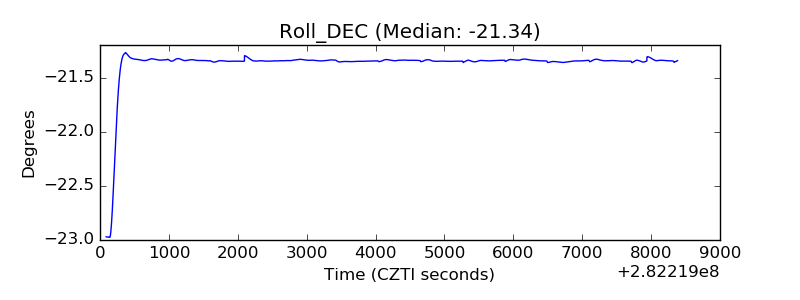 |
| _Roll_RA |  |
| Veto Counter | 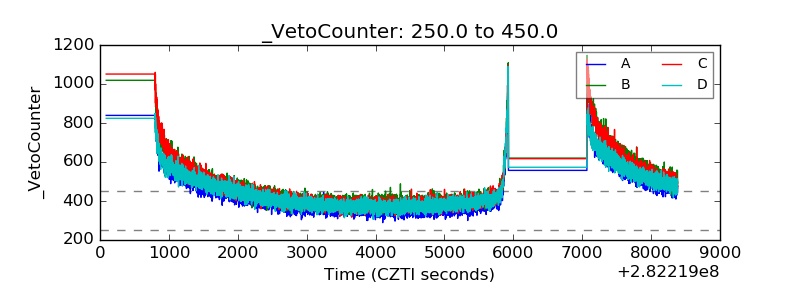 |