| Param | Original file | Final file |
|---|---|---|
| Filename | modeM0/AS1A05_169T01_9000002558_17324cztM0_level2.evt | modeM0/AS1A05_169T01_9000002558_17324cztM0_level2_quad_clean.evt |
| Size (bytes) | 479,410,560 | 84,355,200 |
| Size | 457.2 MB | 80.4 MB |
| Events in quadrant A | 3,461,183 | 538,992 |
| Events in quadrant B | 3,574,869 | 539,388 |
| Events in quadrant C | 3,607,268 | 508,149 |
| Events in quadrant D | 3,428,693 | 509,157 |
| Mode SS | |||
|---|---|---|---|
| Quadrant | BADHDUFLAG | Total packets | Discarded packets |
| A | 0 | 138 | 0 |
| B | 0 | 138 | 0 |
| C | 0 | 138 | 0 |
| D | 0 | 138 | 0 |
| Mode M0 | |||
|---|---|---|---|
| Quadrant | BADHDUFLAG | Total packets | Discarded packets |
| A | 0 | 14604 | 2 |
| B | 0 | 14982 | 2 |
| C | 0 | 15084 | 2 |
| D | 0 | 14582 | 2 |
| Mode M9 | |||
|---|---|---|---|
| Quadrant | BADHDUFLAG | Total packets | Discarded packets |
| A | 0 | 23 | 0 |
| B | 0 | 23 | 0 |
| C | 0 | 23 | 0 |
| D | 0 | 23 | 0 |
| Quadrant | Total seconds | Saturated seconds | Saturation percentage |
|---|---|---|---|
| A | 6570 | 138 | 2.100457% |
| B | 6571 | 169 | 2.571907% |
| C | 6571 | 195 | 2.967585% |
| D | 6571 | 112 | 1.704459% |
Noise dominated data is calculated using 1-second bins in cleaned event files. If a bin has >2000 counts, and if more than 50% of those come from <1% of pixels, then it is considered to be noise-dominated and hence unusable.
| Quadrant | # 1 sec bins | Bins with >0 counts | Bins with >2000 counts | High rate bins dominated by noise | Noise dominated (total time) | Noise dominated (detector-on time) | Marked lightcurve |
|---|---|---|---|---|---|---|---|
| A | 8955 | 6570 | 0 | 0 | 0.00% | 0.00% | 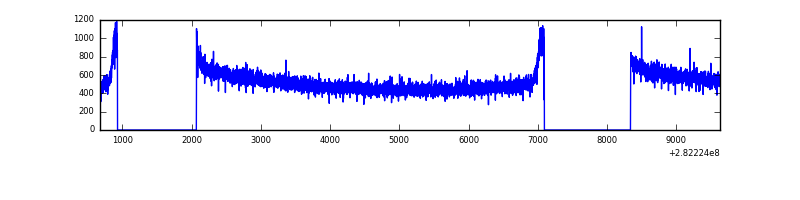 |
| B | 8956 | 6571 | 1 | 1 | 0.01% | 0.02% | 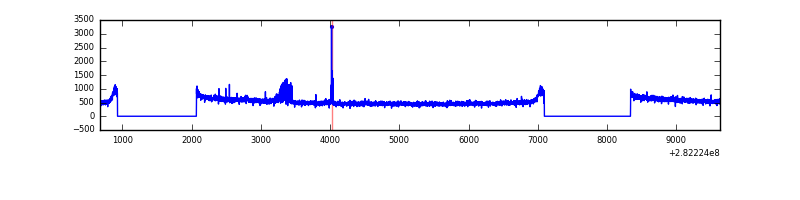 |
| C | 8956 | 6571 | 0 | 0 | 0.00% | 0.00% | 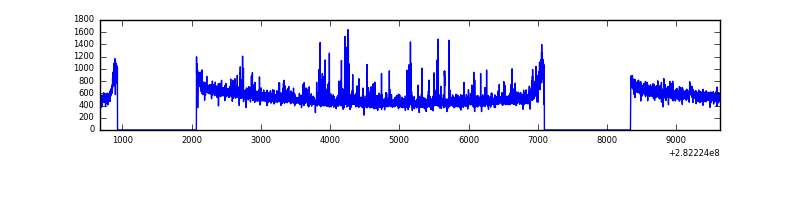 |
| D | 8956 | 6573 | 5 | 5 | 0.06% | 0.08% | 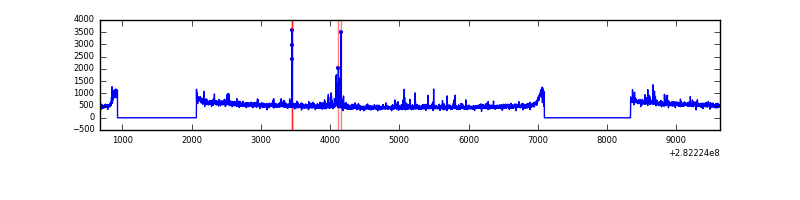 |
Top three noisy pixels from each quadrant. If the there are fewer than three noisy pixels in the level2.evt file, extra rows are filled as -1
| Pixel properties | Quadrant properties | ||||||
|---|---|---|---|---|---|---|---|
| Quadrant | DetID | PixID | Counts | Sigma | Mean | Median | Sigma |
| A | 0 | 226 | 7883 | 38.95 | 900 | 885 | 179.7 |
| A | 3 | 137 | 6589 | 31.74 | 900 | 885 | 179.7 |
| A | 12 | 194 | 6322 | 30.26 | 900 | 885 | 179.7 |
| B | 0 | 230 | 80611 | 477.5 | 894 | 875 | 167.0 |
| B | 12 | 111 | 20128 | 115.3 | 894 | 875 | 167.0 |
| B | 11 | 111 | 17316 | 98.46 | 894 | 875 | 167.0 |
| C | 3 | 233 | 146952 | 740.32 | 852 | 860 | 197.3 |
| C | 14 | 238 | 134049 | 674.94 | 852 | 860 | 197.3 |
| C | 13 | 61 | 6062 | 26.36 | 852 | 860 | 197.3 |
| D | 5 | 222 | 83897 | 397.65 | 865 | 843 | 208.9 |
| D | 2 | 152 | 48560 | 228.46 | 865 | 843 | 208.9 |
| D | 2 | 234 | 23342 | 107.72 | 865 | 843 | 208.9 |
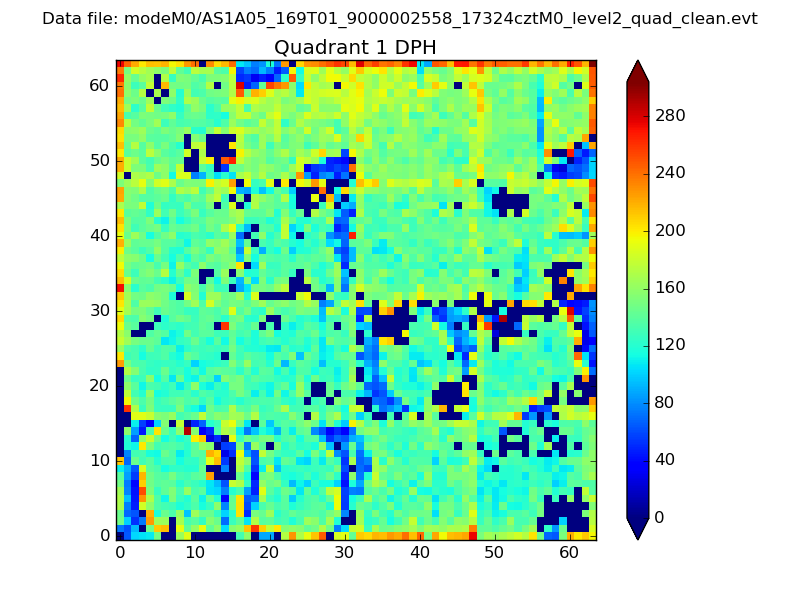
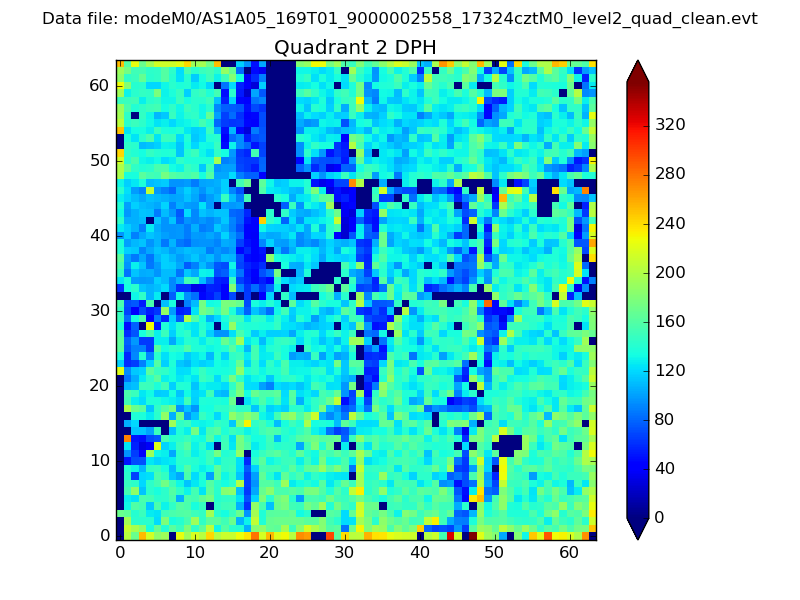
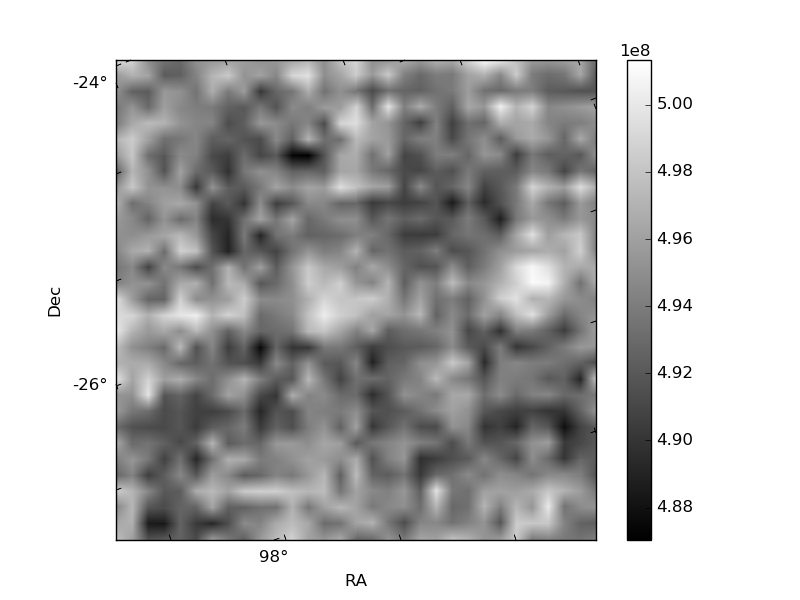
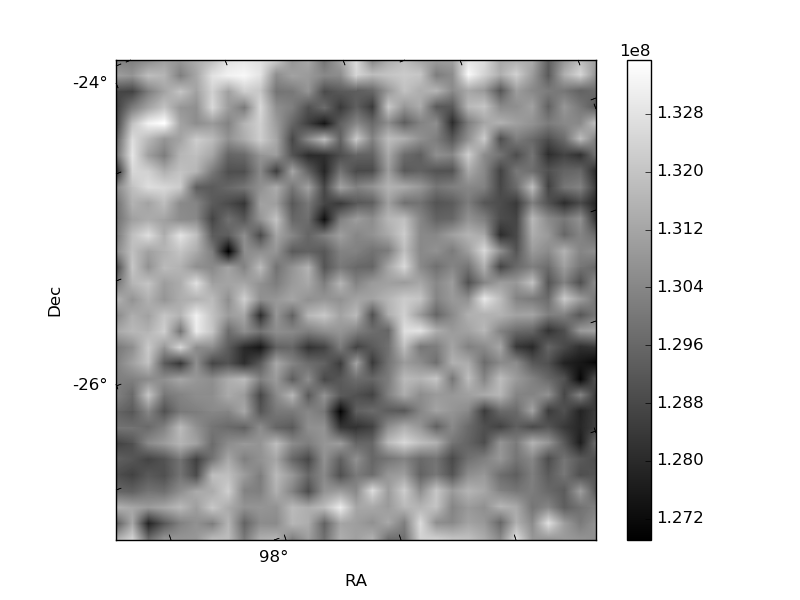
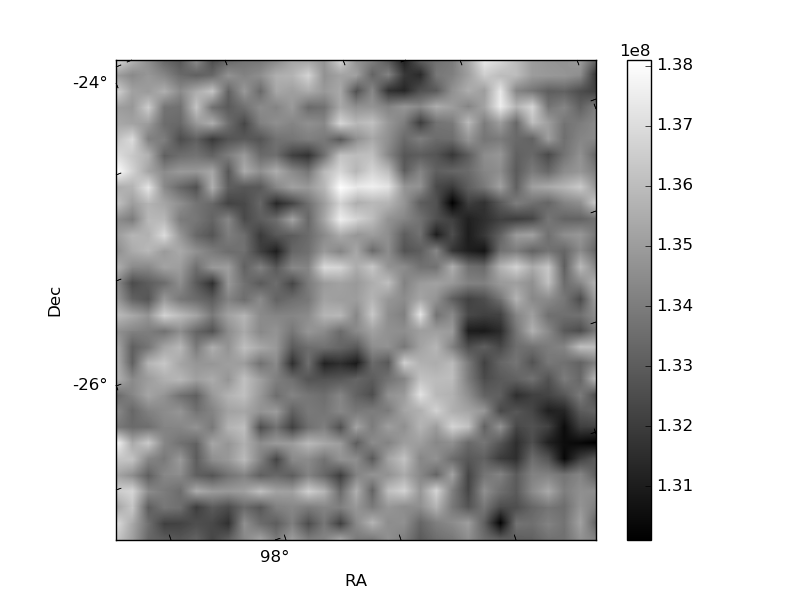
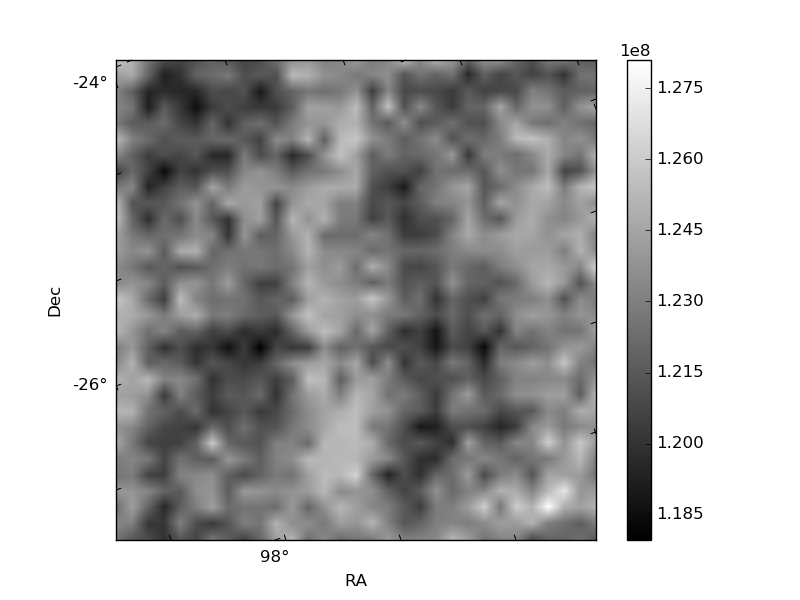
Histogram calculated using DETX and DETY for each event in the final _common_clean file
| Quadrant A |  |
 |
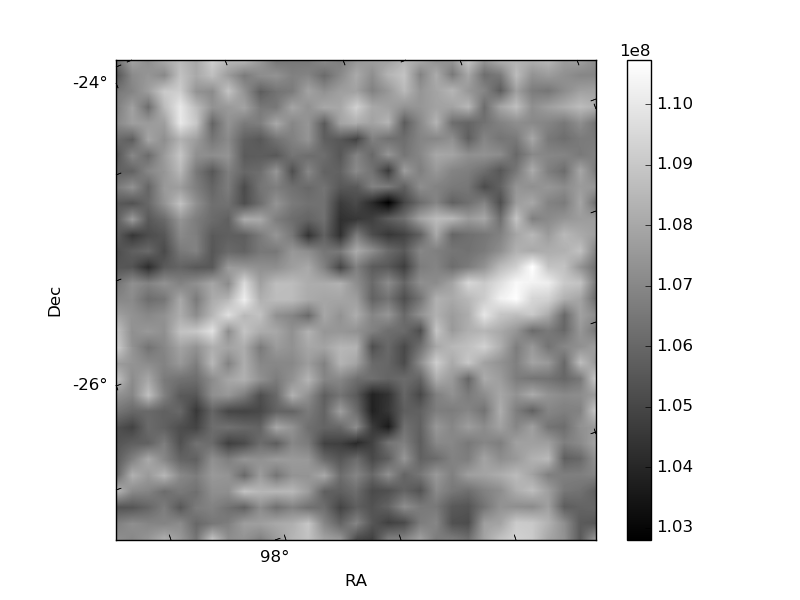
Quadrant B |
|---|---|---|---|
| Quadrant D | 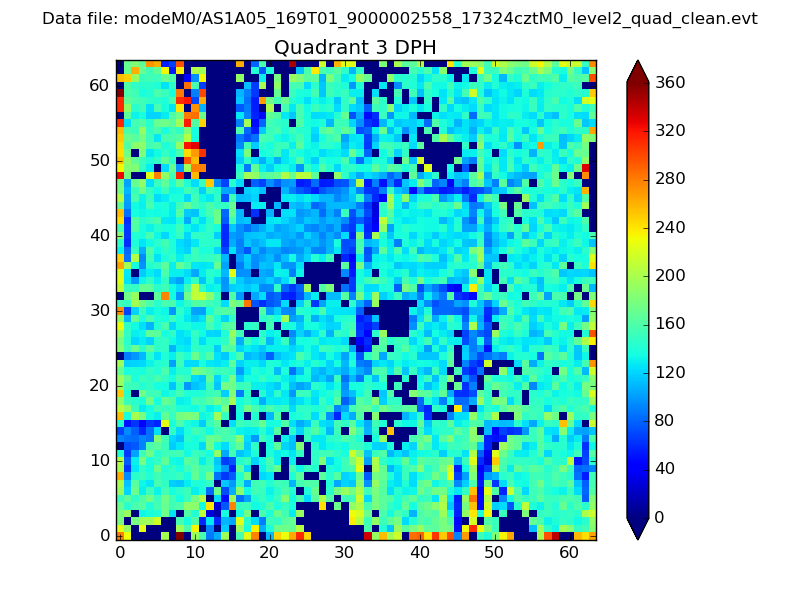 |
 |
Quadrant C |
| Plot type | Count rate plots | Images |
|---|---|---|
| Comparison with Poisson distribution Blue bars denote a histogram of data divided into 1 sec bins. Red curve is a Poisson curve with rate = median count rate of data. |
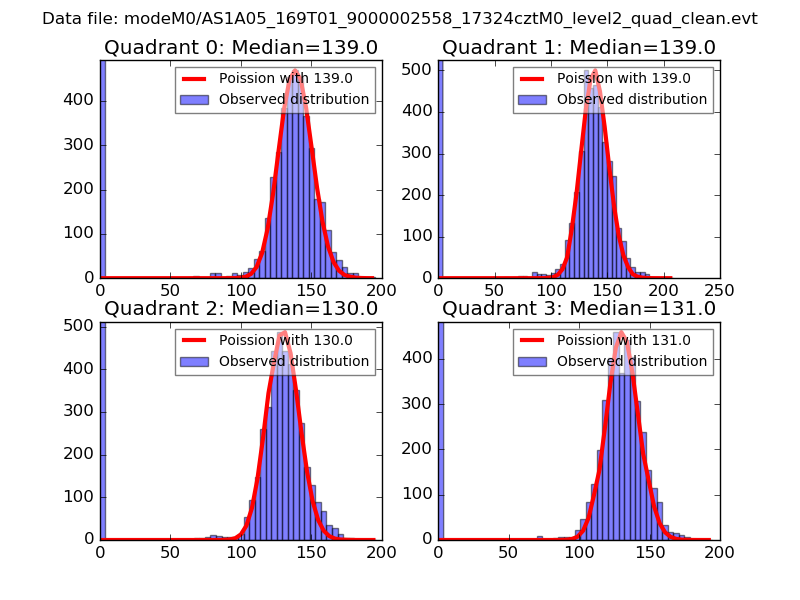 |
 |
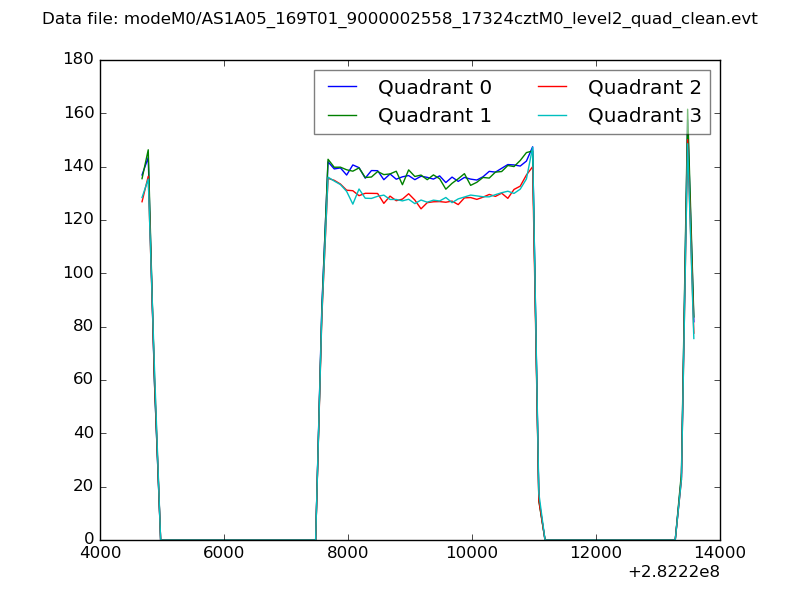
| Quadrant-wise count rates Data is divided into 100 sec bins |
 |
|
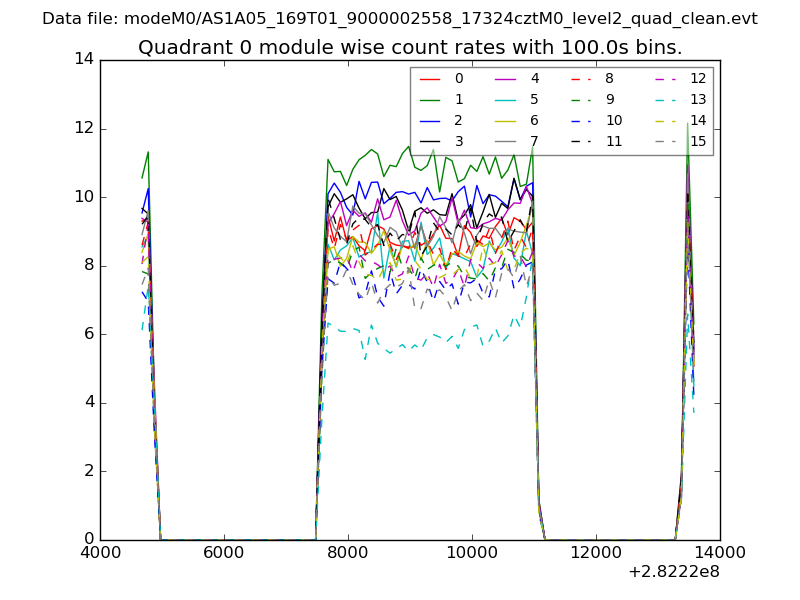
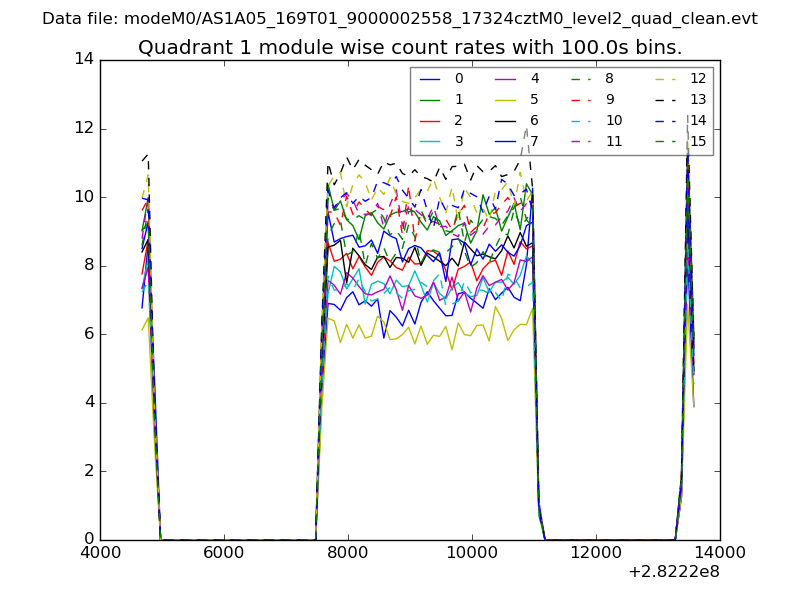
| Module-wise count rates for Quadrant A Data is divided into 100 sec bins |
 |
 |
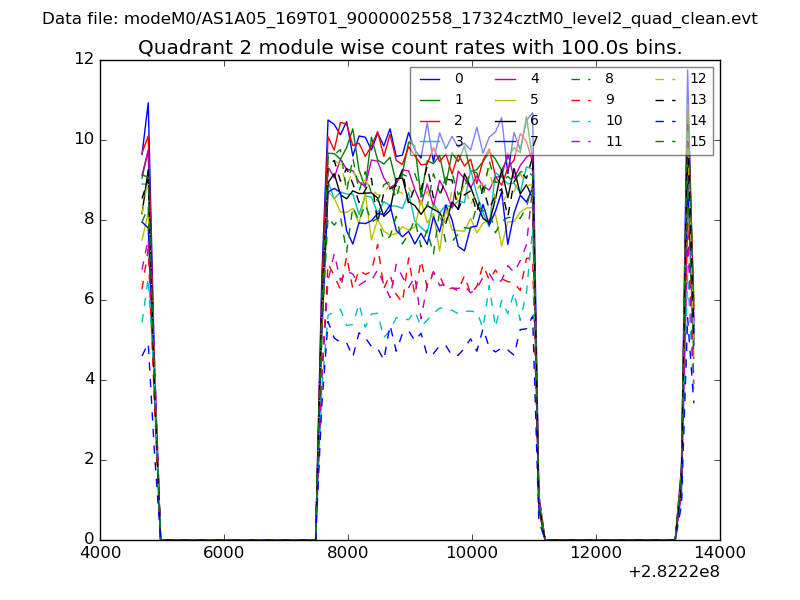
| Module-wise count rates for Quadrant B Data is divided into 100 sec bins |
 |
 |
| Module-wise count rates for Quadrant C Data is divided into 100 sec bins |
 |
 |
| Module-wise count rates for Quadrant D Data is divided into 100 sec bins |
 |
 |
| Parameter | Plot |
|---|---|
| CZT HV Monitor | 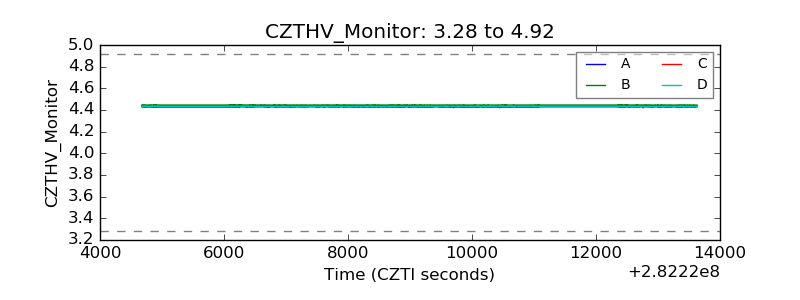 |
| D_VDD | 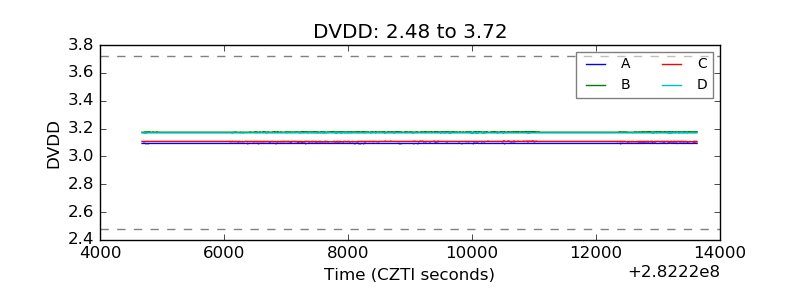 |
| Temperature 1 |  |
| Veto HV Monitor | 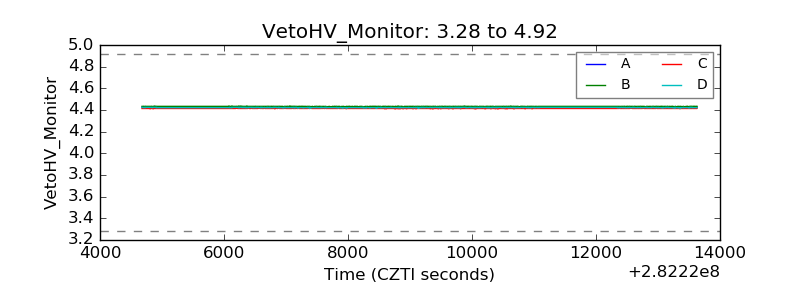 |
| Veto LLD |  |
| Alpha Counter | 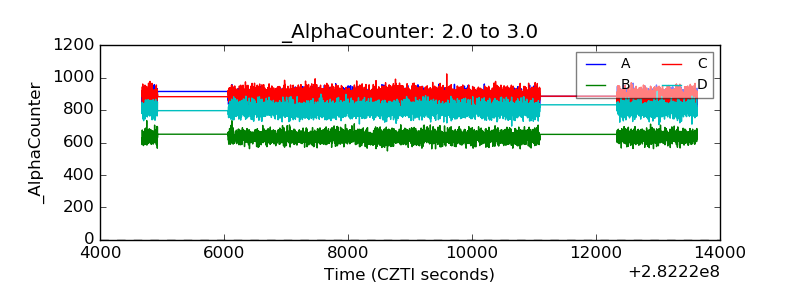 |
| _CPM_Rate | 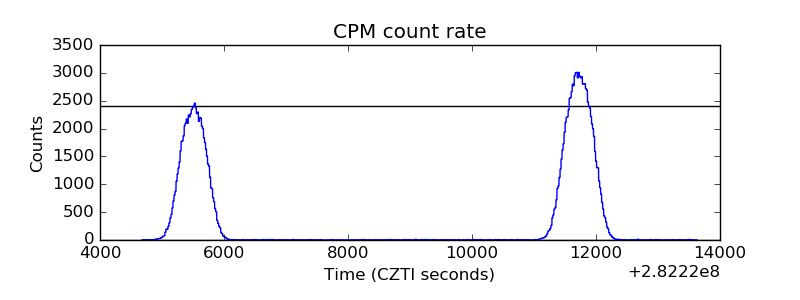 |
| CZT Counter |  |
| +2.5 Volts monitor |  |
| +5 Volts monitor |  |
| _ROLL_ROT |  |
| _Roll_DEC | 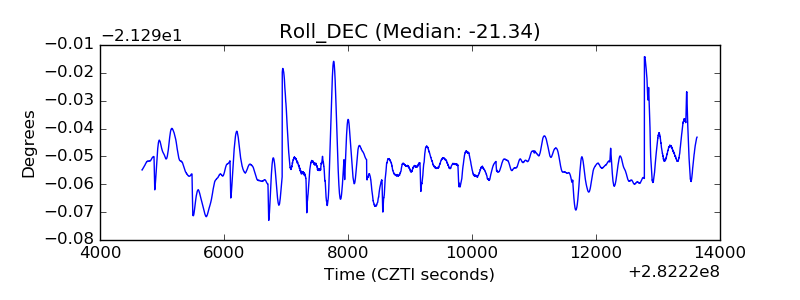 |
| _Roll_RA | 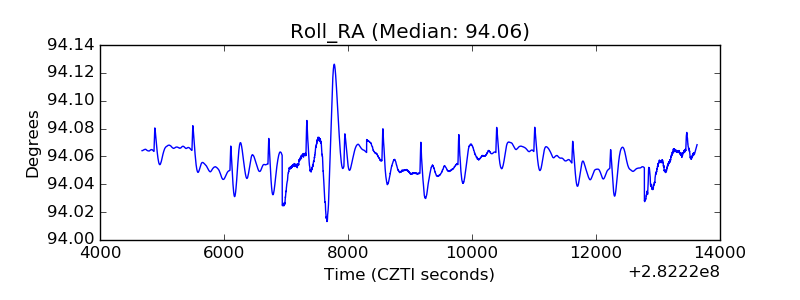 |
| Veto Counter | 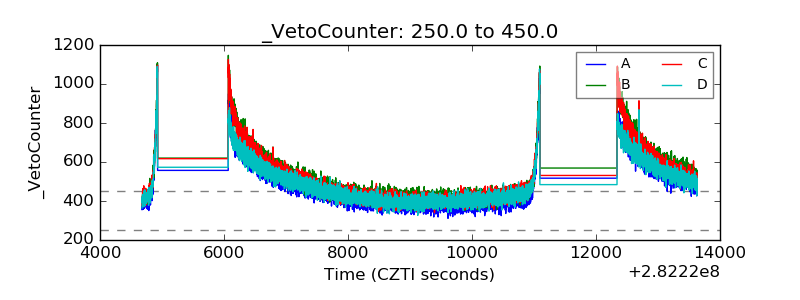 |