| Param | Original file | Final file |
|---|---|---|
| Filename | modeM0/AS1A05_169T01_9000002558_17325cztM0_level2.evt | modeM0/AS1A05_169T01_9000002558_17325cztM0_level2_quad_clean.evt |
| Size (bytes) | 445,250,880 | 90,757,440 |
| Size | 424.6 MB | 86.6 MB |
| Events in quadrant A | 3,225,719 | 598,529 |
| Events in quadrant B | 3,329,975 | 603,933 |
| Events in quadrant C | 3,332,402 | 560,833 |
| Events in quadrant D | 3,180,699 | 557,816 |
| Mode SS | |||
|---|---|---|---|
| Quadrant | BADHDUFLAG | Total packets | Discarded packets |
| A | 0 | 124 | 0 |
| B | 0 | 124 | 0 |
| C | 0 | 124 | 0 |
| D | 0 | 124 | 0 |
| Mode M0 | |||
|---|---|---|---|
| Quadrant | BADHDUFLAG | Total packets | Discarded packets |
| A | 0 | 13531 | 2 |
| B | 0 | 13849 | 2 |
| C | 0 | 13936 | 2 |
| D | 0 | 13435 | 2 |
| Mode M9 | |||
|---|---|---|---|
| Quadrant | BADHDUFLAG | Total packets | Discarded packets |
| A | 0 | 13 | 0 |
| B | 0 | 13 | 0 |
| C | 0 | 13 | 0 |
| D | 0 | 13 | 0 |
| Quadrant | Total seconds | Saturated seconds | Saturation percentage |
|---|---|---|---|
| A | 6121 | 71 | 1.159941% |
| B | 6122 | 91 | 1.486442% |
| C | 6122 | 109 | 1.780464% |
| D | 6122 | 61 | 0.996406% |
Noise dominated data is calculated using 1-second bins in cleaned event files. If a bin has >2000 counts, and if more than 50% of those come from <1% of pixels, then it is considered to be noise-dominated and hence unusable.
| Quadrant | # 1 sec bins | Bins with >0 counts | Bins with >2000 counts | High rate bins dominated by noise | Noise dominated (total time) | Noise dominated (detector-on time) | Marked lightcurve |
|---|---|---|---|---|---|---|---|
| A | 7441 | 6122 | 0 | 0 | 0.00% | 0.00% | 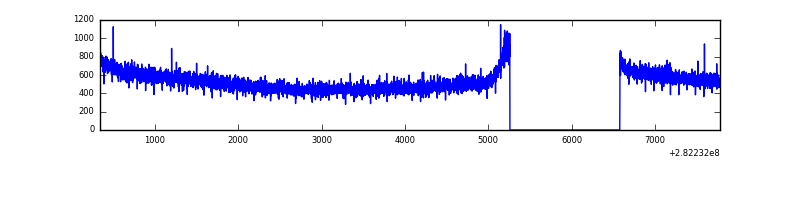 |
| B | 7442 | 6123 | 5 | 5 | 0.07% | 0.08% | 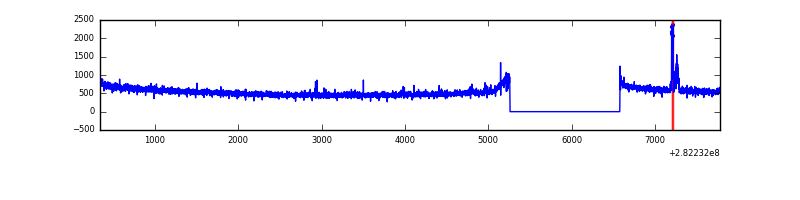 |
| C | 7442 | 6123 | 0 | 0 | 0.00% | 0.00% | 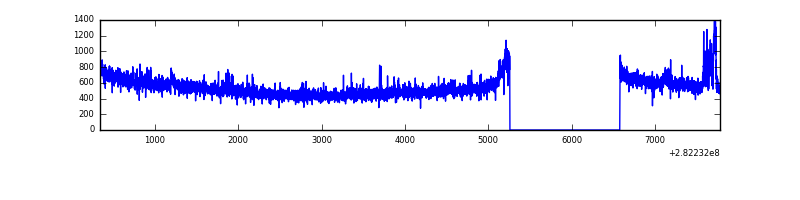 |
| D | 7442 | 6123 | 2 | 2 | 0.03% | 0.03% | 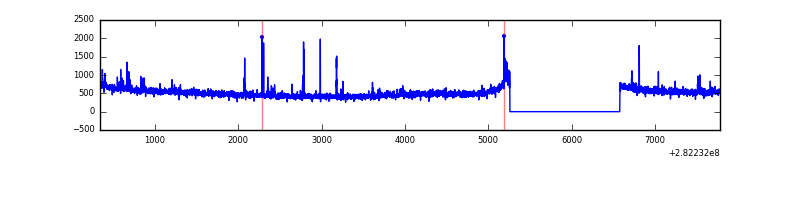 |
Top three noisy pixels from each quadrant. If the there are fewer than three noisy pixels in the level2.evt file, extra rows are filled as -1
| Pixel properties | Quadrant properties | ||||||
|---|---|---|---|---|---|---|---|
| Quadrant | DetID | PixID | Counts | Sigma | Mean | Median | Sigma |
| A | 0 | 226 | 7436 | 39.78 | 839 | 824 | 166.2 |
| A | 3 | 137 | 5997 | 31.12 | 839 | 824 | 166.2 |
| A | 12 | 194 | 5991 | 31.08 | 839 | 824 | 166.2 |
| B | 15 | 201 | 54260 | 342.56 | 837 | 819 | 156.0 |
| B | 12 | 111 | 18280 | 111.93 | 837 | 819 | 156.0 |
| B | 11 | 111 | 16027 | 97.49 | 837 | 819 | 156.0 |
| C | 14 | 238 | 126188 | 682.54 | 792 | 801 | 183.7 |
| C | 9 | 54 | 75689 | 407.65 | 792 | 801 | 183.7 |
| C | 3 | 233 | 41614 | 222.16 | 792 | 801 | 183.7 |
| D | 5 | 222 | 100077 | 517.99 | 798 | 779 | 191.7 |
| D | 13 | 238 | 22298 | 112.25 | 798 | 779 | 191.7 |
| D | 2 | 234 | 21990 | 110.65 | 798 | 779 | 191.7 |
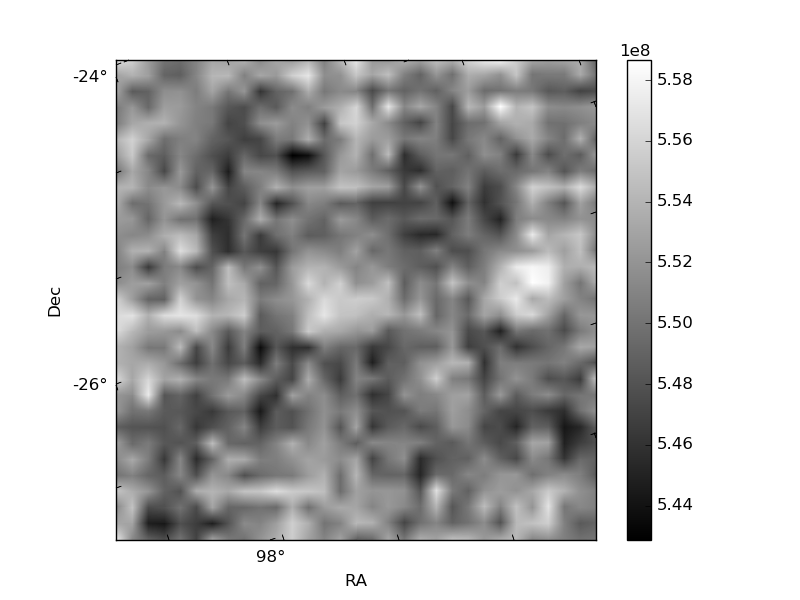
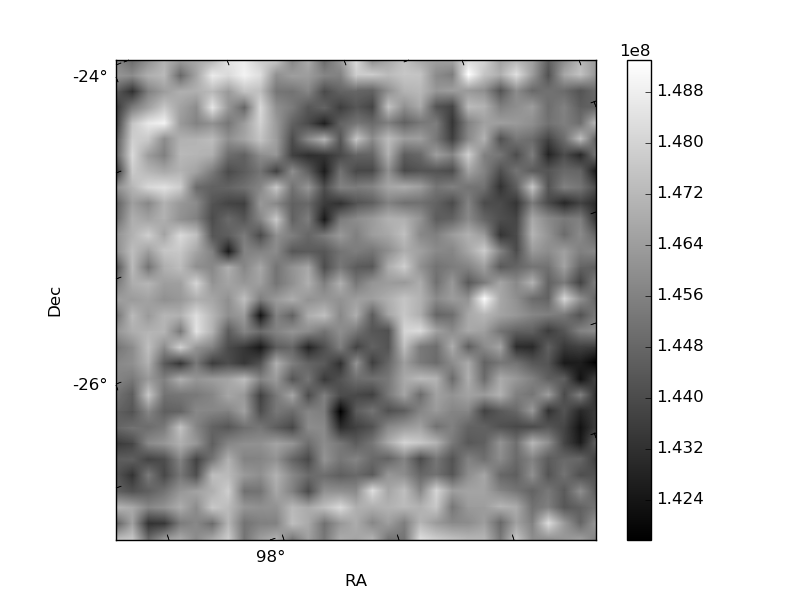
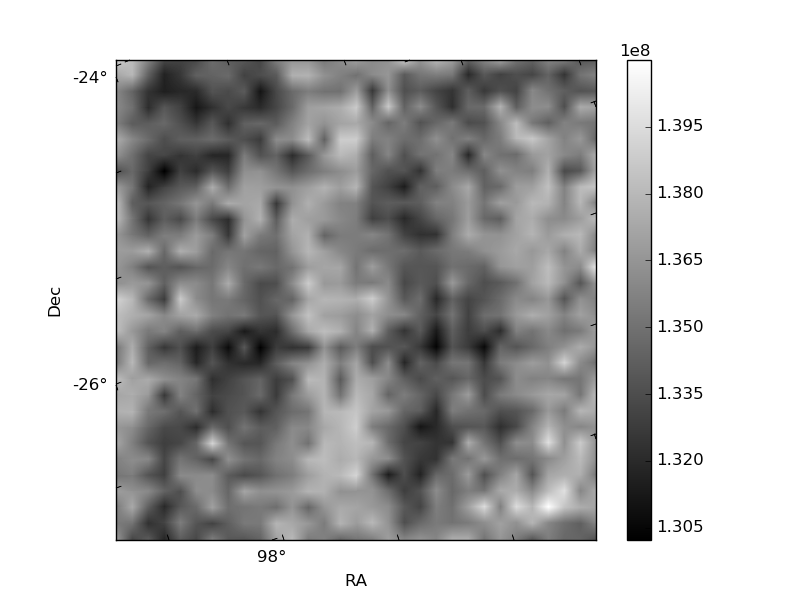
Histogram calculated using DETX and DETY for each event in the final _common_clean file
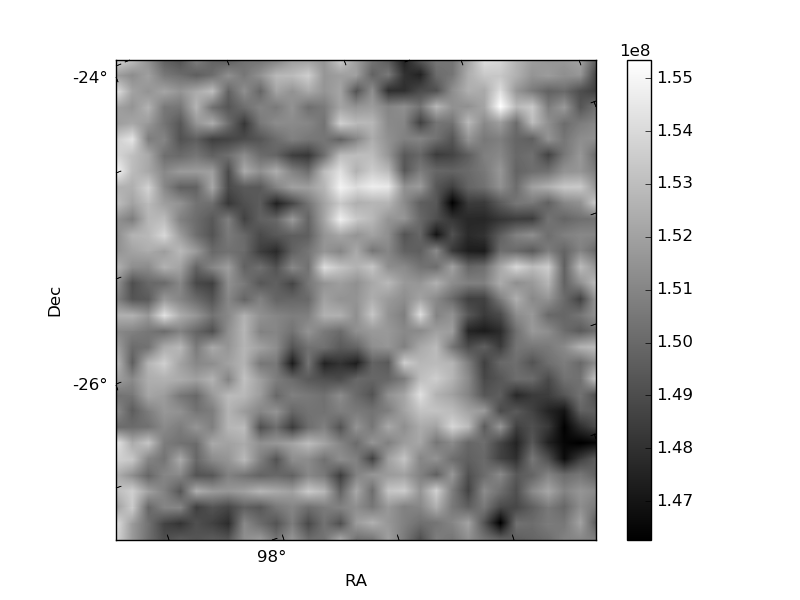
| Quadrant A |  |
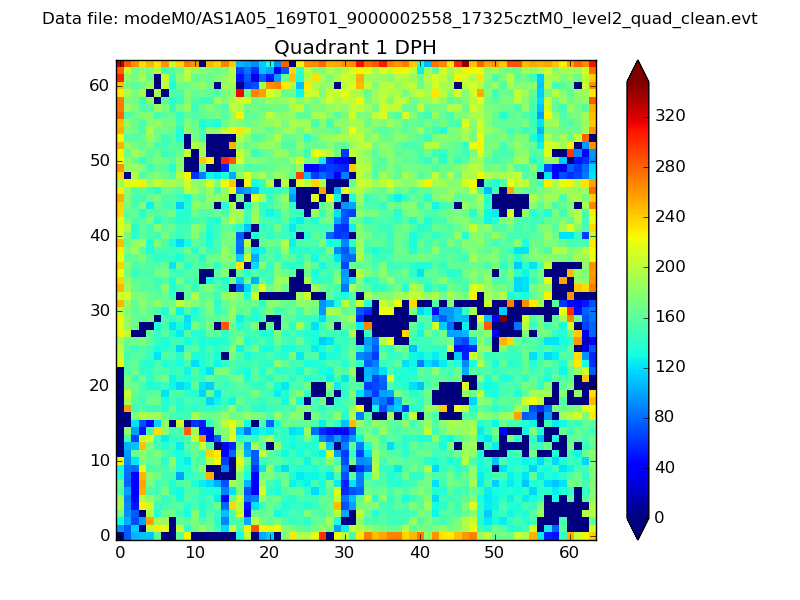 |
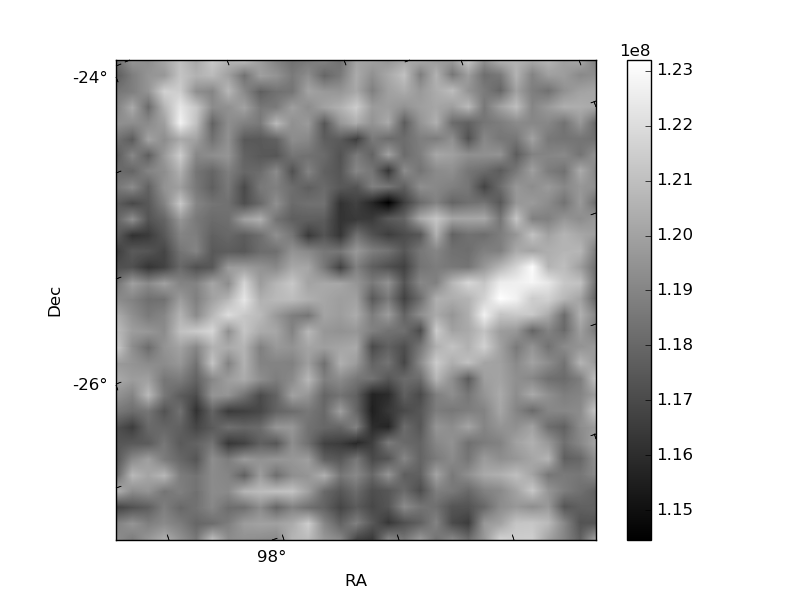
Quadrant B |
|---|---|---|---|
| Quadrant D | 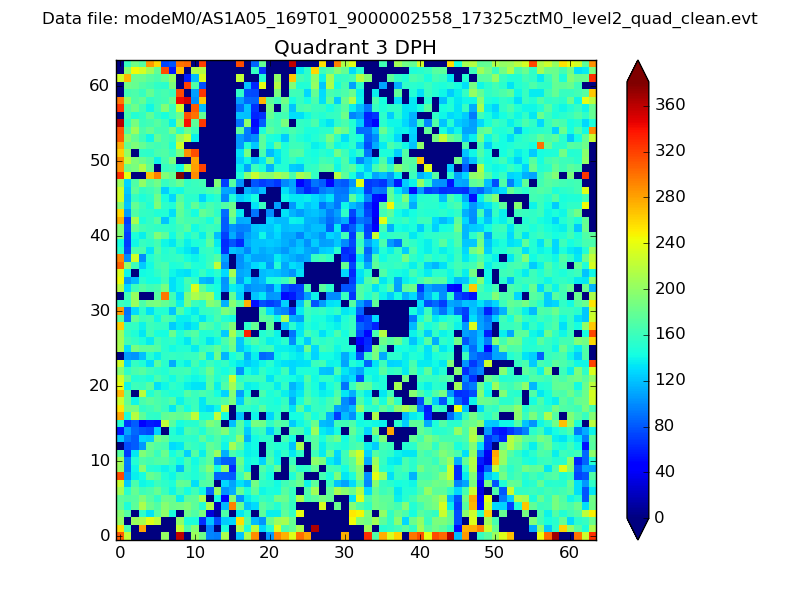 |
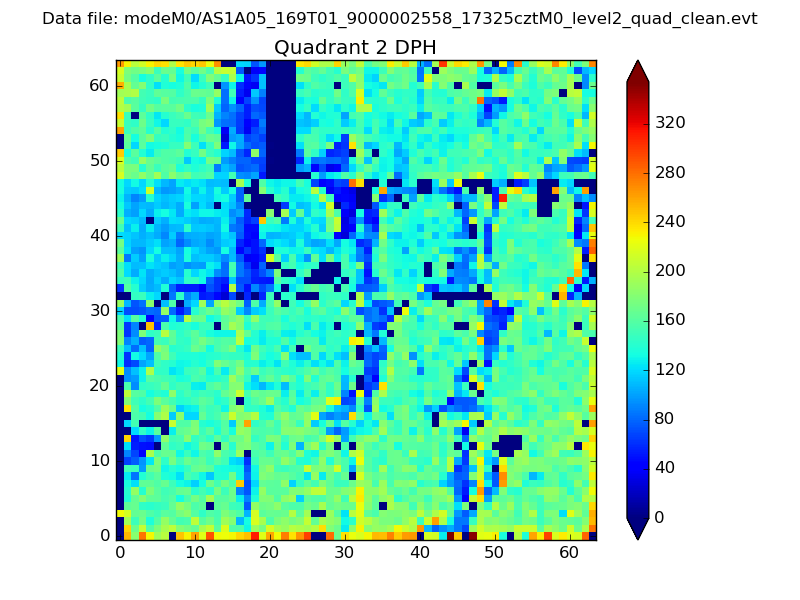 |
Quadrant C |
| Plot type | Count rate plots | Images |
|---|---|---|
| Comparison with Poisson distribution Blue bars denote a histogram of data divided into 1 sec bins. Red curve is a Poisson curve with rate = median count rate of data. |
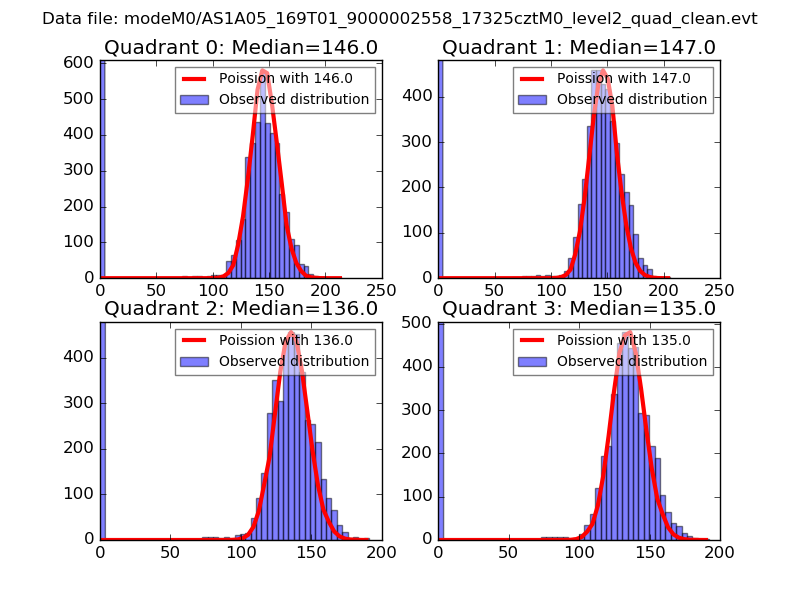 |
 |
| Quadrant-wise count rates Data is divided into 100 sec bins |
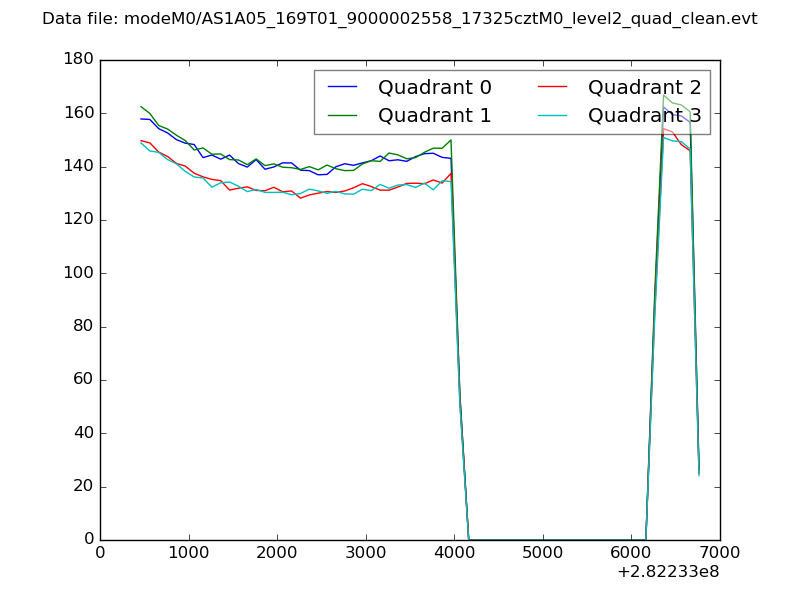 |
|
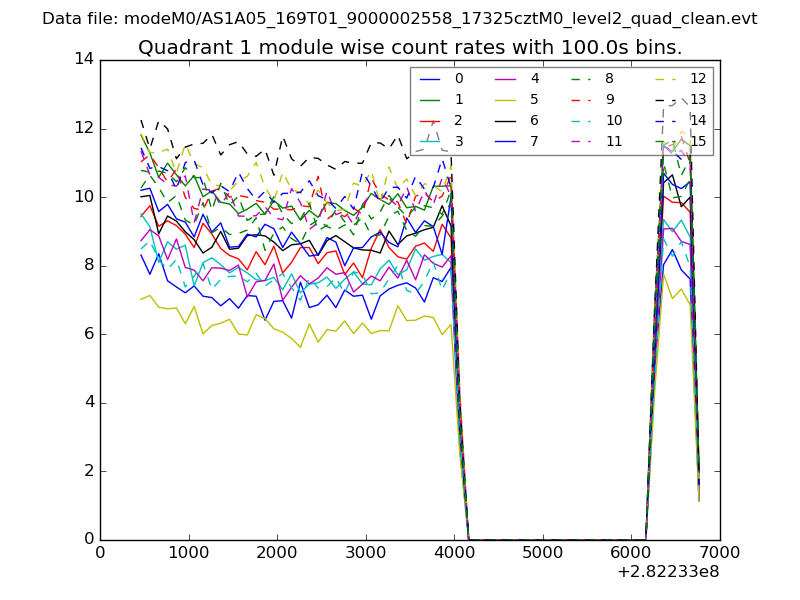
| Module-wise count rates for Quadrant A Data is divided into 100 sec bins |
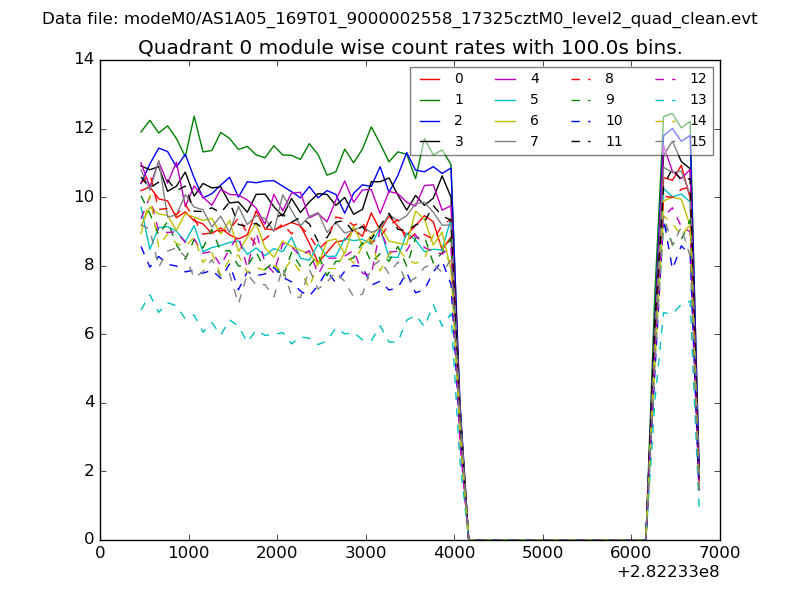 |
 |
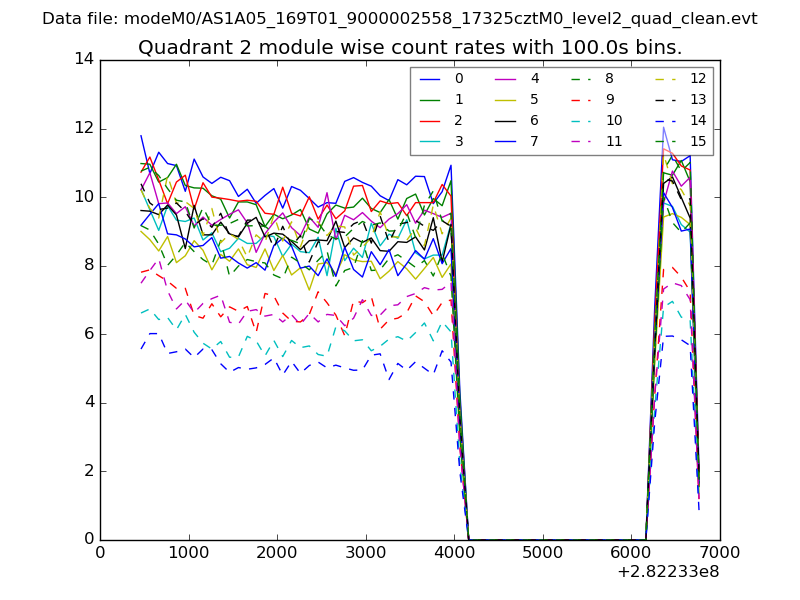
| Module-wise count rates for Quadrant B Data is divided into 100 sec bins |
 |
 |
| Module-wise count rates for Quadrant C Data is divided into 100 sec bins |
 |
 |
| Module-wise count rates for Quadrant D Data is divided into 100 sec bins |
 |
 |
| Parameter | Plot |
|---|---|
| CZT HV Monitor | 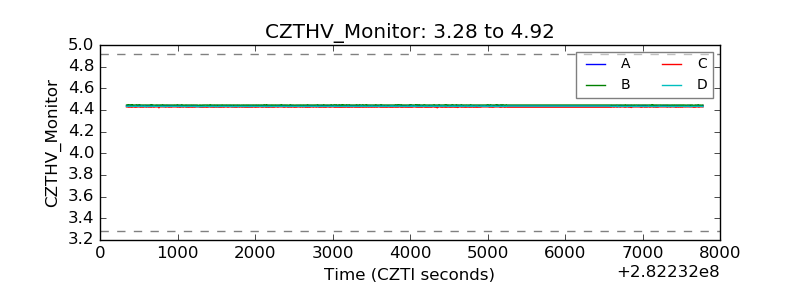 |
| D_VDD | 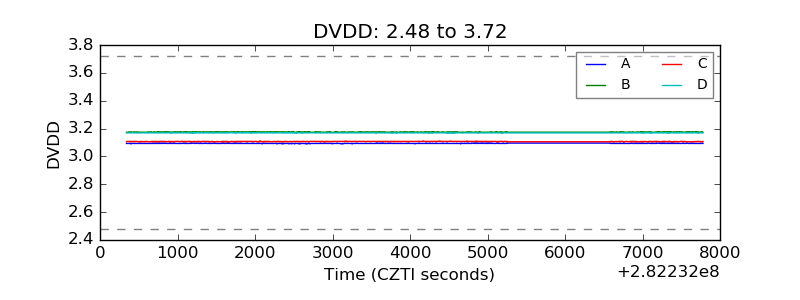 |
| Temperature 1 |  |
| Veto HV Monitor | 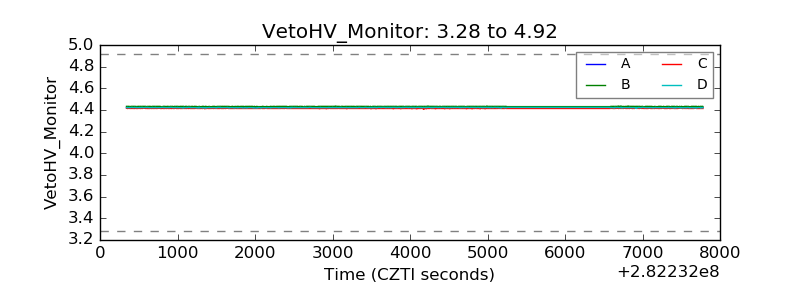 |
| Veto LLD | 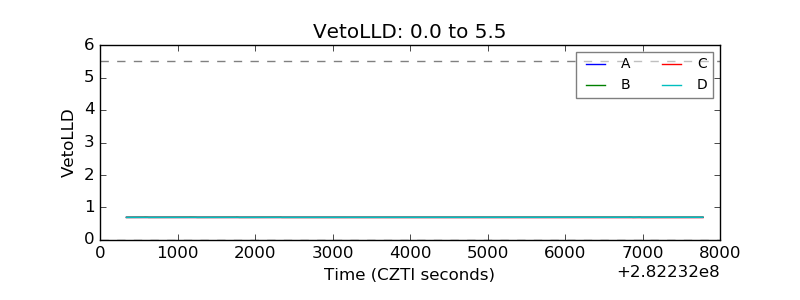 |
| Alpha Counter | 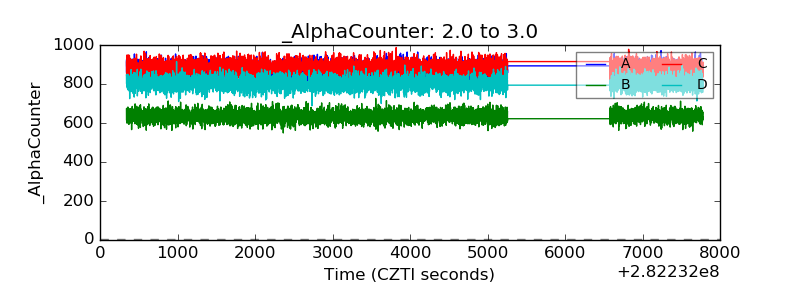 |
| _CPM_Rate | 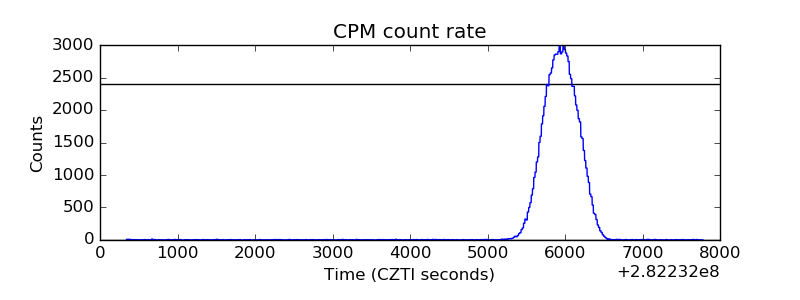 |
| CZT Counter |  |
| +2.5 Volts monitor |  |
| +5 Volts monitor |  |
| _ROLL_ROT |  |
| _Roll_DEC | 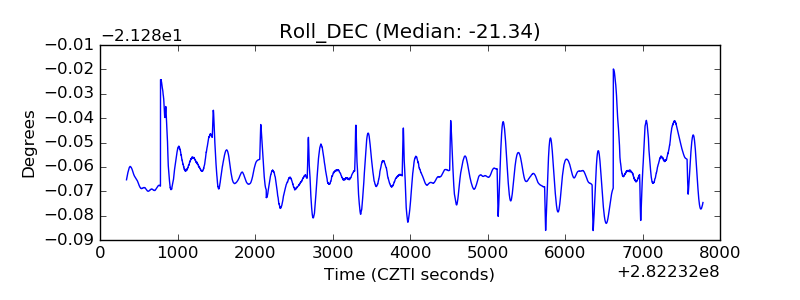 |
| _Roll_RA | 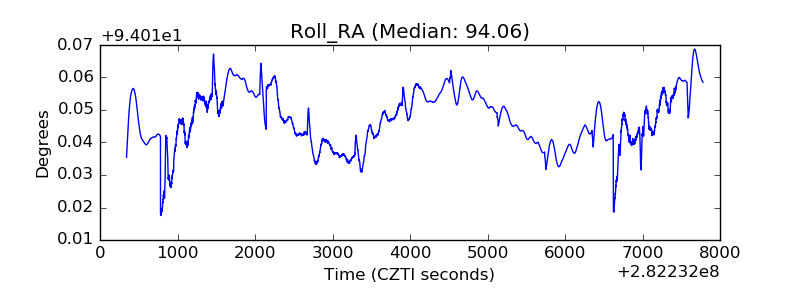 |
| Veto Counter | 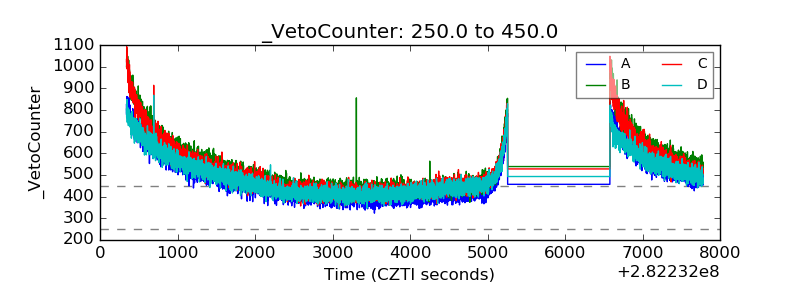 |