| Param | Original file | Final file |
|---|---|---|
| Filename | modeM0/AS1A05_169T01_9000002558_17327cztM0_level2.evt | modeM0/AS1A05_169T01_9000002558_17327cztM0_level2_quad_clean.evt |
| Size (bytes) | 706,939,200 | 178,246,080 |
| Size | 674.2 MB | 170.0 MB |
| Events in quadrant A | 5,088,601 | 1,202,295 |
| Events in quadrant B | 5,211,982 | 1,219,752 |
| Events in quadrant C | 5,148,174 | 1,131,882 |
| Events in quadrant D | 5,247,458 | 1,116,385 |
| Mode SS | |||
|---|---|---|---|
| Quadrant | BADHDUFLAG | Total packets | Discarded packets |
| A | 0 | 216 | 0 |
| B | 0 | 216 | 0 |
| C | 0 | 216 | 0 |
| D | 0 | 216 | 0 |
| Mode M0 | |||
|---|---|---|---|
| Quadrant | BADHDUFLAG | Total packets | Discarded packets |
| A | 0 | 21911 | 2 |
| B | 0 | 22118 | 2 |
| C | 0 | 22009 | 2 |
| D | 0 | 22876 | 4 |
| Mode M9 | |||
|---|---|---|---|
| Quadrant | BADHDUFLAG | Total packets | Discarded packets |
| A | 0 | 25 | 0 |
| B | 0 | 25 | 0 |
| C | 0 | 25 | 0 |
| D | 0 | 25 | 0 |
| Quadrant | Total seconds | Saturated seconds | Saturation percentage |
|---|---|---|---|
| A | 10519 | 98 | 0.931647% |
| B | 10520 | 160 | 1.520913% |
| C | 10520 | 166 | 1.577947% |
| D | 10519 | 79 | 0.751022% |
Noise dominated data is calculated using 1-second bins in cleaned event files. If a bin has >2000 counts, and if more than 50% of those come from <1% of pixels, then it is considered to be noise-dominated and hence unusable.
| Quadrant | # 1 sec bins | Bins with >0 counts | Bins with >2000 counts | High rate bins dominated by noise | Noise dominated (total time) | Noise dominated (detector-on time) | Marked lightcurve |
|---|---|---|---|---|---|---|---|
| A | 13049 | 10521 | 0 | 0 | 0.00% | 0.00% | 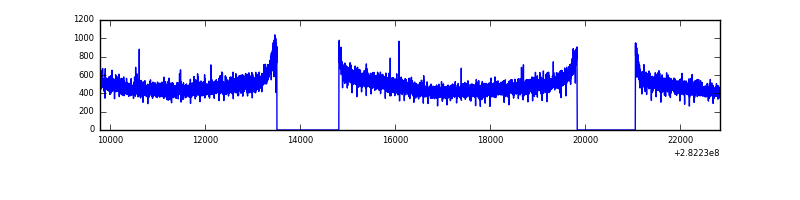 |
| B | 13050 | 10522 | 0 | 0 | 0.00% | 0.00% | 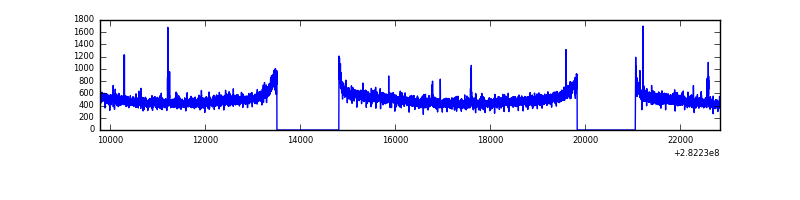 |
| C | 13050 | 10522 | 0 | 0 | 0.00% | 0.00% | 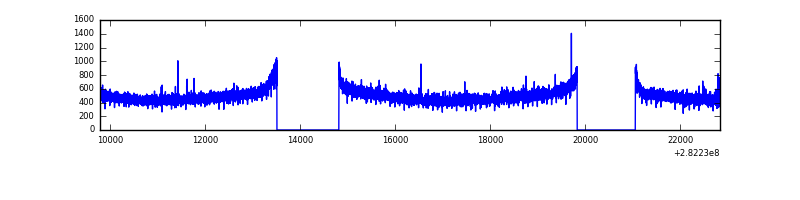 |
| D | 13050 | 10522 | 14 | 14 | 0.11% | 0.13% | 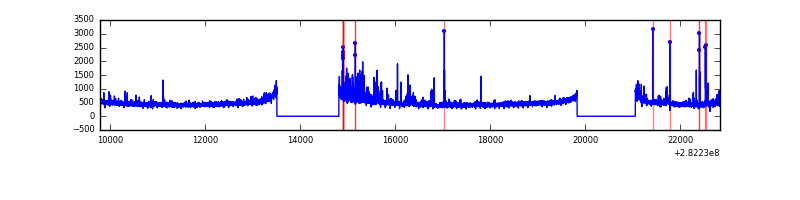 |
Top three noisy pixels from each quadrant. If the there are fewer than three noisy pixels in the level2.evt file, extra rows are filled as -1
| Pixel properties | Quadrant properties | ||||||
|---|---|---|---|---|---|---|---|
| Quadrant | DetID | PixID | Counts | Sigma | Mean | Median | Sigma |
| A | 0 | 226 | 11429 | 38.6 | 1324 | 1303 | 262.3 |
| A | 3 | 137 | 9825 | 32.48 | 1324 | 1303 | 262.3 |
| A | 12 | 194 | 9310 | 30.52 | 1324 | 1303 | 262.3 |
| B | 12 | 111 | 30039 | 115.41 | 1324 | 1293 | 249.1 |
| B | 4 | 173 | 29365 | 112.7 | 1324 | 1293 | 249.1 |
| B | 11 | 111 | 26124 | 99.69 | 1324 | 1293 | 249.1 |
| C | 14 | 238 | 197769 | 671.54 | 1258 | 1270 | 292.6 |
| C | 3 | 233 | 48869 | 162.67 | 1258 | 1270 | 292.6 |
| C | 13 | 61 | 9058 | 26.61 | 1258 | 1270 | 292.6 |
| D | 1 | 52 | 212764 | 704.3 | 1261 | 1228 | 300.4 |
| D | 5 | 222 | 187037 | 618.64 | 1261 | 1228 | 300.4 |
| D | 1 | 20 | 39972 | 129.0 | 1261 | 1228 | 300.4 |
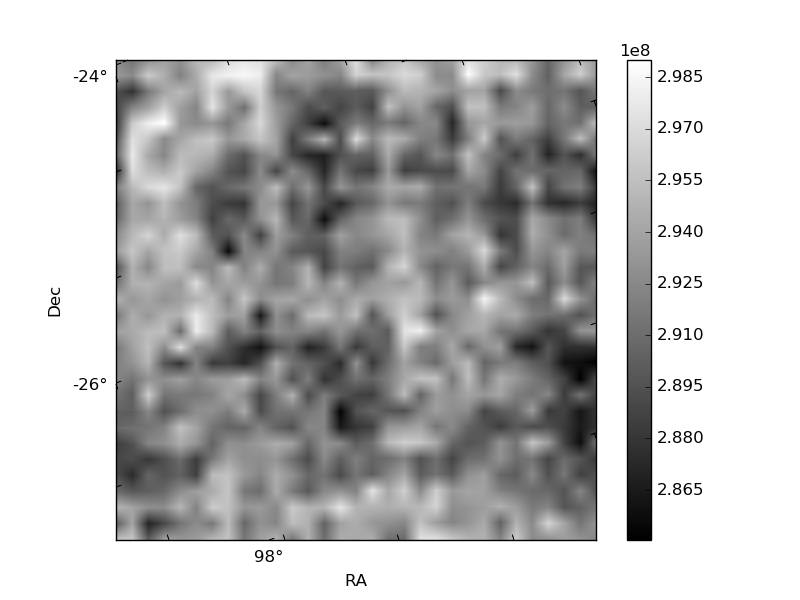
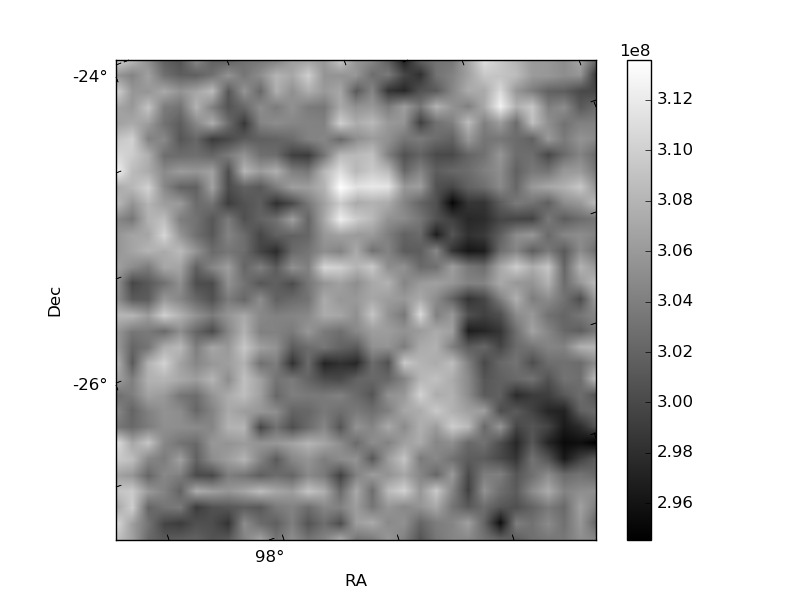
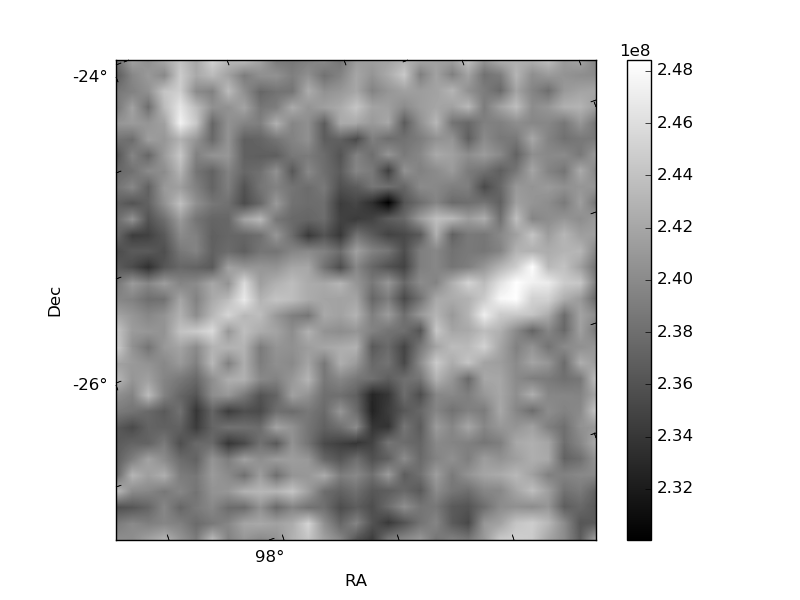
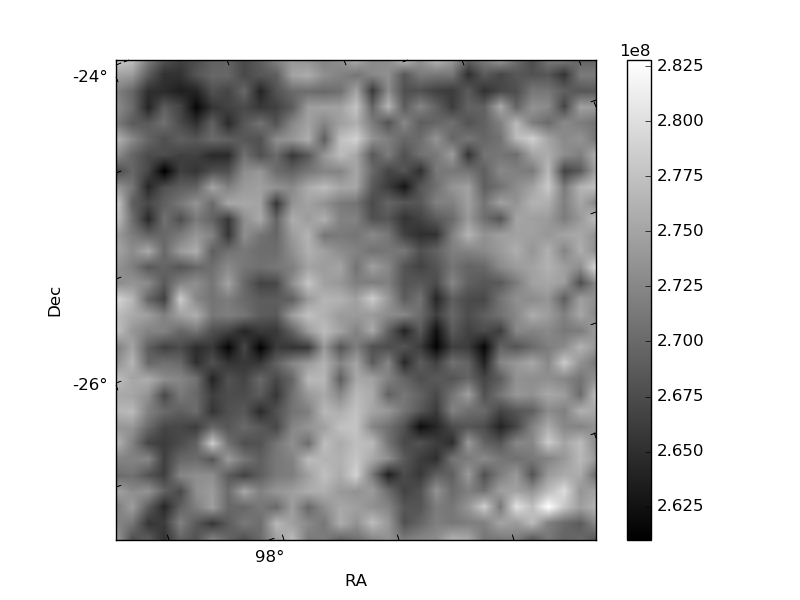
Histogram calculated using DETX and DETY for each event in the final _common_clean file
| Quadrant A | 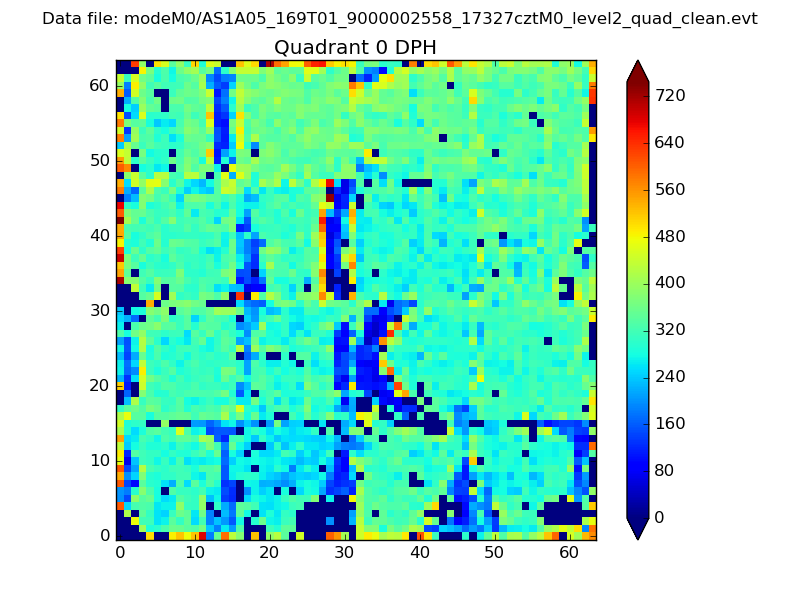 |
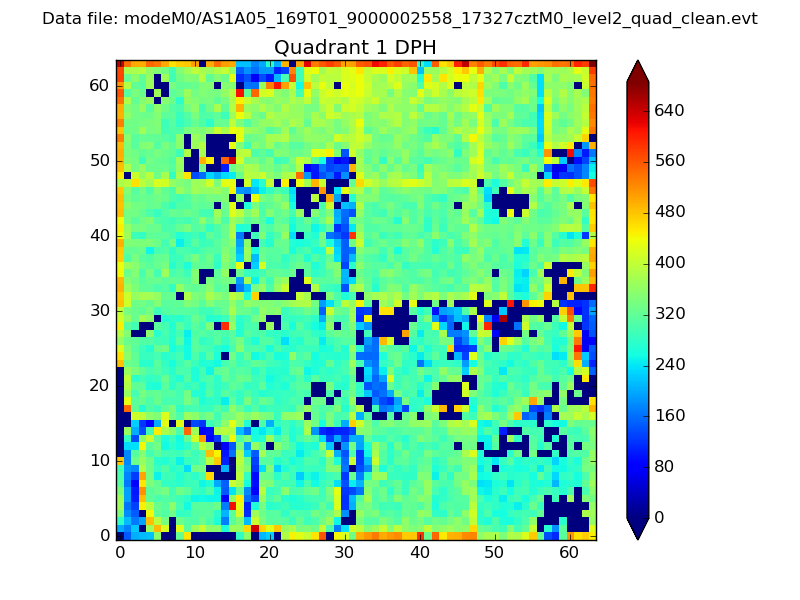 |
Quadrant B |
|---|---|---|---|
| Quadrant D | 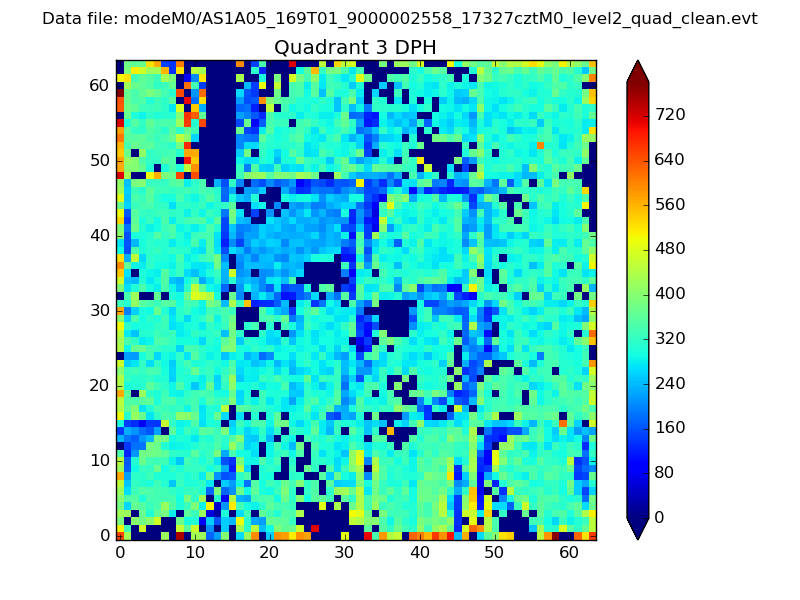 |
 |
Quadrant C |
| Plot type | Count rate plots | Images |
|---|---|---|
| Comparison with Poisson distribution Blue bars denote a histogram of data divided into 1 sec bins. Red curve is a Poisson curve with rate = median count rate of data. |
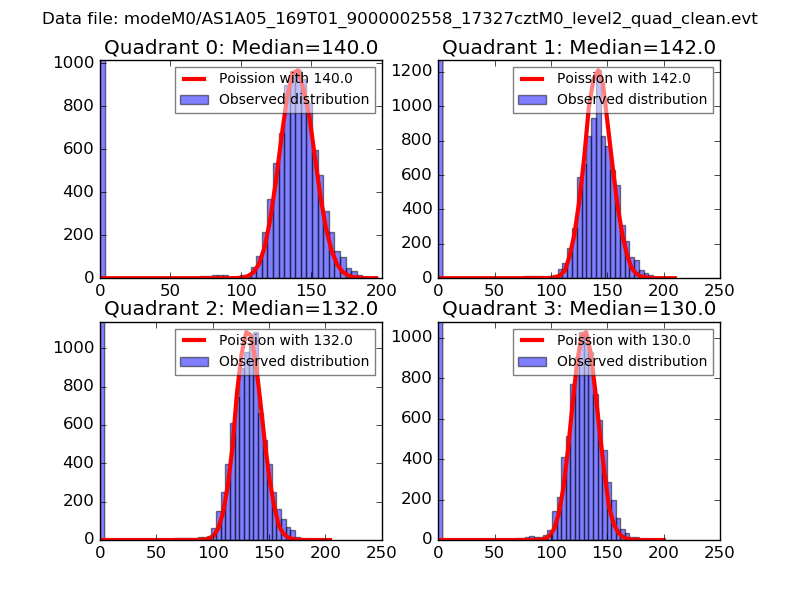 |
 |
| Quadrant-wise count rates Data is divided into 100 sec bins |
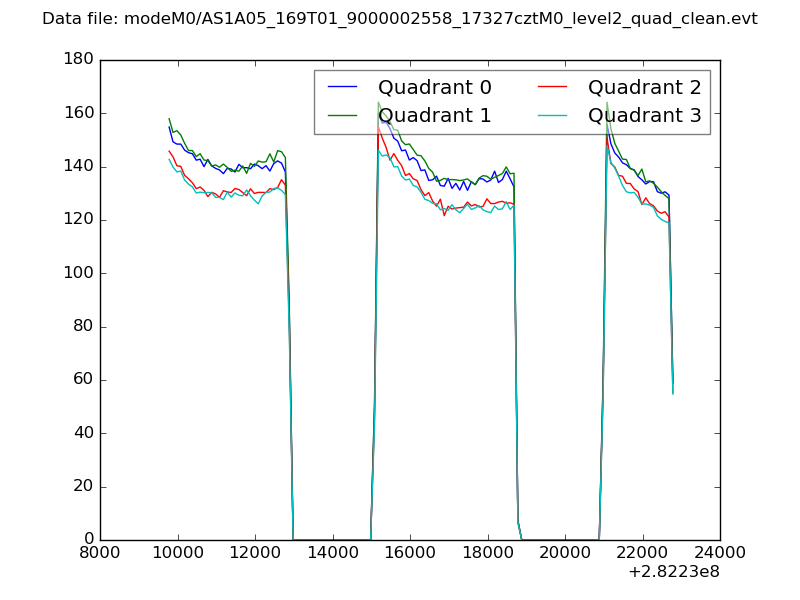 |
|
| Module-wise count rates for Quadrant A Data is divided into 100 sec bins |
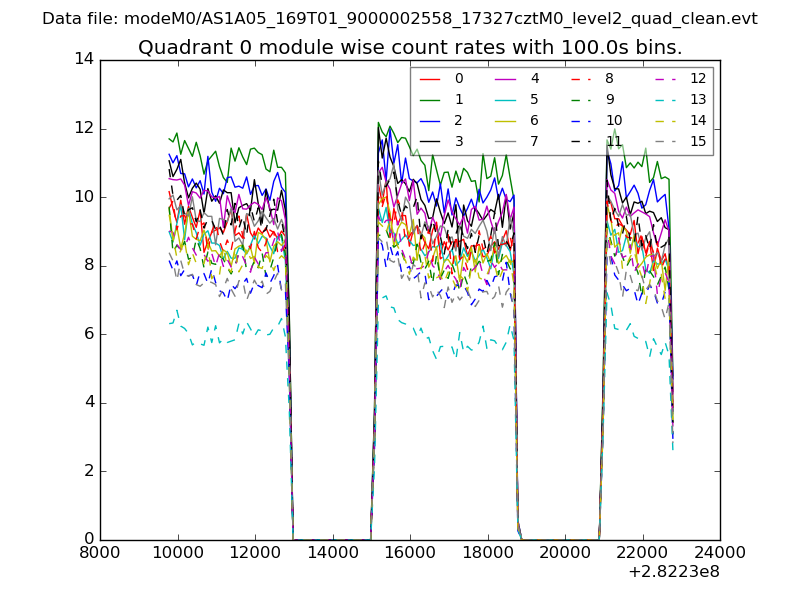 |
 |
| Module-wise count rates for Quadrant B Data is divided into 100 sec bins |
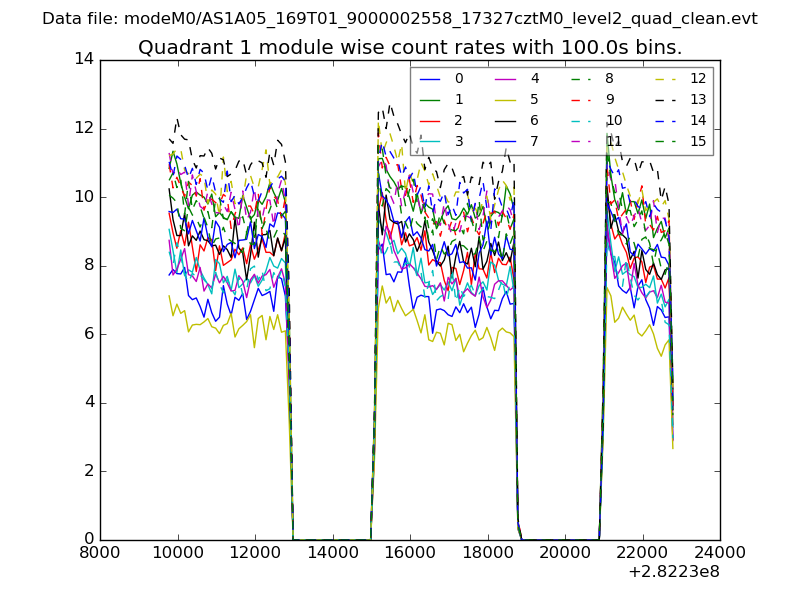 |
 |
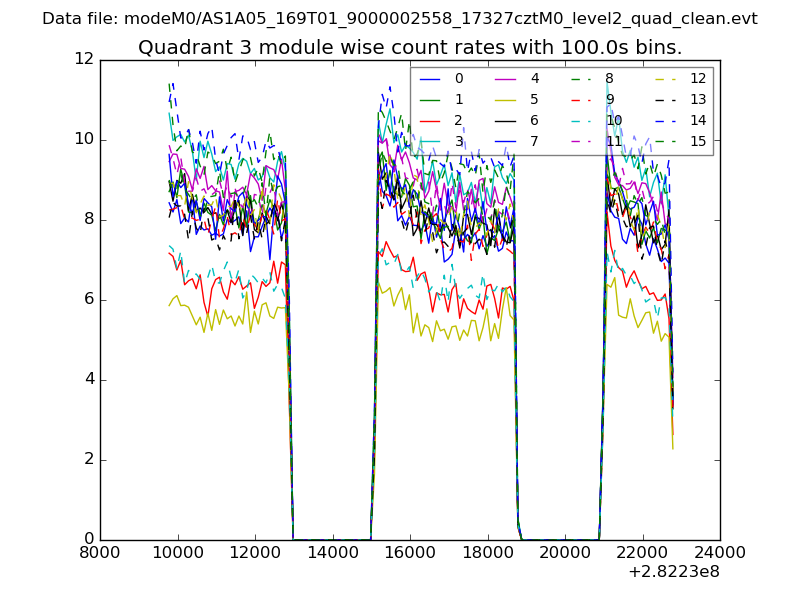
| Module-wise count rates for Quadrant C Data is divided into 100 sec bins |
 |
 |
| Module-wise count rates for Quadrant D Data is divided into 100 sec bins |
 |
 |
| Parameter | Plot |
|---|---|
| CZT HV Monitor | 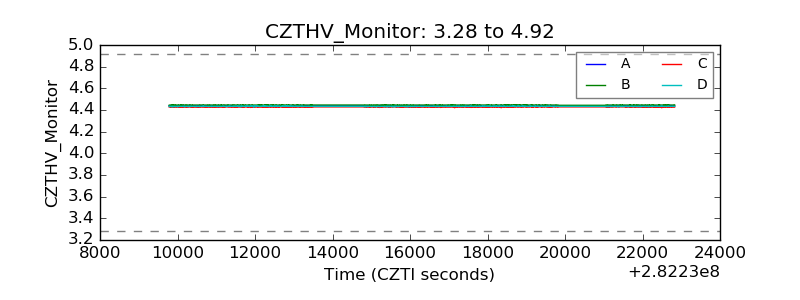 |
| D_VDD | 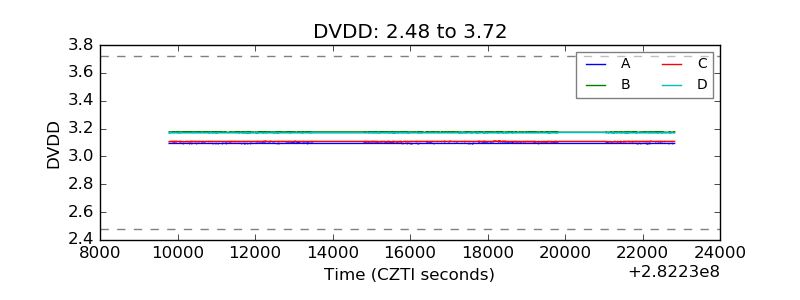 |
| Temperature 1 | 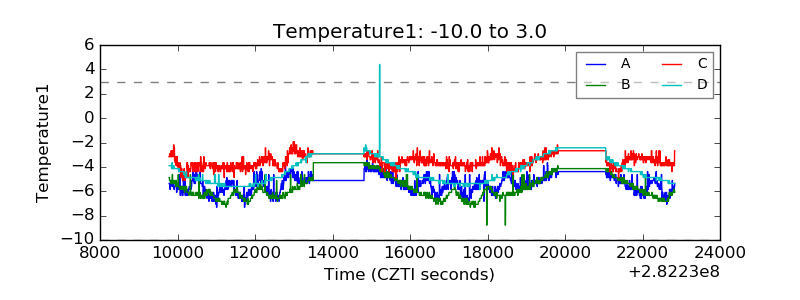 |
| Veto HV Monitor |  |
| Veto LLD | 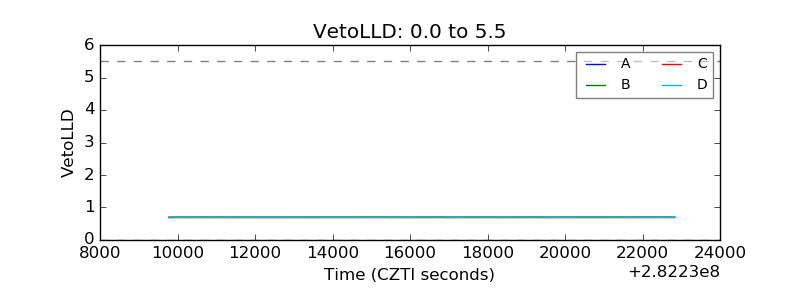 |
| Alpha Counter |  |
| _CPM_Rate | 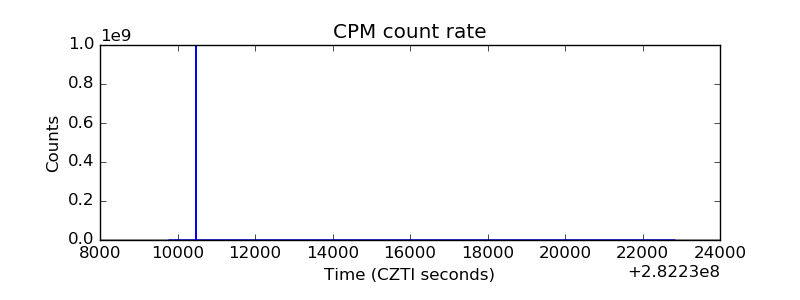 |
| CZT Counter |  |
| +2.5 Volts monitor | 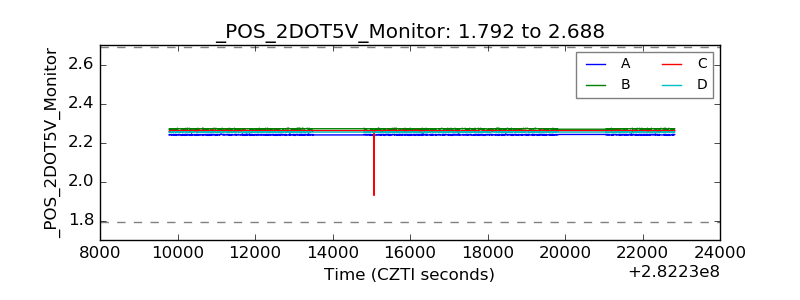 |
| +5 Volts monitor |  |
| _ROLL_ROT | 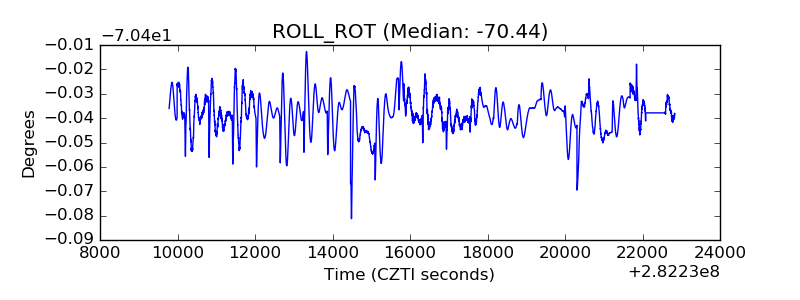 |
| _Roll_DEC | 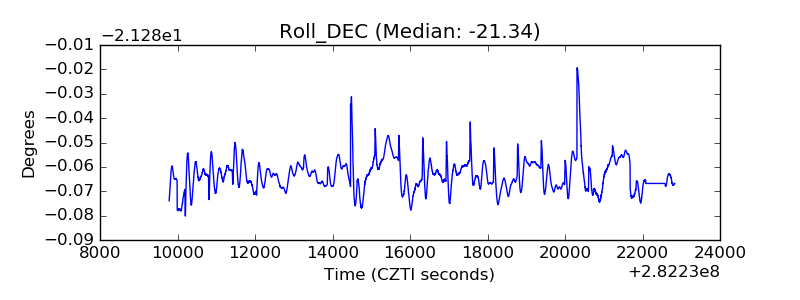 |
| _Roll_RA | 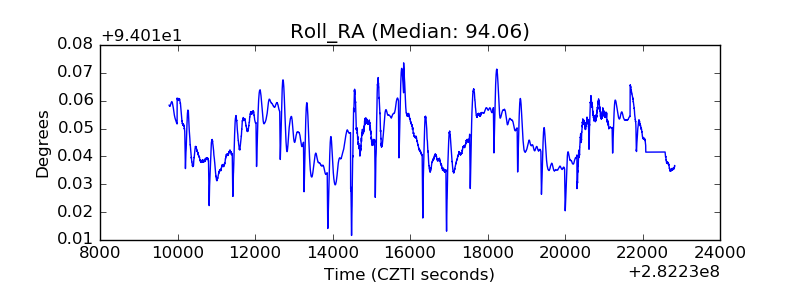 |
| Veto Counter | 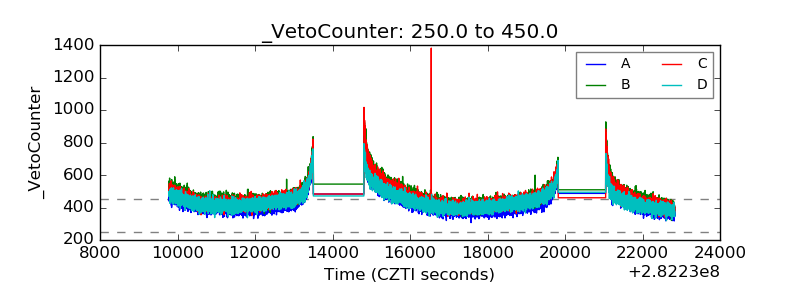 |