| Param | Original file | Final file |
|---|---|---|
| Filename | modeM0/AS1A05_169T01_9000002558_17329cztM0_level2.evt | modeM0/AS1A05_169T01_9000002558_17329cztM0_level2_quad_clean.evt |
| Size (bytes) | 470,952,000 | 99,051,840 |
| Size | 449.1 MB | 94.5 MB |
| Events in quadrant A | 3,350,265 | 642,677 |
| Events in quadrant B | 3,436,312 | 643,000 |
| Events in quadrant C | 3,406,141 | 603,839 |
| Events in quadrant D | 3,576,794 | 604,978 |
| Mode SS | |||
|---|---|---|---|
| Quadrant | BADHDUFLAG | Total packets | Discarded packets |
| A | 0 | 146 | 0 |
| B | 0 | 146 | 0 |
| C | 0 | 146 | 0 |
| D | 0 | 146 | 0 |
| Mode M0 | |||
|---|---|---|---|
| Quadrant | BADHDUFLAG | Total packets | Discarded packets |
| A | 0 | 14935 | 2 |
| B | 0 | 15031 | 2 |
| C | 0 | 14959 | 2 |
| D | 0 | 15914 | 2 |
| Mode M9 | |||
|---|---|---|---|
| Quadrant | BADHDUFLAG | Total packets | Discarded packets |
| A | 0 | 11 | 0 |
| B | 0 | 12 | 0 |
| C | 0 | 12 | 0 |
| D | 0 | 12 | 0 |
| Quadrant | Total seconds | Saturated seconds | Saturation percentage |
|---|---|---|---|
| A | 7261 | 19 | 0.261672% |
| B | 7261 | 51 | 0.702383% |
| C | 7261 | 68 | 0.936510% |
| D | 7261 | 42 | 0.578433% |
Noise dominated data is calculated using 1-second bins in cleaned event files. If a bin has >2000 counts, and if more than 50% of those come from <1% of pixels, then it is considered to be noise-dominated and hence unusable.
| Quadrant | # 1 sec bins | Bins with >0 counts | Bins with >2000 counts | High rate bins dominated by noise | Noise dominated (total time) | Noise dominated (detector-on time) | Marked lightcurve |
|---|---|---|---|---|---|---|---|
| A | 7806 | 7262 | 0 | 0 | 0.00% | 0.00% | 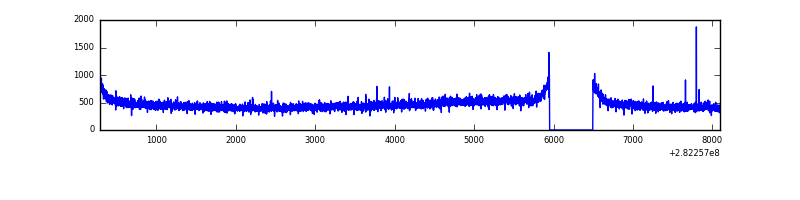 |
| B | 7806 | 7262 | 0 | 0 | 0.00% | 0.00% | 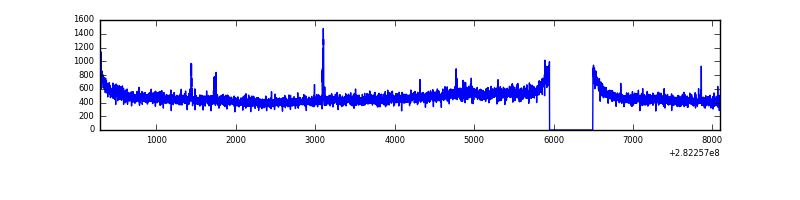 |
| C | 7806 | 7262 | 0 | 0 | 0.00% | 0.00% | 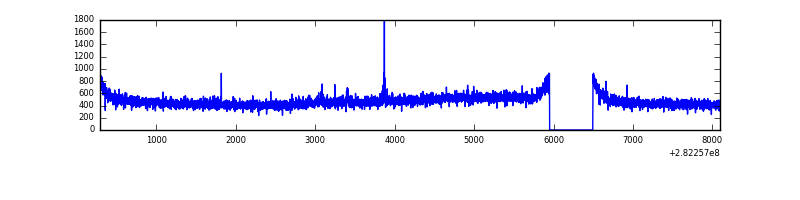 |
| D | 7806 | 7262 | 29 | 29 | 0.37% | 0.40% | 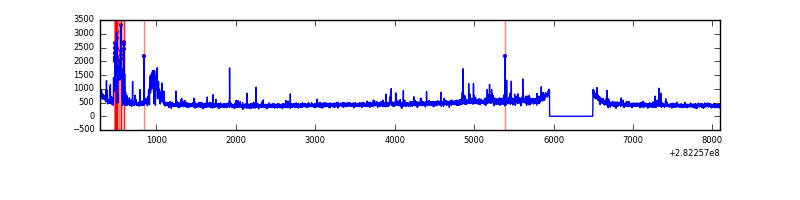 |
Top three noisy pixels from each quadrant. If the there are fewer than three noisy pixels in the level2.evt file, extra rows are filled as -1
| Pixel properties | Quadrant properties | ||||||
|---|---|---|---|---|---|---|---|
| Quadrant | DetID | PixID | Counts | Sigma | Mean | Median | Sigma |
| A | 0 | 226 | 7593 | 38.46 | 871 | 854 | 175.2 |
| A | 3 | 137 | 6920 | 34.62 | 871 | 854 | 175.2 |
| A | 12 | 194 | 6003 | 29.39 | 871 | 854 | 175.2 |
| B | 12 | 111 | 21044 | 120.15 | 870 | 847 | 168.1 |
| B | 4 | 173 | 19327 | 109.94 | 870 | 847 | 168.1 |
| B | 11 | 111 | 18426 | 104.58 | 870 | 847 | 168.1 |
| C | 14 | 238 | 130706 | 664.81 | 828 | 833 | 195.4 |
| C | 3 | 233 | 28816 | 143.24 | 828 | 833 | 195.4 |
| C | 9 | 54 | 21067 | 103.57 | 828 | 833 | 195.4 |
| D | 5 | 222 | 354667 | 1735.35 | 835 | 810 | 203.9 |
| D | 1 | 52 | 30328 | 144.76 | 835 | 810 | 203.9 |
| D | 2 | 234 | 24019 | 113.82 | 835 | 810 | 203.9 |
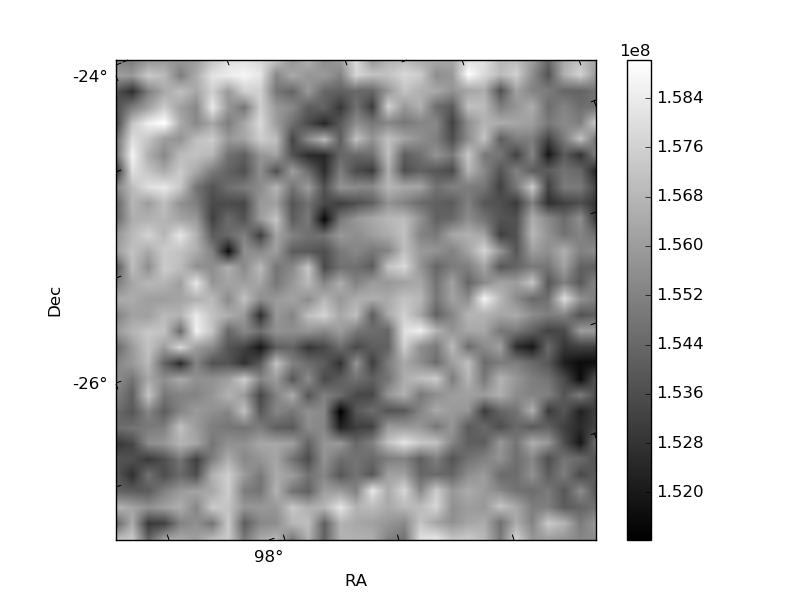
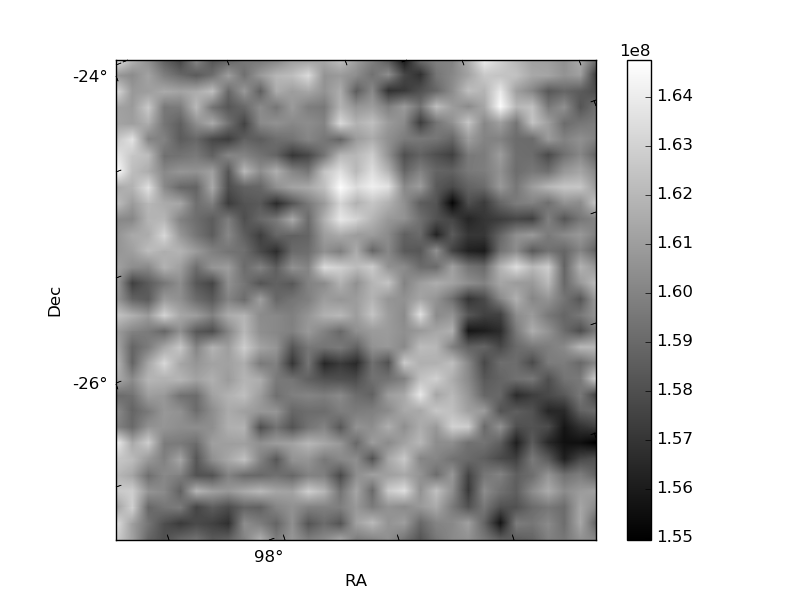
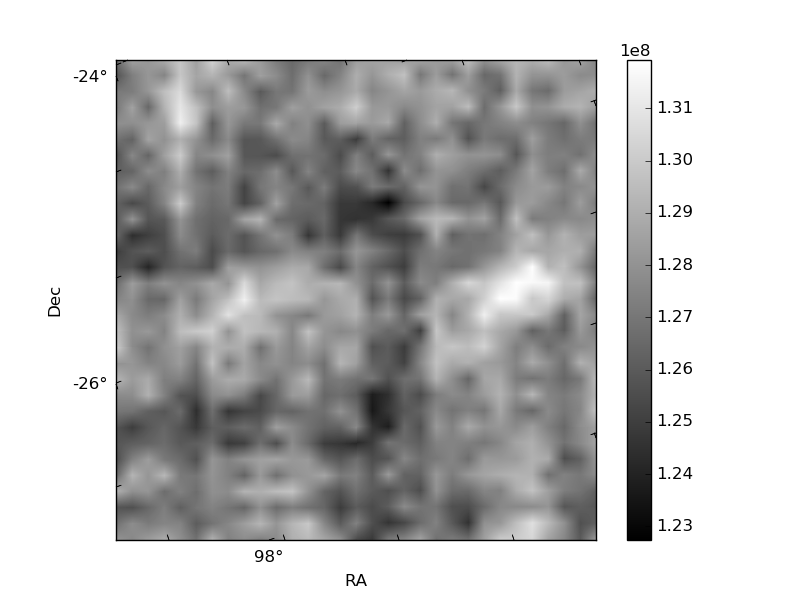
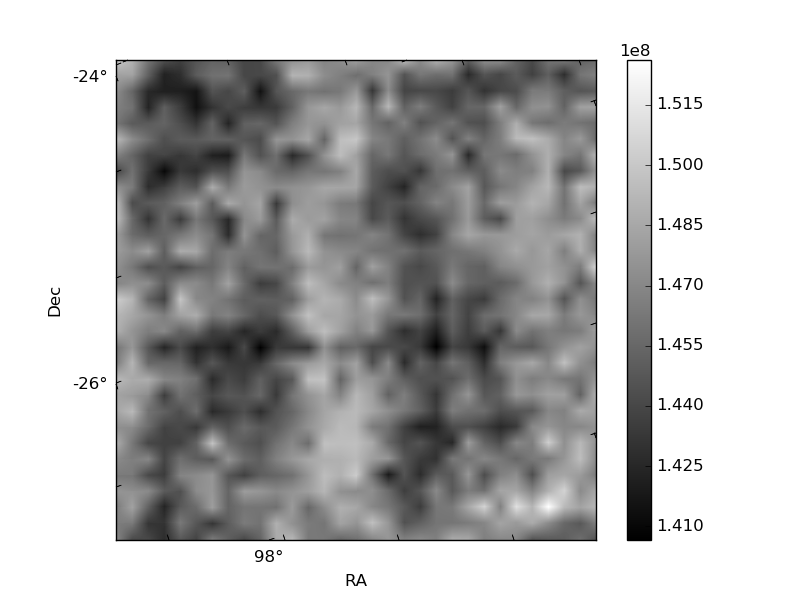
Histogram calculated using DETX and DETY for each event in the final _common_clean file
| Quadrant A |  |
 |
Quadrant B |
|---|---|---|---|
| Quadrant D |  |
 |
Quadrant C |
| Plot type | Count rate plots | Images |
|---|---|---|
| Comparison with Poisson distribution Blue bars denote a histogram of data divided into 1 sec bins. Red curve is a Poisson curve with rate = median count rate of data. |
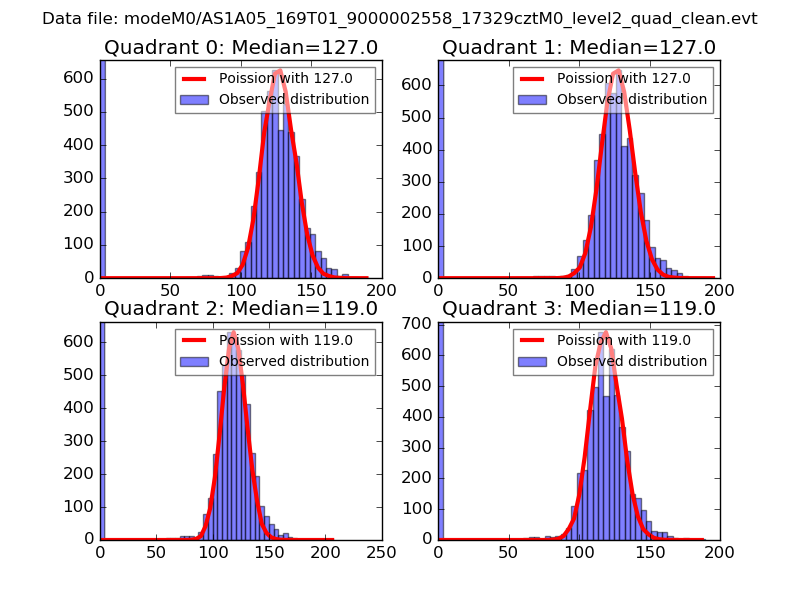 |
 |
| Quadrant-wise count rates Data is divided into 100 sec bins |
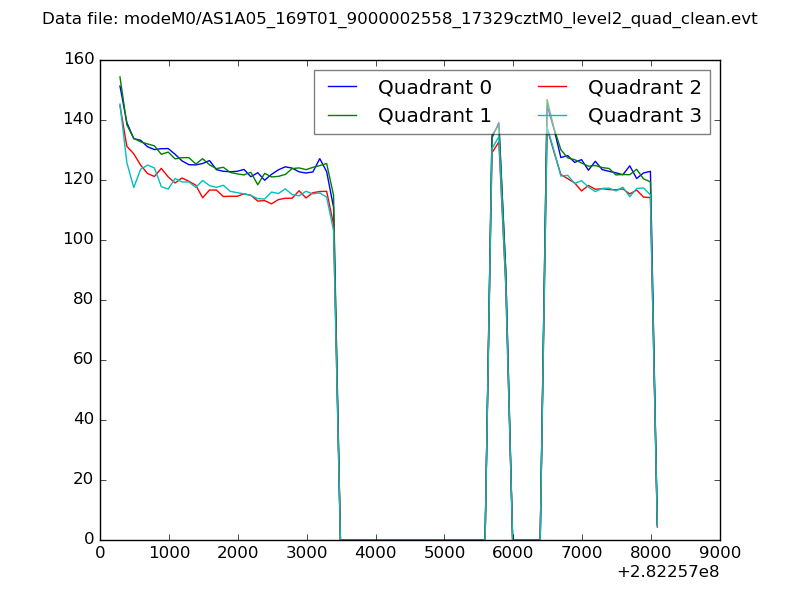 |
|
| Module-wise count rates for Quadrant A Data is divided into 100 sec bins |
 |
 |
| Module-wise count rates for Quadrant B Data is divided into 100 sec bins |
 |
 |
| Module-wise count rates for Quadrant C Data is divided into 100 sec bins |
 |
 |
| Module-wise count rates for Quadrant D Data is divided into 100 sec bins |
 |
 |
| Parameter | Plot |
|---|---|
| CZT HV Monitor |  |
| D_VDD | 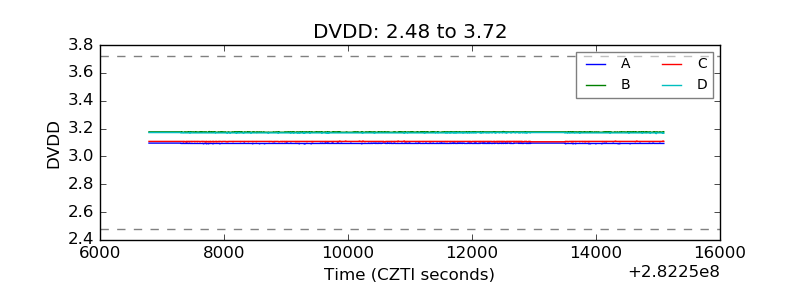 |
| Temperature 1 |  |
| Veto HV Monitor |  |
| Veto LLD |  |
| Alpha Counter |  |
| _CPM_Rate | 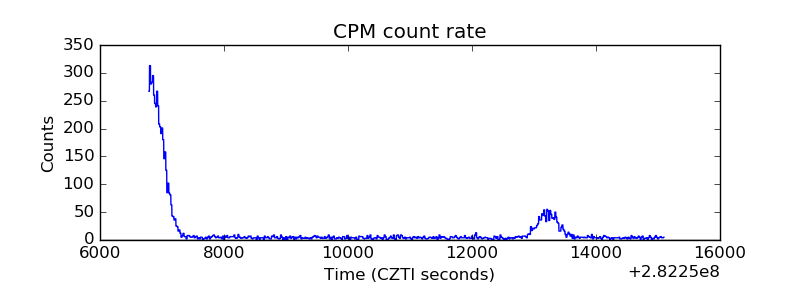 |
| CZT Counter |  |
| +2.5 Volts monitor |  |
| +5 Volts monitor |  |
| _ROLL_ROT |  |
| _Roll_DEC |  |
| _Roll_RA |  |
| Veto Counter |  |