| Param | Original file | Final file |
|---|---|---|
| Filename | modeM0/AS1A05_169T01_9000002558_17331cztM0_level2.evt | modeM0/AS1A05_169T01_9000002558_17331cztM0_level2_quad_clean.evt |
| Size (bytes) | 571,273,920 | 126,299,520 |
| Size | 544.8 MB | 120.4 MB |
| Events in quadrant A | 4,088,374 | 829,147 |
| Events in quadrant B | 4,176,454 | 826,483 |
| Events in quadrant C | 4,135,828 | 778,445 |
| Events in quadrant D | 4,304,539 | 781,815 |
| Mode SS | |||
|---|---|---|---|
| Quadrant | BADHDUFLAG | Total packets | Discarded packets |
| A | 0 | 180 | 0 |
| B | 0 | 180 | 0 |
| C | 0 | 180 | 0 |
| D | 0 | 180 | 0 |
| Mode M0 | |||
|---|---|---|---|
| Quadrant | BADHDUFLAG | Total packets | Discarded packets |
| A | 0 | 18091 | 2 |
| B | 0 | 18274 | 2 |
| C | 0 | 18103 | 2 |
| D | 0 | 18929 | 2 |
| Mode M9 | |||
|---|---|---|---|
| Quadrant | BADHDUFLAG | Total packets | Discarded packets |
| A | 0 | 4 | 0 |
| B | 0 | 4 | 0 |
| C | 0 | 4 | 0 |
| D | 0 | 4 | 0 |
| Quadrant | Total seconds | Saturated seconds | Saturation percentage |
|---|---|---|---|
| A | 8773 | 127 | 1.447623% |
| B | 8773 | 175 | 1.994757% |
| C | 8773 | 221 | 2.519093% |
| D | 8773 | 121 | 1.379232% |
Noise dominated data is calculated using 1-second bins in cleaned event files. If a bin has >2000 counts, and if more than 50% of those come from <1% of pixels, then it is considered to be noise-dominated and hence unusable.
| Quadrant | # 1 sec bins | Bins with >0 counts | Bins with >2000 counts | High rate bins dominated by noise | Noise dominated (total time) | Noise dominated (detector-on time) | Marked lightcurve |
|---|---|---|---|---|---|---|---|
| A | 9198 | 8775 | 0 | 0 | 0.00% | 0.00% | 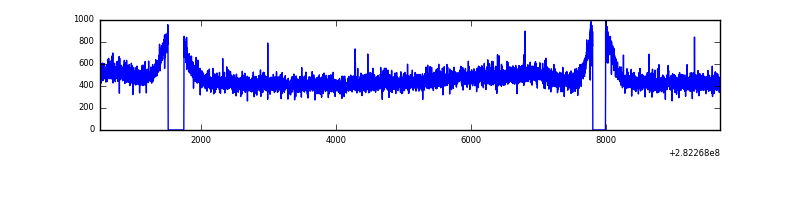 |
| B | 9198 | 8775 | 0 | 0 | 0.00% | 0.00% | 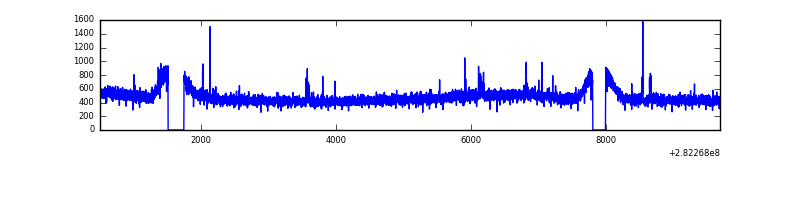 |
| C | 9198 | 8775 | 0 | 0 | 0.00% | 0.00% | 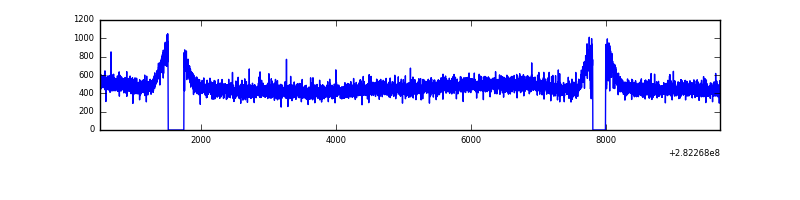 |
| D | 9198 | 8775 | 16 | 16 | 0.17% | 0.18% | 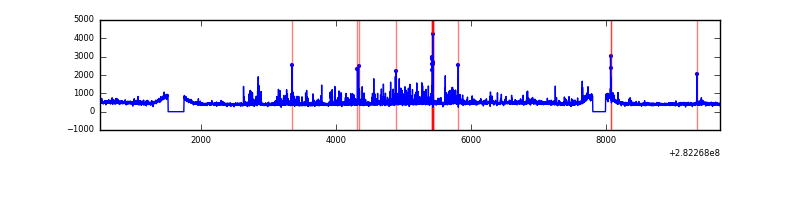 |
Top three noisy pixels from each quadrant. If the there are fewer than three noisy pixels in the level2.evt file, extra rows are filled as -1
| Pixel properties | Quadrant properties | ||||||
|---|---|---|---|---|---|---|---|
| Quadrant | DetID | PixID | Counts | Sigma | Mean | Median | Sigma |
| A | 0 | 226 | 8980 | 36.51 | 1064 | 1038 | 217.6 |
| A | 3 | 137 | 8494 | 34.27 | 1064 | 1038 | 217.6 |
| A | 12 | 194 | 7524 | 29.81 | 1064 | 1038 | 217.6 |
| B | 12 | 111 | 26193 | 122.86 | 1055 | 1025 | 204.9 |
| B | 4 | 173 | 23630 | 110.35 | 1055 | 1025 | 204.9 |
| B | 11 | 111 | 22492 | 104.79 | 1055 | 1025 | 204.9 |
| C | 14 | 238 | 155075 | 640.59 | 1016 | 1022 | 240.5 |
| C | 3 | 233 | 19999 | 78.91 | 1016 | 1022 | 240.5 |
| C | 13 | 61 | 7293 | 26.08 | 1016 | 1022 | 240.5 |
| D | 5 | 222 | 315885 | 1260.6 | 1031 | 1000 | 249.8 |
| D | 2 | 152 | 45380 | 177.67 | 1031 | 1000 | 249.8 |
| D | 2 | 234 | 30605 | 118.52 | 1031 | 1000 | 249.8 |
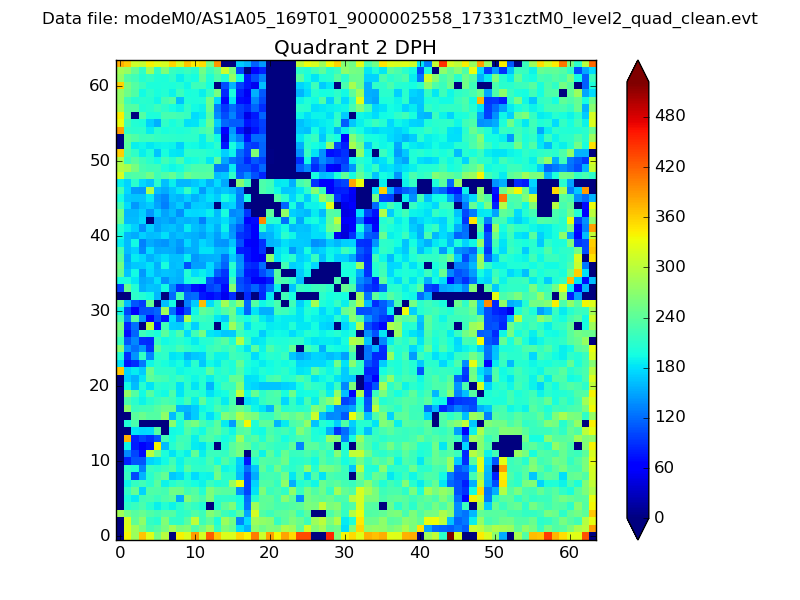
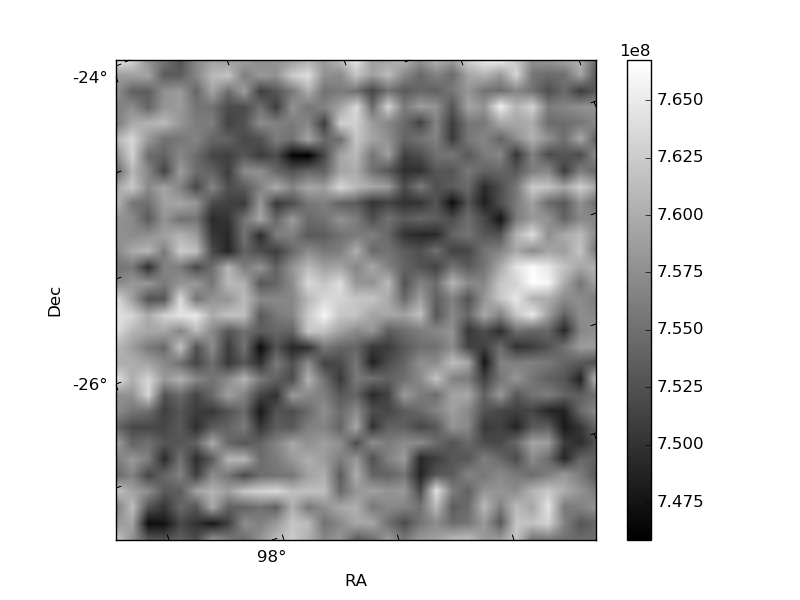
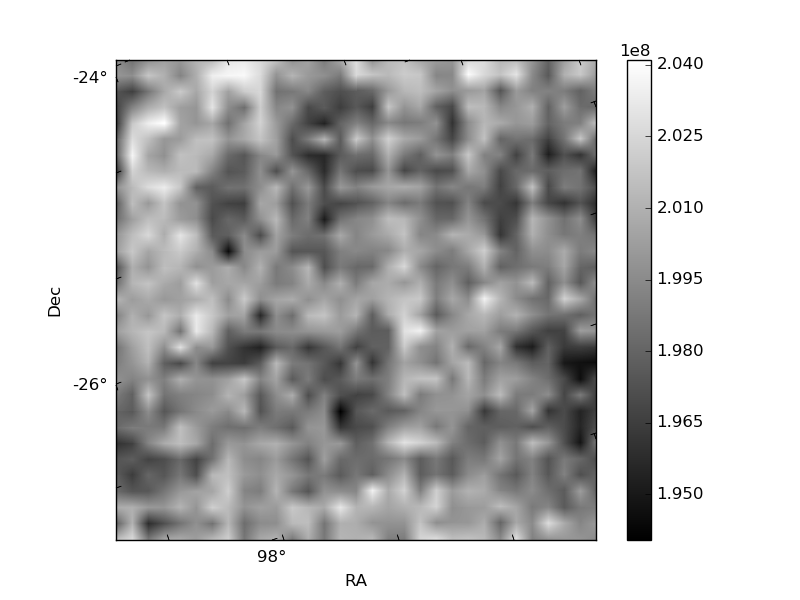
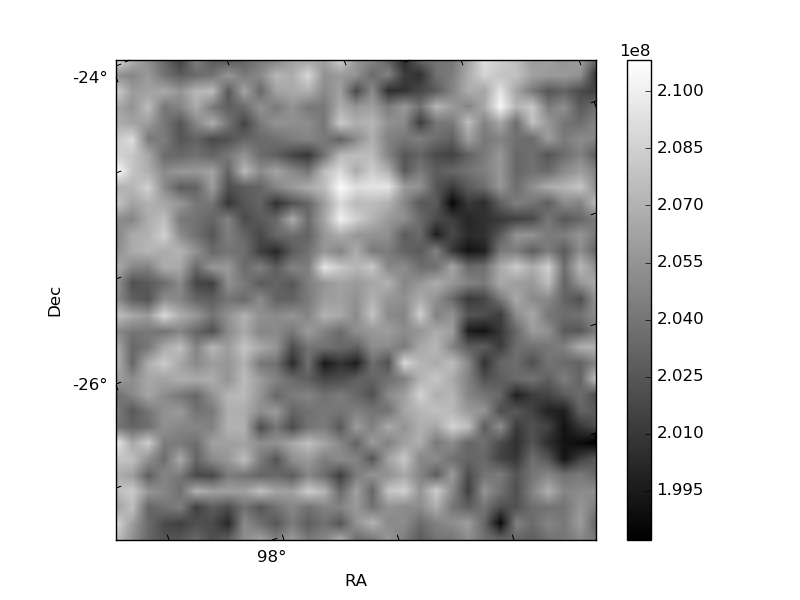
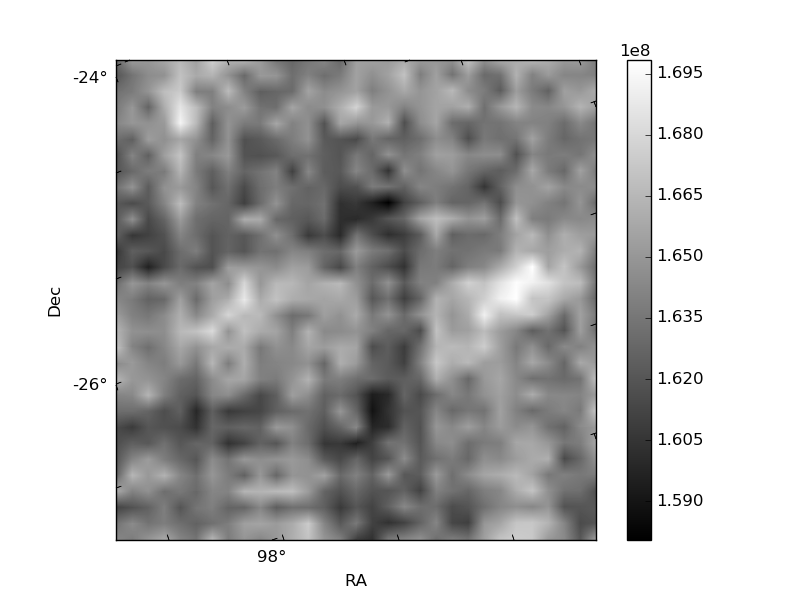
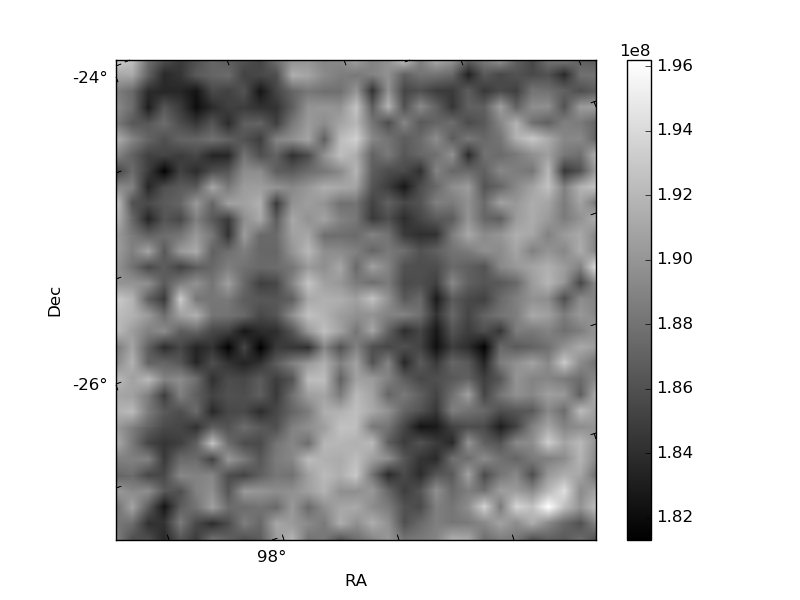
Histogram calculated using DETX and DETY for each event in the final _common_clean file
| Quadrant A | 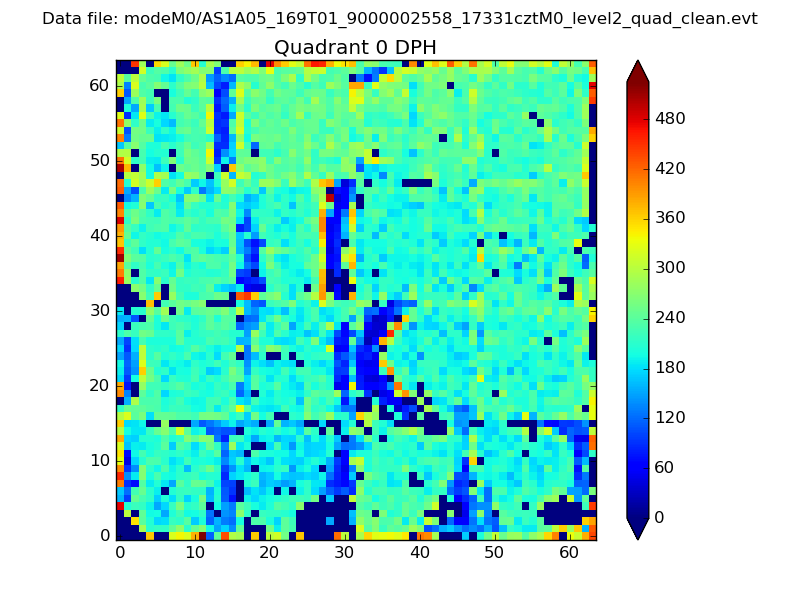 |
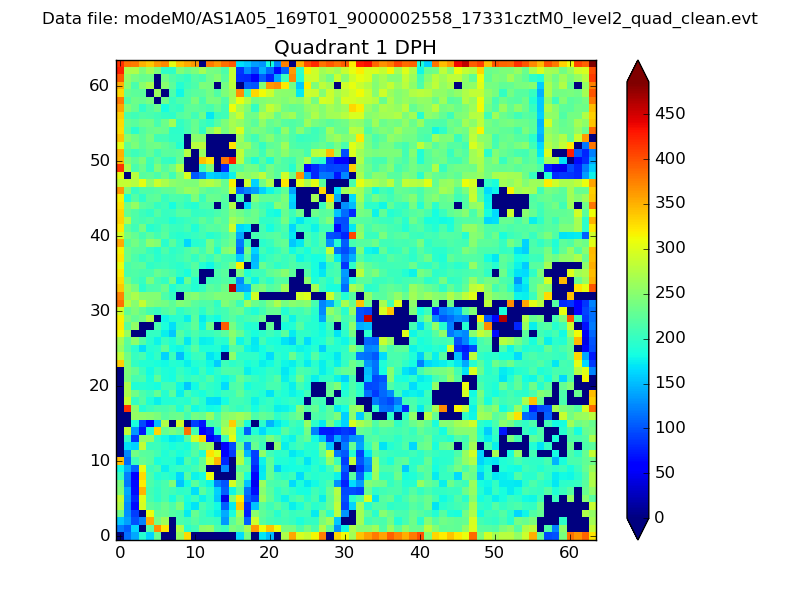 |
Quadrant B |
|---|---|---|---|
| Quadrant D | 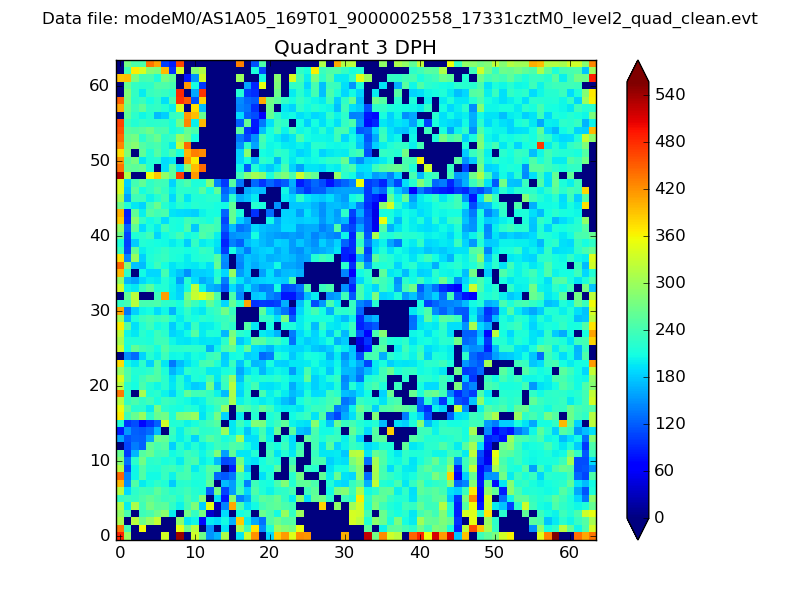 |
 |
Quadrant C |
| Plot type | Count rate plots | Images |
|---|---|---|
| Comparison with Poisson distribution Blue bars denote a histogram of data divided into 1 sec bins. Red curve is a Poisson curve with rate = median count rate of data. |
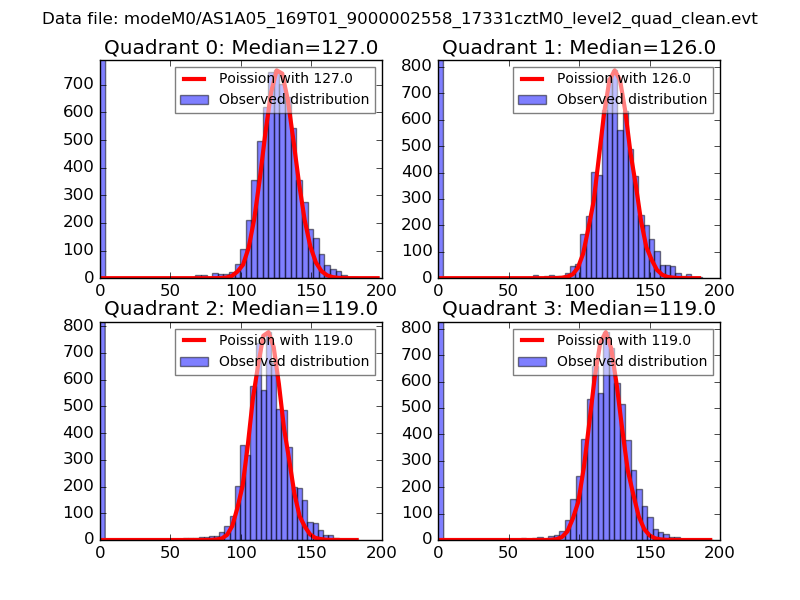 |
 |
| Quadrant-wise count rates Data is divided into 100 sec bins |
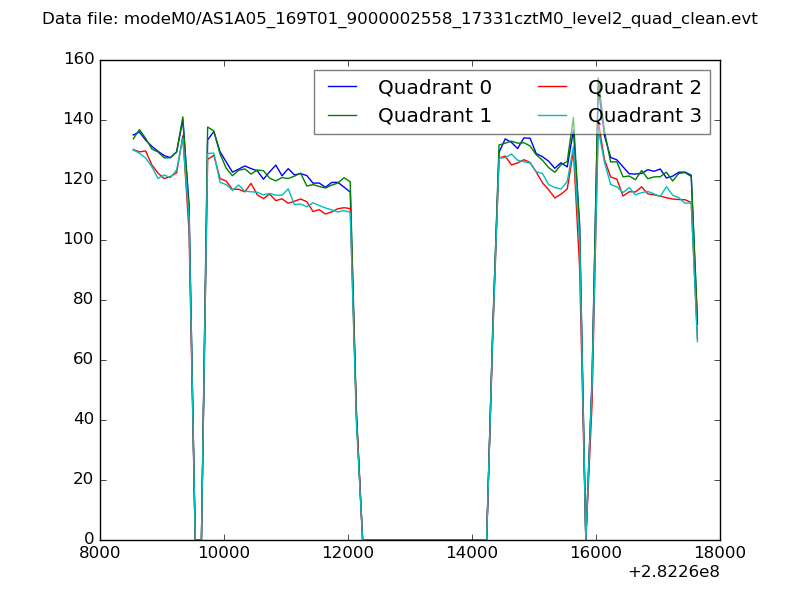 |
|
| Module-wise count rates for Quadrant A Data is divided into 100 sec bins |
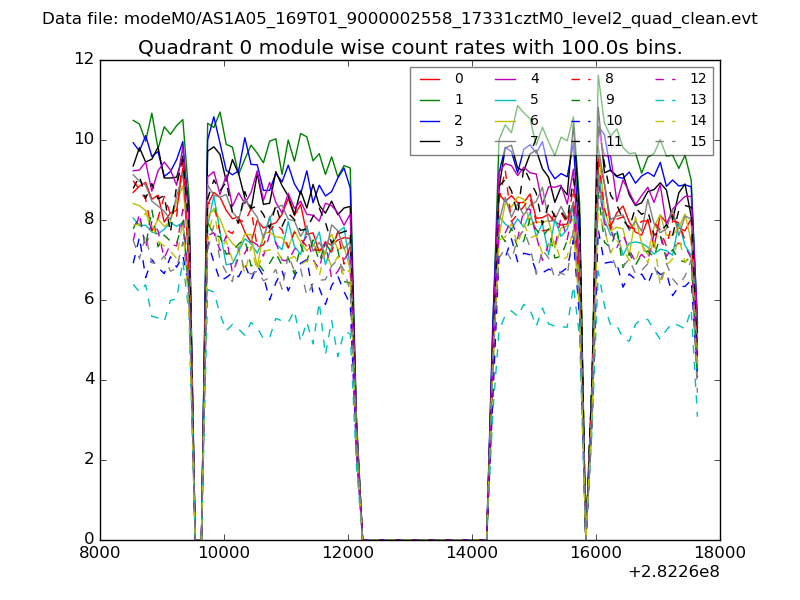 |
 |
| Module-wise count rates for Quadrant B Data is divided into 100 sec bins |
 |
 |
| Module-wise count rates for Quadrant C Data is divided into 100 sec bins |
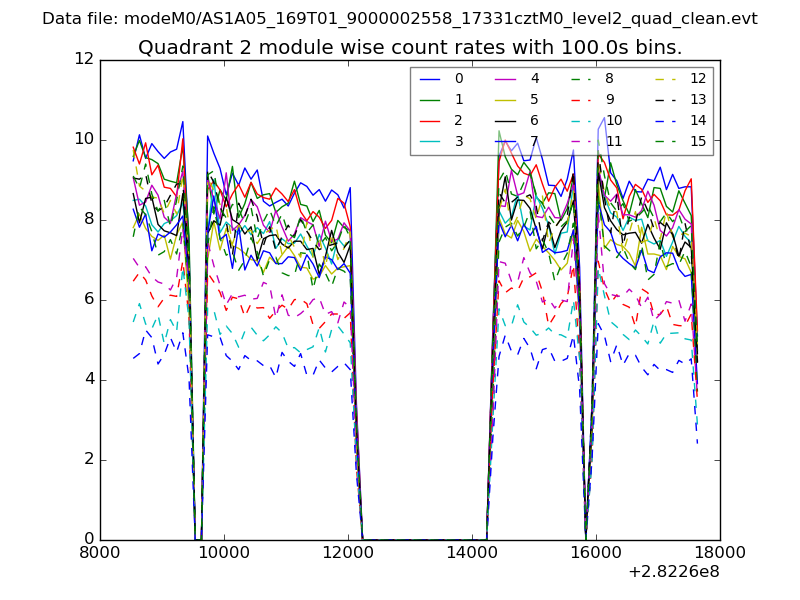 |
 |
| Module-wise count rates for Quadrant D Data is divided into 100 sec bins |
 |
 |
| Parameter | Plot |
|---|---|
| CZT HV Monitor | 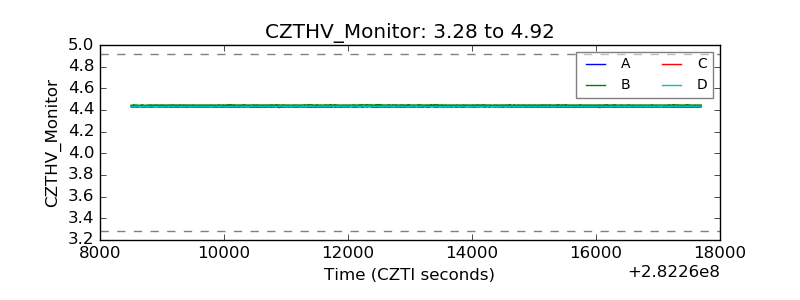 |
| D_VDD | 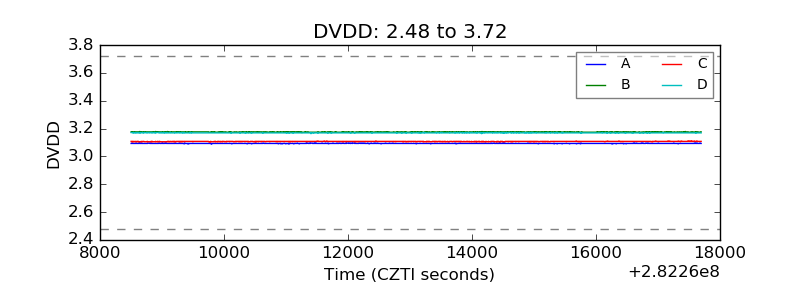 |
| Temperature 1 | 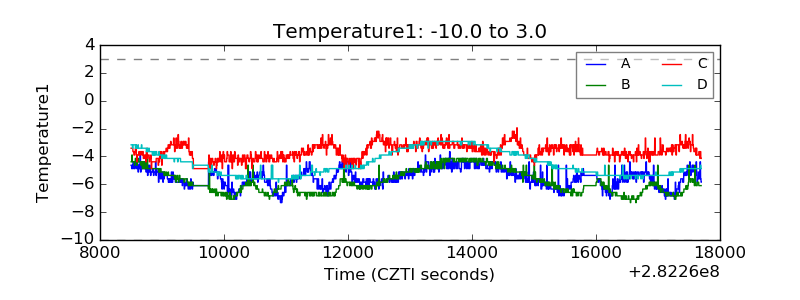 |
| Veto HV Monitor | 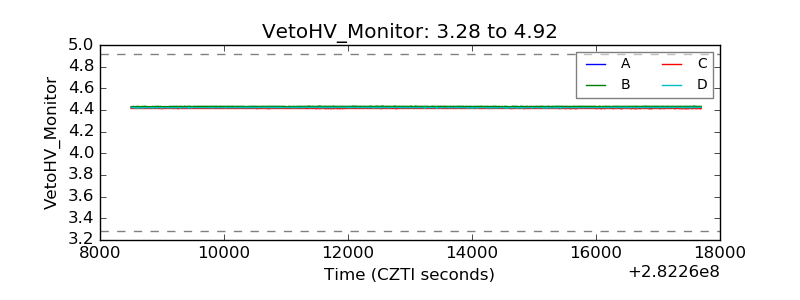 |
| Veto LLD |  |
| Alpha Counter | 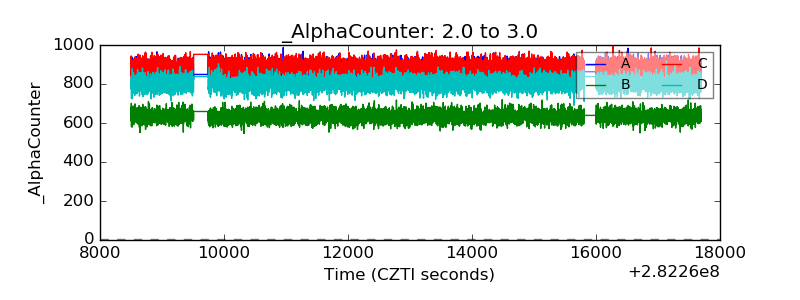 |
| _CPM_Rate | 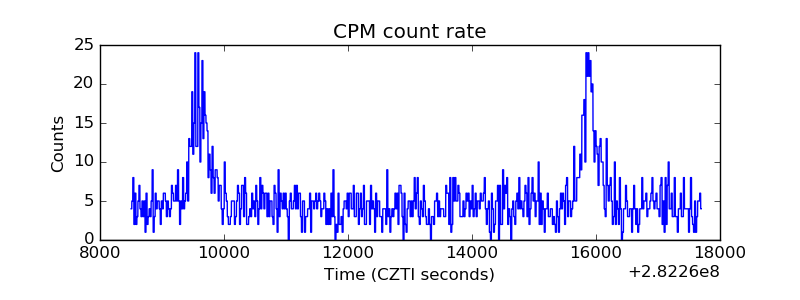 |
| CZT Counter | 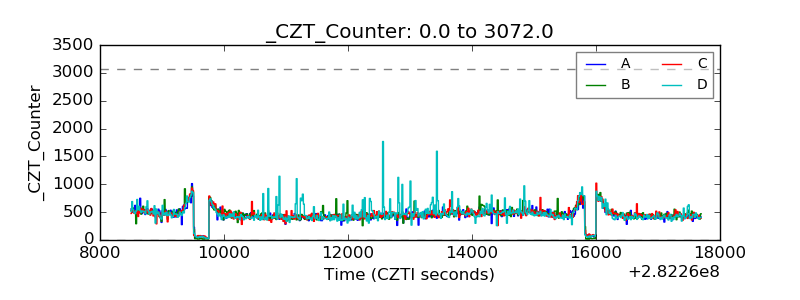 |
| +2.5 Volts monitor | 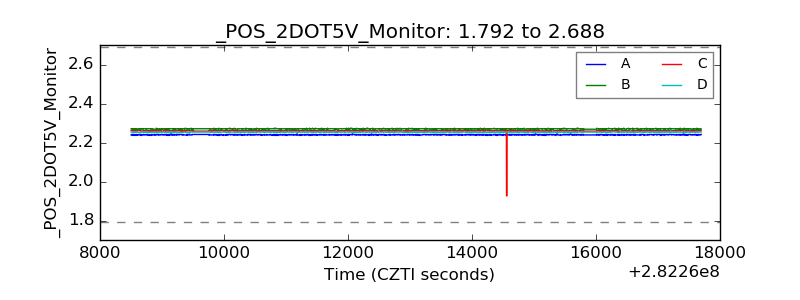 |
| +5 Volts monitor |  |
| _ROLL_ROT | 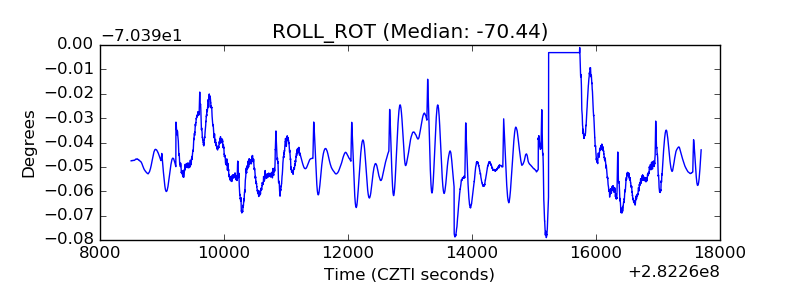 |
| _Roll_DEC | 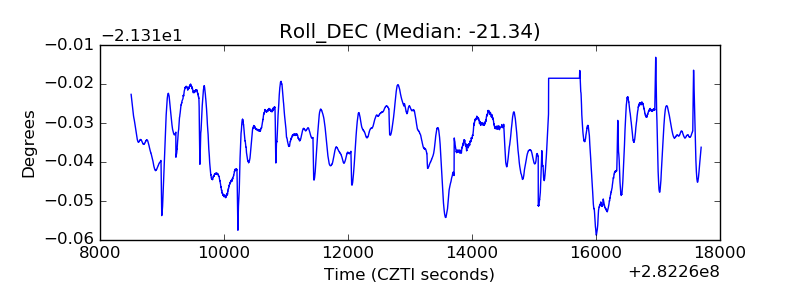 |
| _Roll_RA | 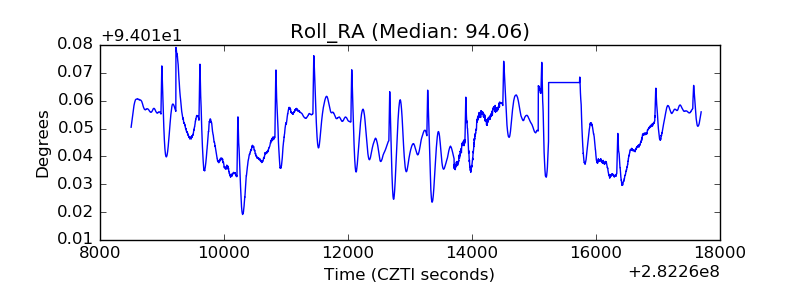 |
| Veto Counter | 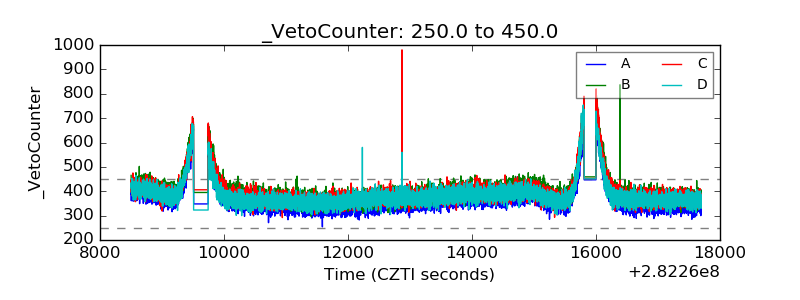 |