| Param | Original file | Final file |
|---|---|---|
| Filename | modeM0/AS1A05_169T01_9000002558_17334cztM0_level2.evt | modeM0/AS1A05_169T01_9000002558_17334cztM0_level2_quad_clean.evt |
| Size (bytes) | 1,198,995,840 | 222,125,760 |
| Size | 1.1 GB | 211.8 MB |
| Events in quadrant A | 8,497,536 | 1,395,698 |
| Events in quadrant B | 8,695,834 | 1,400,222 |
| Events in quadrant C | 8,695,986 | 1,326,487 |
| Events in quadrant D | 9,164,180 | 1,324,071 |
| Mode SS | |||
|---|---|---|---|
| Quadrant | BADHDUFLAG | Total packets | Discarded packets |
| A | 0 | 378 | 0 |
| B | 0 | 378 | 0 |
| C | 0 | 378 | 0 |
| D | 0 | 378 | 0 |
| Mode M0 | |||
|---|---|---|---|
| Quadrant | BADHDUFLAG | Total packets | Discarded packets |
| A | 0 | 37870 | 4 |
| B | 0 | 38125 | 4 |
| C | 0 | 37990 | 5 |
| D | 0 | 40115 | 4 |
| Mode M9 | |||
|---|---|---|---|
| Quadrant | BADHDUFLAG | Total packets | Discarded packets |
| A | 0 | 22 | 0 |
| B | 0 | 22 | 0 |
| C | 0 | 22 | 0 |
| D | 0 | 22 | 0 |
| Quadrant | Total seconds | Saturated seconds | Saturation percentage |
|---|---|---|---|
| A | 18594 | 188 | 1.011079% |
| B | 18594 | 245 | 1.317629% |
| C | 18594 | 310 | 1.667204% |
| D | 18594 | 244 | 1.312251% |
Noise dominated data is calculated using 1-second bins in cleaned event files. If a bin has >2000 counts, and if more than 50% of those come from <1% of pixels, then it is considered to be noise-dominated and hence unusable.
| Quadrant | # 1 sec bins | Bins with >0 counts | Bins with >2000 counts | High rate bins dominated by noise | Noise dominated (total time) | Noise dominated (detector-on time) | Marked lightcurve |
|---|---|---|---|---|---|---|---|
| A | 20749 | 18597 | 0 | 0 | 0.00% | 0.00% | 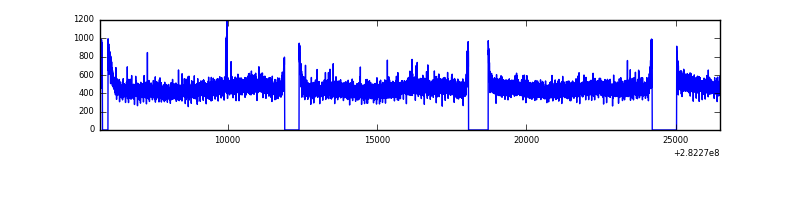 |
| B | 20749 | 18597 | 1 | 1 | 0.00% | 0.01% | 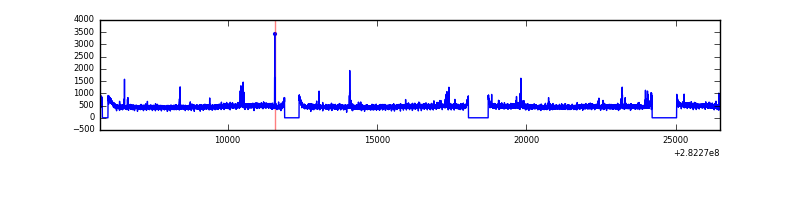 |
| C | 20749 | 18597 | 2 | 2 | 0.01% | 0.01% | 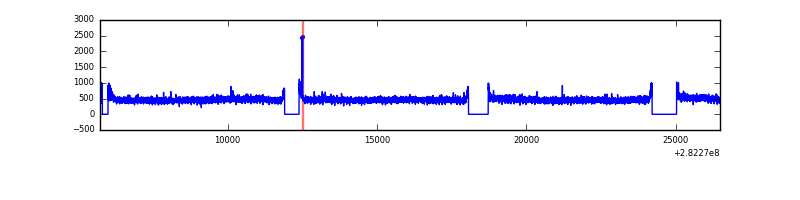 |
| D | 20749 | 18597 | 77 | 77 | 0.37% | 0.41% | 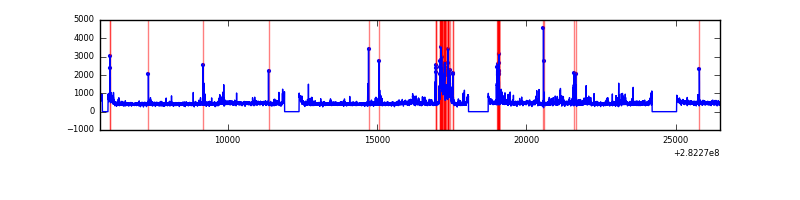 |
Top three noisy pixels from each quadrant. If the there are fewer than three noisy pixels in the level2.evt file, extra rows are filled as -1
| Pixel properties | Quadrant properties | ||||||
|---|---|---|---|---|---|---|---|
| Quadrant | DetID | PixID | Counts | Sigma | Mean | Median | Sigma |
| A | 15 | 31 | 23637 | 48.33 | 2206 | 2157 | 444.4 |
| A | 0 | 226 | 18810 | 37.47 | 2206 | 2157 | 444.4 |
| A | 3 | 137 | 17377 | 34.25 | 2206 | 2157 | 444.4 |
| B | 4 | 173 | 98051 | 227.87 | 2191 | 2127 | 421.0 |
| B | 12 | 111 | 53487 | 122.01 | 2191 | 2127 | 421.0 |
| B | 11 | 111 | 47473 | 107.72 | 2191 | 2127 | 421.0 |
| C | 14 | 238 | 324507 | 647.86 | 2122 | 2131 | 497.6 |
| C | 3 | 233 | 63380 | 123.09 | 2122 | 2131 | 497.6 |
| C | 9 | 54 | 42258 | 80.64 | 2122 | 2131 | 497.6 |
| D | 5 | 222 | 796854 | 1530.35 | 2145 | 2081 | 519.3 |
| D | 2 | 152 | 149254 | 283.38 | 2145 | 2081 | 519.3 |
| D | 2 | 234 | 64317 | 119.84 | 2145 | 2081 | 519.3 |
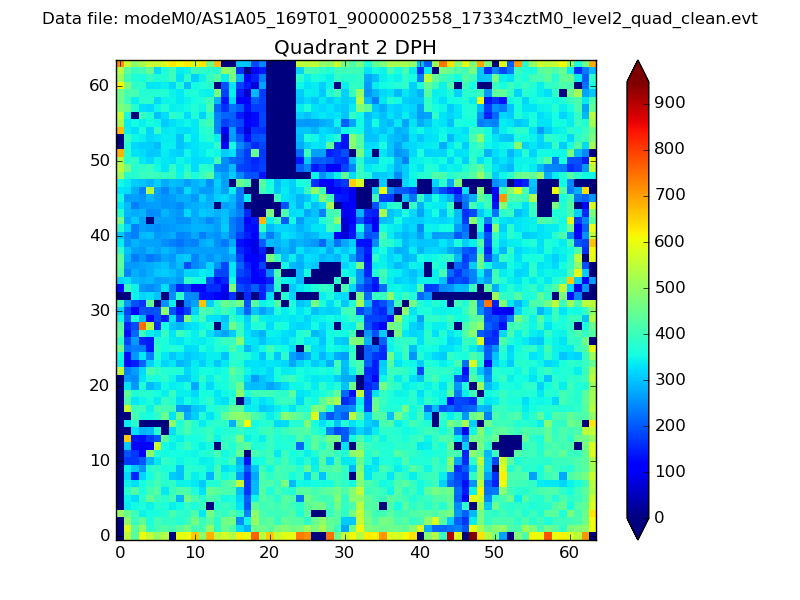
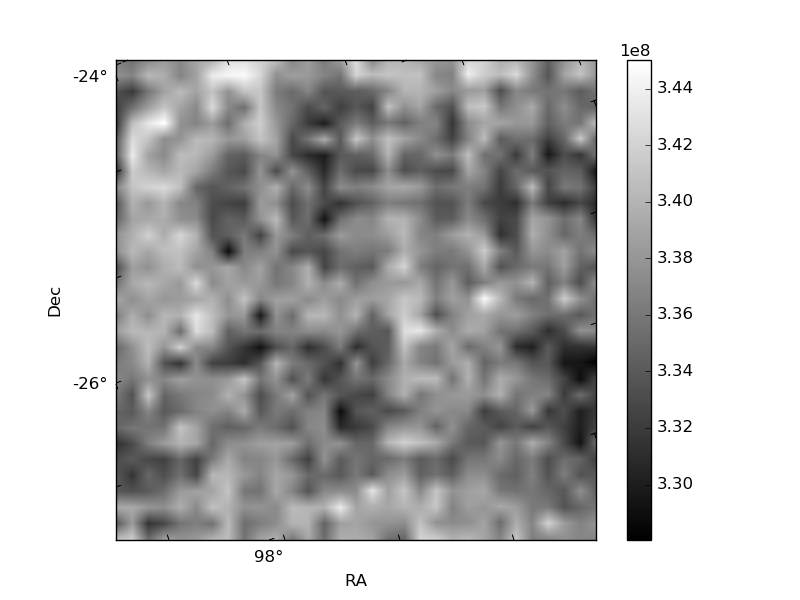
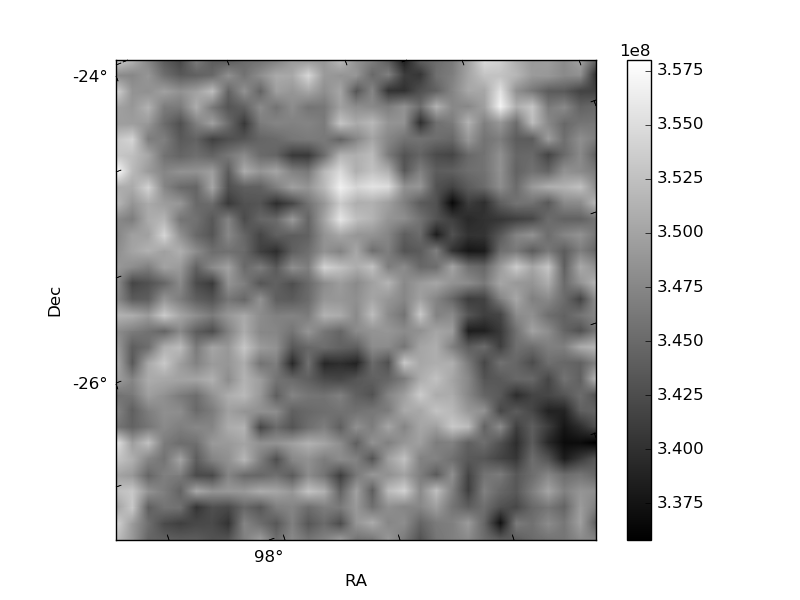
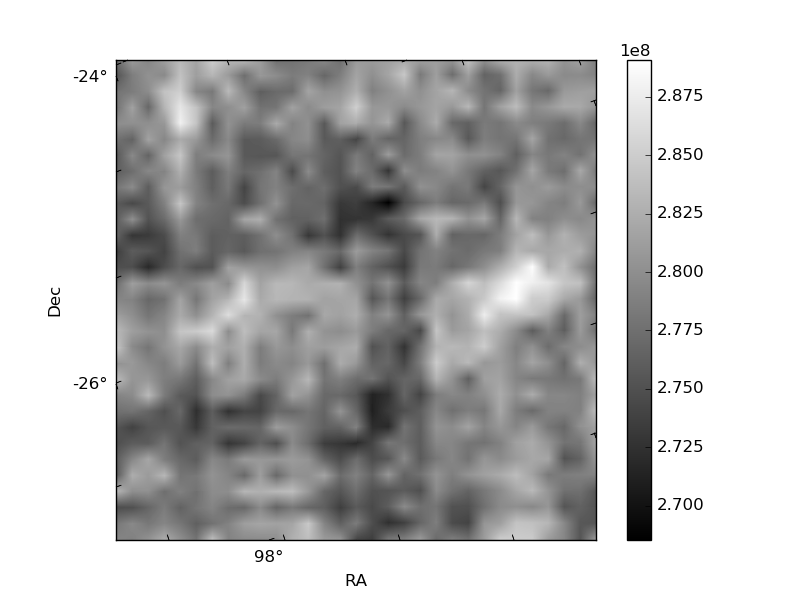
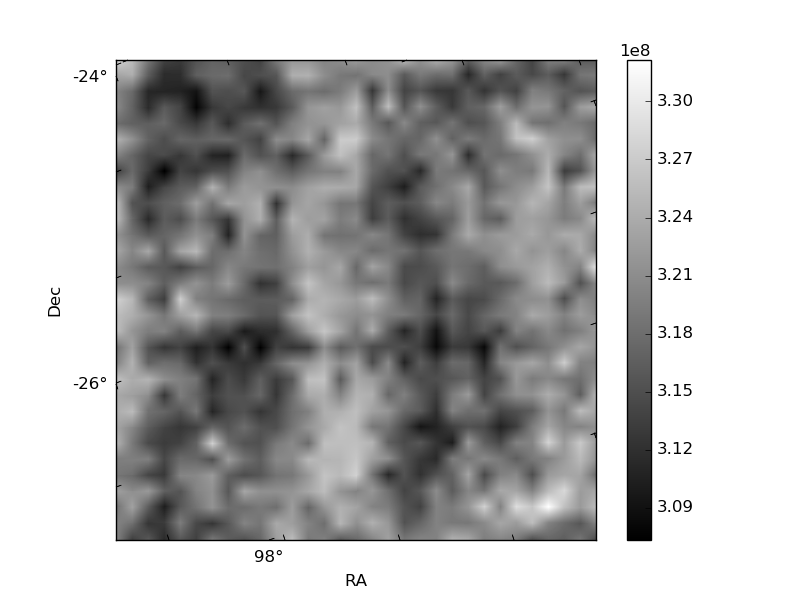
Histogram calculated using DETX and DETY for each event in the final _common_clean file
| Quadrant A | 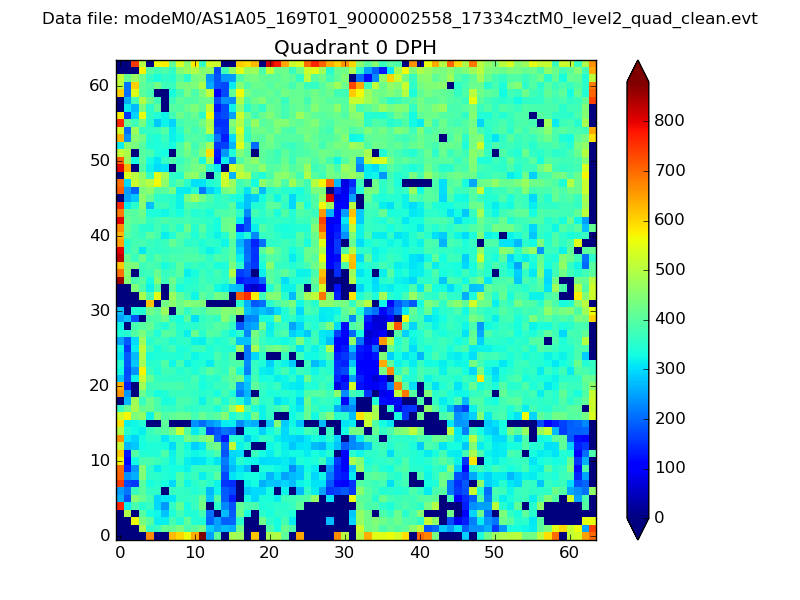 |
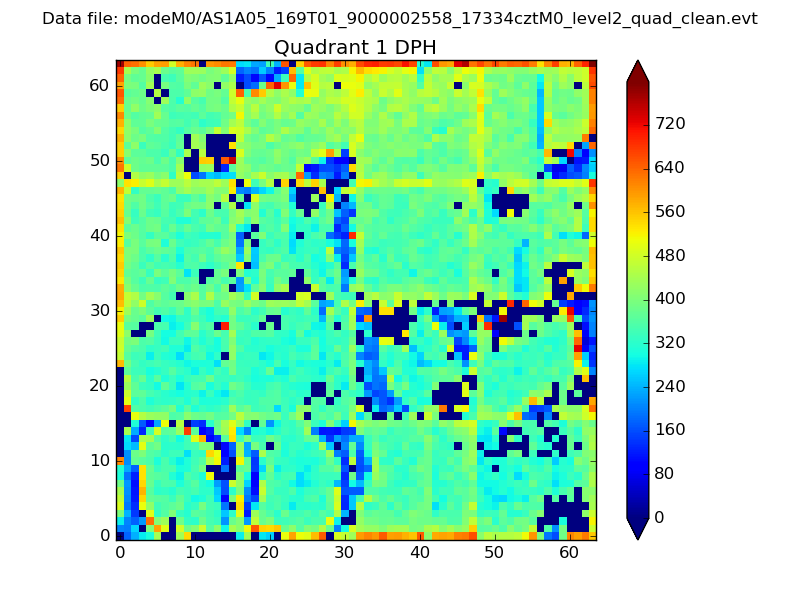 |
Quadrant B |
|---|---|---|---|
| Quadrant D | 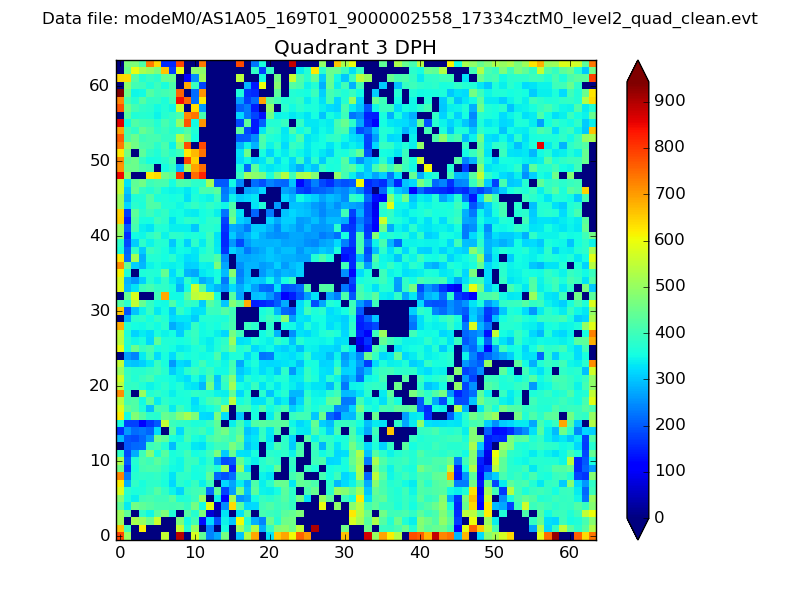 |
 |
Quadrant C |
| Plot type | Count rate plots | Images |
|---|---|---|
| Comparison with Poisson distribution Blue bars denote a histogram of data divided into 1 sec bins. Red curve is a Poisson curve with rate = median count rate of data. |
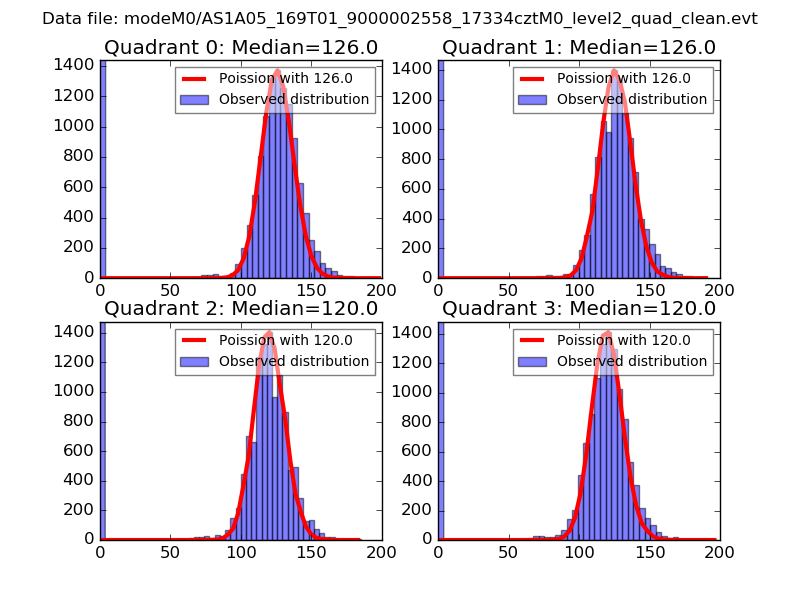 |
 |
| Quadrant-wise count rates Data is divided into 100 sec bins |
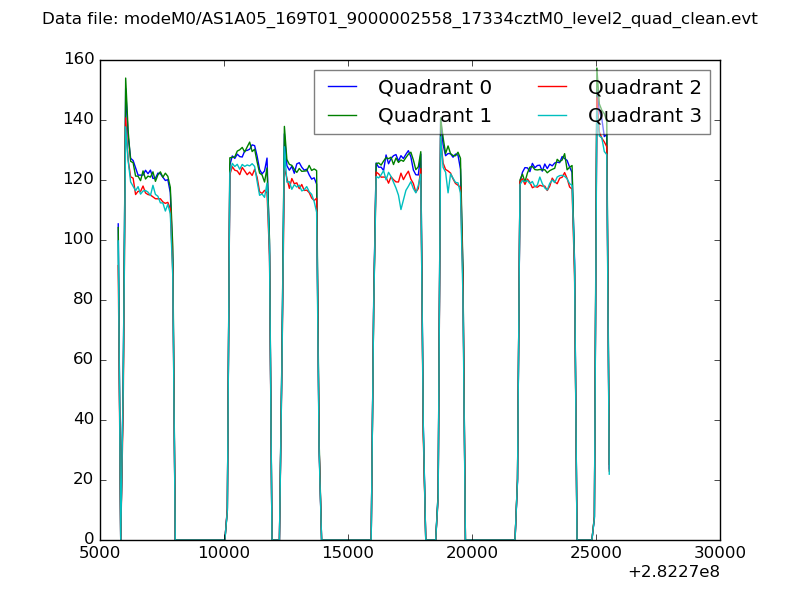 |
|
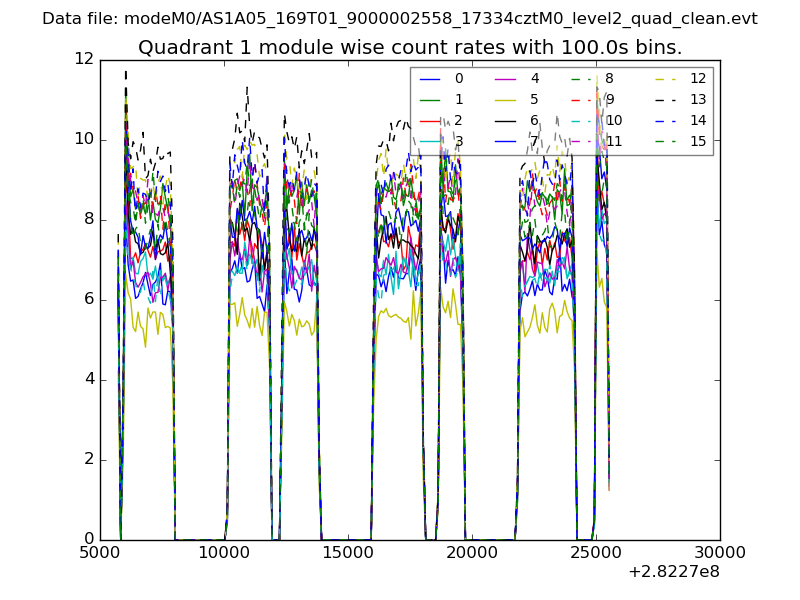
| Module-wise count rates for Quadrant A Data is divided into 100 sec bins |
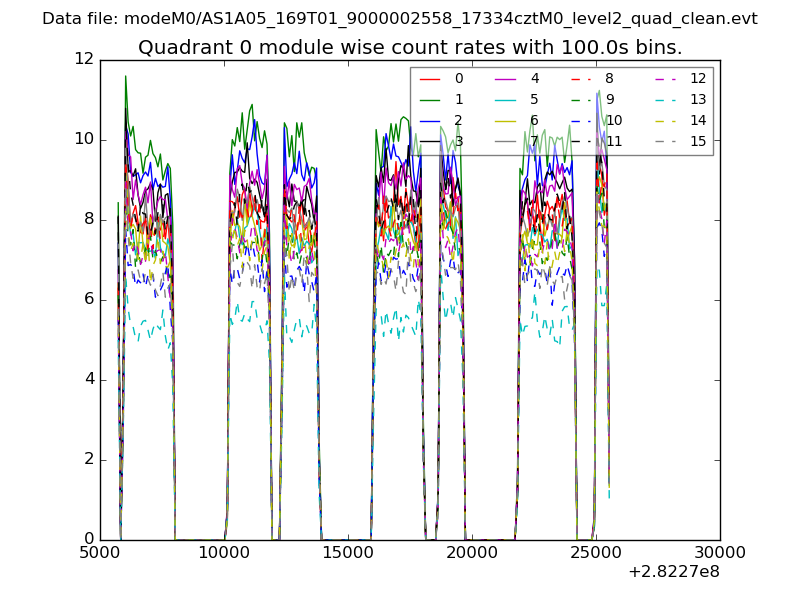 |
 |
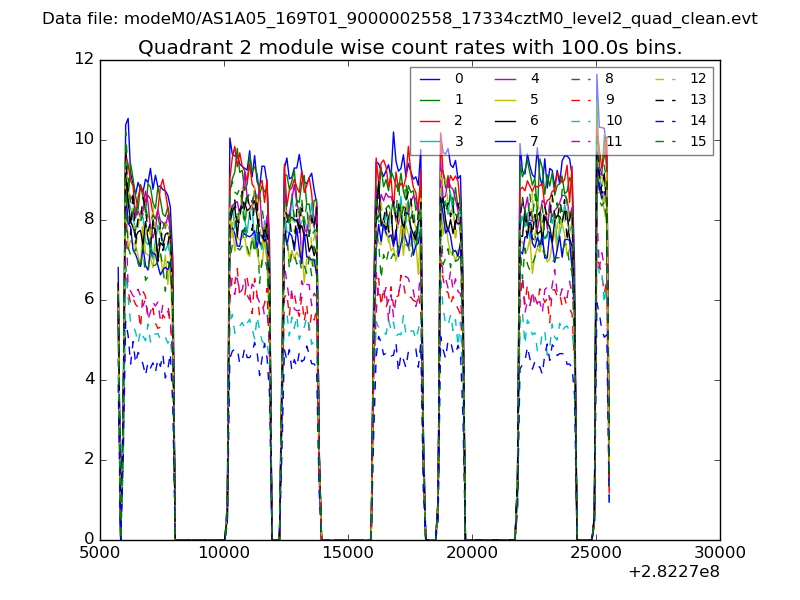
| Module-wise count rates for Quadrant B Data is divided into 100 sec bins |
 |
 |
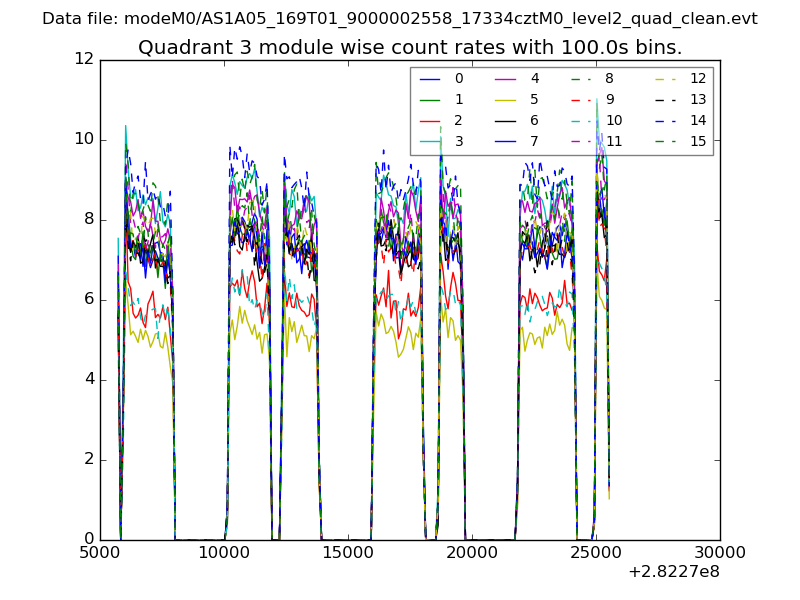
| Module-wise count rates for Quadrant C Data is divided into 100 sec bins |
 |
 |
| Module-wise count rates for Quadrant D Data is divided into 100 sec bins |
 |
 |
| Parameter | Plot |
|---|---|
| CZT HV Monitor | 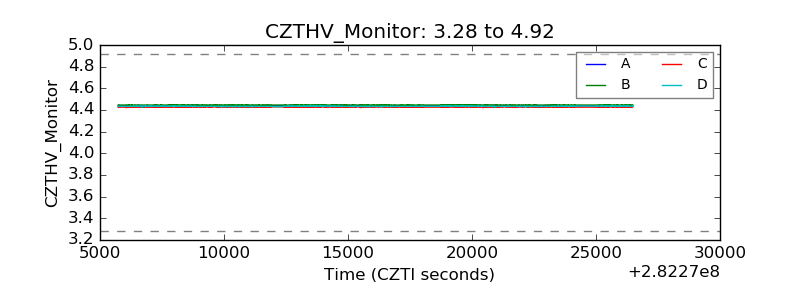 |
| D_VDD | 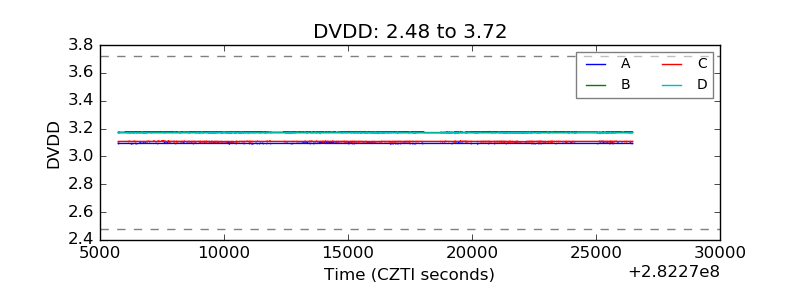 |
| Temperature 1 | 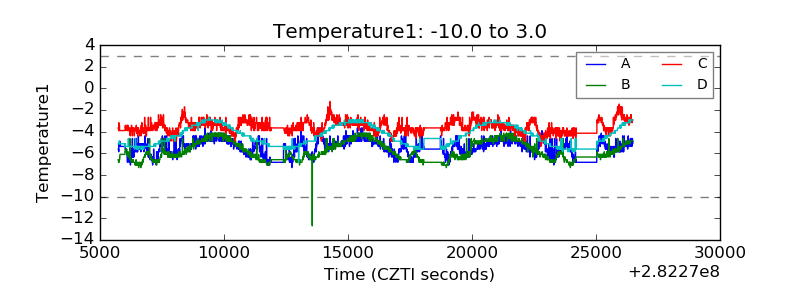 |
| Veto HV Monitor | 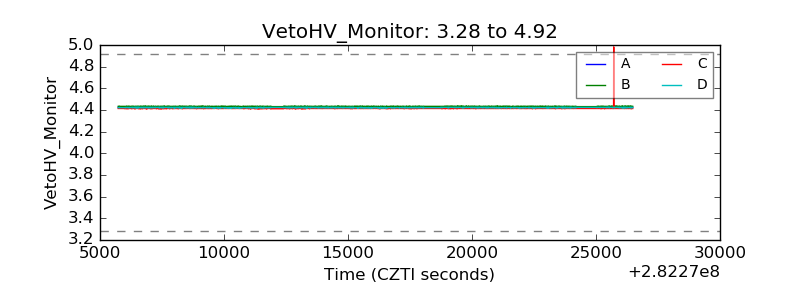 |
| Veto LLD | 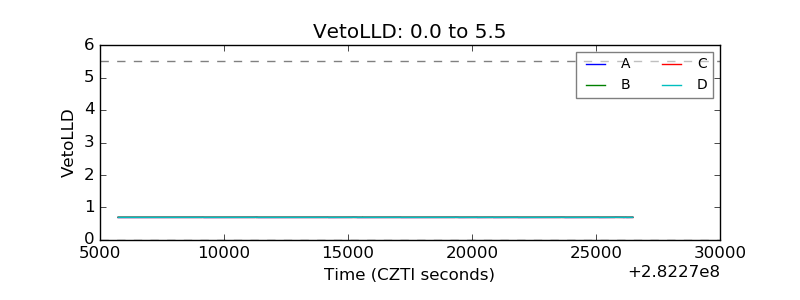 |
| Alpha Counter | 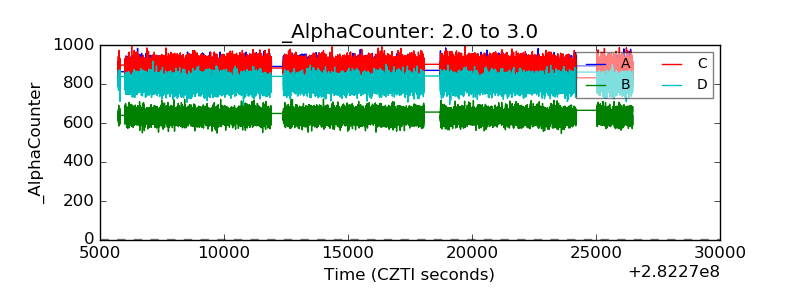 |
| _CPM_Rate | 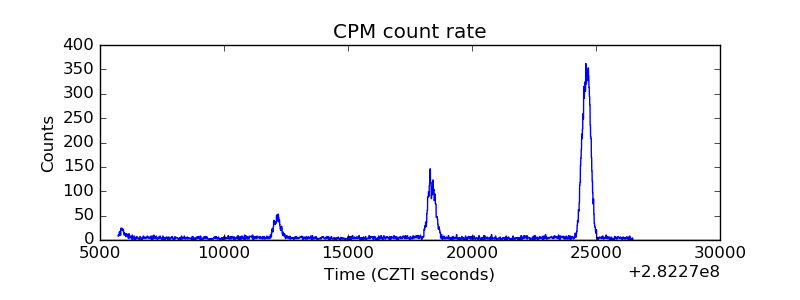 |
| CZT Counter | 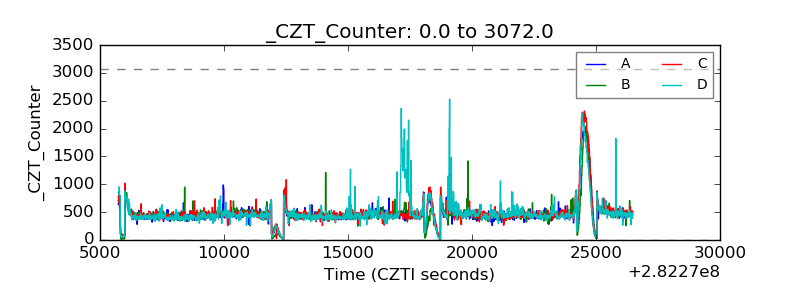 |
| +2.5 Volts monitor |  |
| +5 Volts monitor |  |
| _ROLL_ROT | 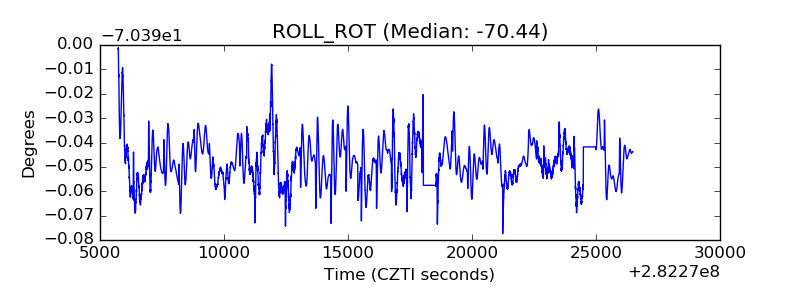 |
| _Roll_DEC | 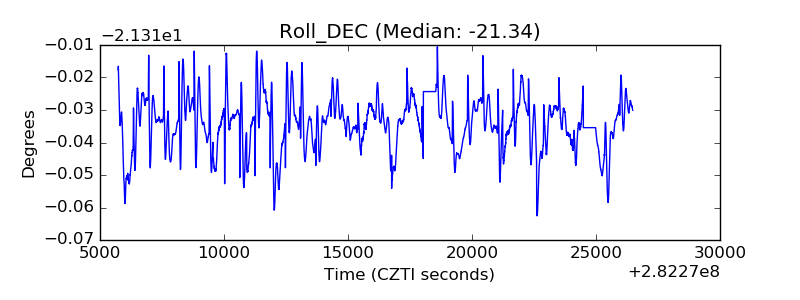 |
| _Roll_RA | 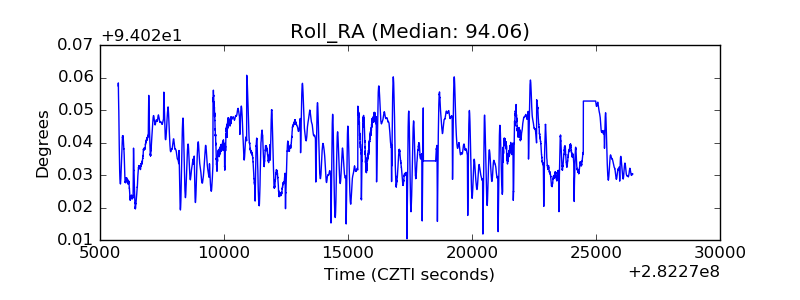 |
| Veto Counter | 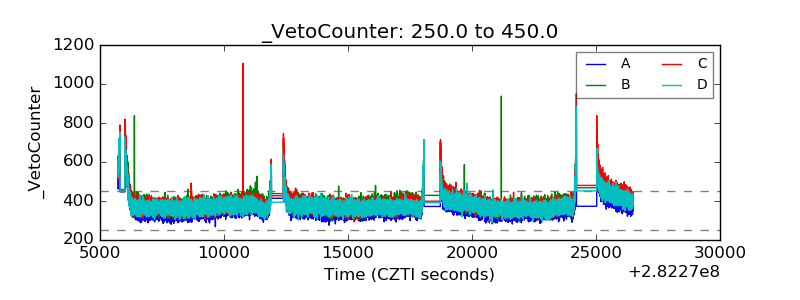 |