| Param | Original file | Final file |
|---|---|---|
| Filename | modeM0/AS1A05_169T01_9000002558_17337cztM0_level2.evt | modeM0/AS1A05_169T01_9000002558_17337cztM0_level2_quad_clean.evt |
| Size (bytes) | 434,819,520 | 64,558,080 |
| Size | 414.7 MB | 61.6 MB |
| Events in quadrant A | 3,151,983 | 385,117 |
| Events in quadrant B | 3,212,519 | 384,684 |
| Events in quadrant C | 3,232,029 | 367,421 |
| Events in quadrant D | 3,135,882 | 369,824 |
| Mode SS | |||
|---|---|---|---|
| Quadrant | BADHDUFLAG | Total packets | Discarded packets |
| A | 0 | 130 | 0 |
| B | 0 | 130 | 0 |
| C | 0 | 130 | 0 |
| D | 0 | 130 | 0 |
| Mode M0 | |||
|---|---|---|---|
| Quadrant | BADHDUFLAG | Total packets | Discarded packets |
| A | 0 | 13567 | 2 |
| B | 0 | 13677 | 2 |
| C | 0 | 13844 | 2 |
| D | 0 | 13709 | 2 |
| Mode M9 | |||
|---|---|---|---|
| Quadrant | BADHDUFLAG | Total packets | Discarded packets |
| A | 0 | 16 | 0 |
| B | 0 | 17 | 0 |
| C | 0 | 17 | 0 |
| D | 0 | 17 | 0 |
| Quadrant | Total seconds | Saturated seconds | Saturation percentage |
|---|---|---|---|
| A | 6416 | 71 | 1.106608% |
| B | 6416 | 81 | 1.262469% |
| C | 6416 | 112 | 1.745636% |
| D | 6416 | 71 | 1.106608% |
Noise dominated data is calculated using 1-second bins in cleaned event files. If a bin has >2000 counts, and if more than 50% of those come from <1% of pixels, then it is considered to be noise-dominated and hence unusable.
| Quadrant | # 1 sec bins | Bins with >0 counts | Bins with >2000 counts | High rate bins dominated by noise | Noise dominated (total time) | Noise dominated (detector-on time) | Marked lightcurve |
|---|---|---|---|---|---|---|---|
| A | 7526 | 6416 | 0 | 0 | 0.00% | 0.00% | 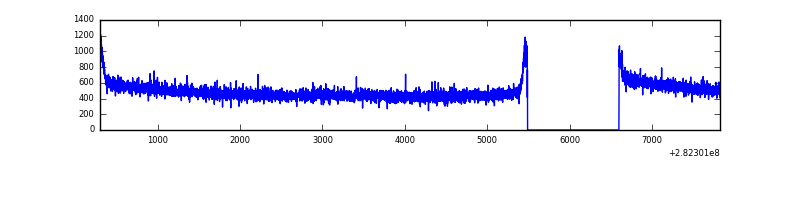 |
| B | 7526 | 6417 | 1 | 1 | 0.01% | 0.02% | 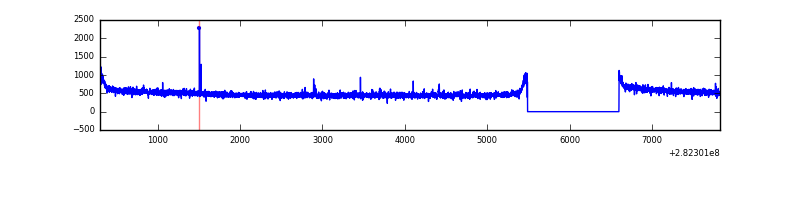 |
| C | 7526 | 6417 | 0 | 0 | 0.00% | 0.00% | 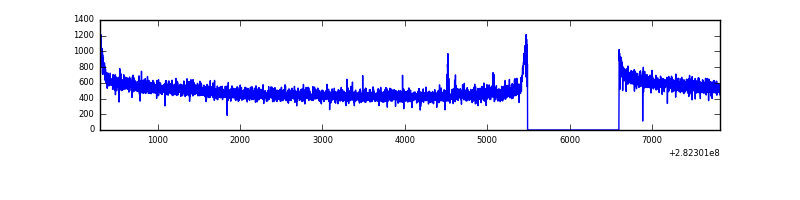 |
| D | 7526 | 6417 | 11 | 11 | 0.15% | 0.17% | 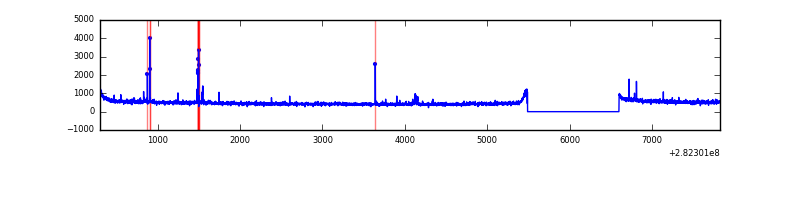 |
Top three noisy pixels from each quadrant. If the there are fewer than three noisy pixels in the level2.evt file, extra rows are filled as -1
| Pixel properties | Quadrant properties | ||||||
|---|---|---|---|---|---|---|---|
| Quadrant | DetID | PixID | Counts | Sigma | Mean | Median | Sigma |
| A | 0 | 226 | 7112 | 38.51 | 820 | 803 | 163.8 |
| A | 3 | 137 | 6027 | 31.89 | 820 | 803 | 163.8 |
| A | 12 | 194 | 5711 | 29.96 | 820 | 803 | 163.8 |
| B | 12 | 111 | 19030 | 117.05 | 818 | 797 | 155.8 |
| B | 11 | 111 | 16548 | 101.12 | 818 | 797 | 155.8 |
| B | 14 | 111 | 15281 | 92.99 | 818 | 797 | 155.8 |
| C | 14 | 238 | 124677 | 666.8 | 792 | 796 | 185.8 |
| C | 3 | 233 | 21869 | 113.43 | 792 | 796 | 185.8 |
| C | 13 | 61 | 5549 | 25.58 | 792 | 796 | 185.8 |
| D | 2 | 152 | 54223 | 274.31 | 800 | 776 | 194.8 |
| D | 2 | 234 | 21435 | 106.03 | 800 | 776 | 194.8 |
| D | 5 | 222 | 20380 | 100.62 | 800 | 776 | 194.8 |
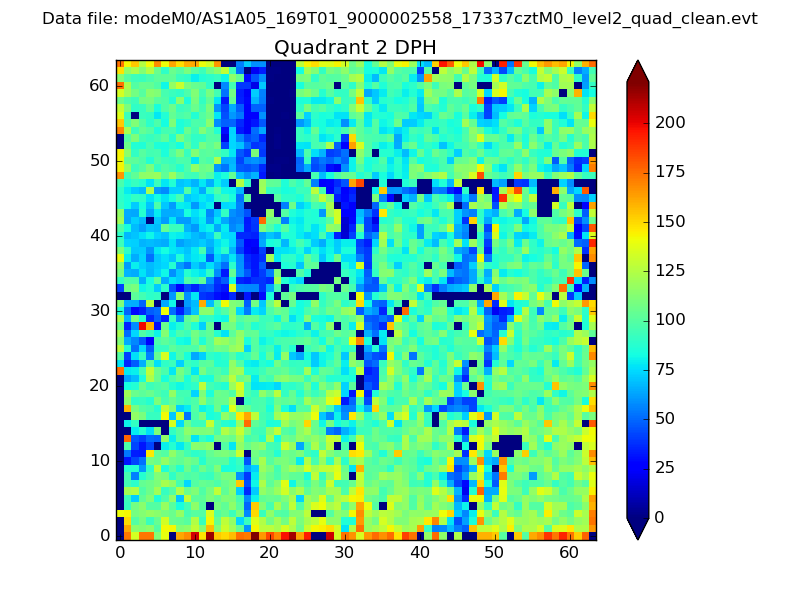
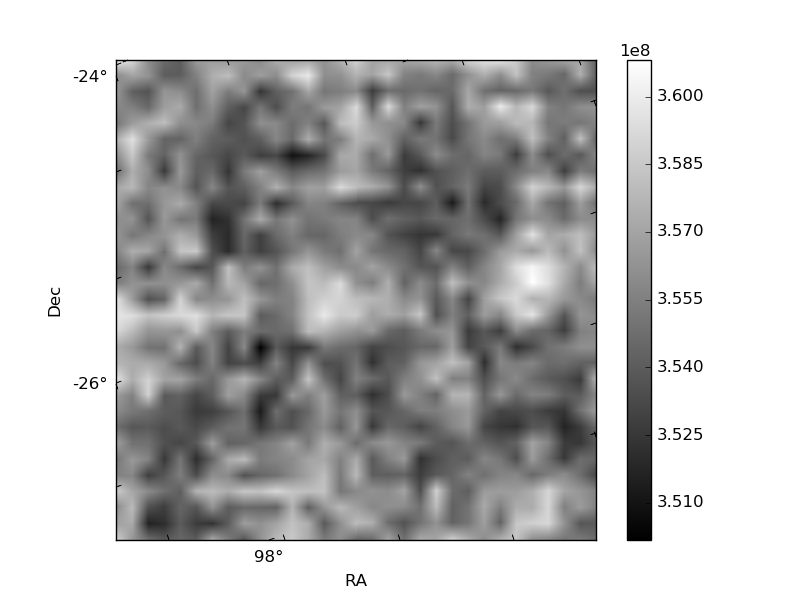
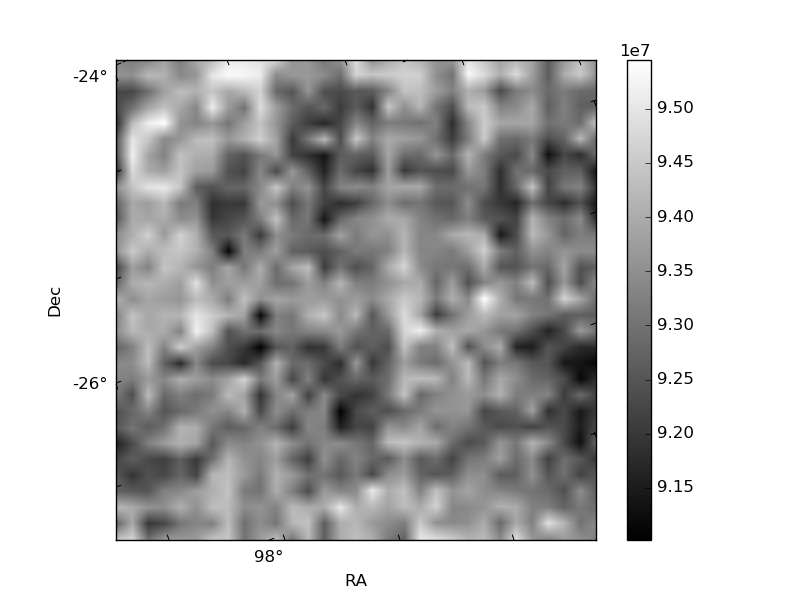
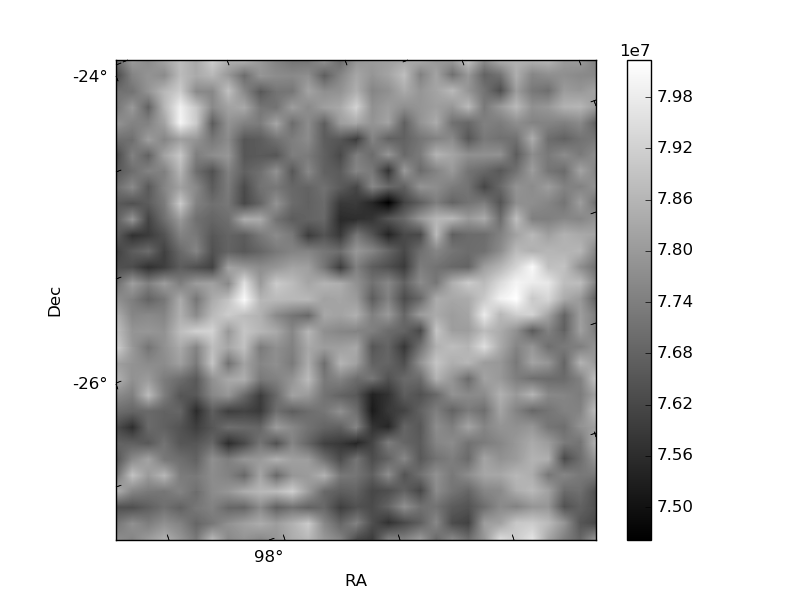
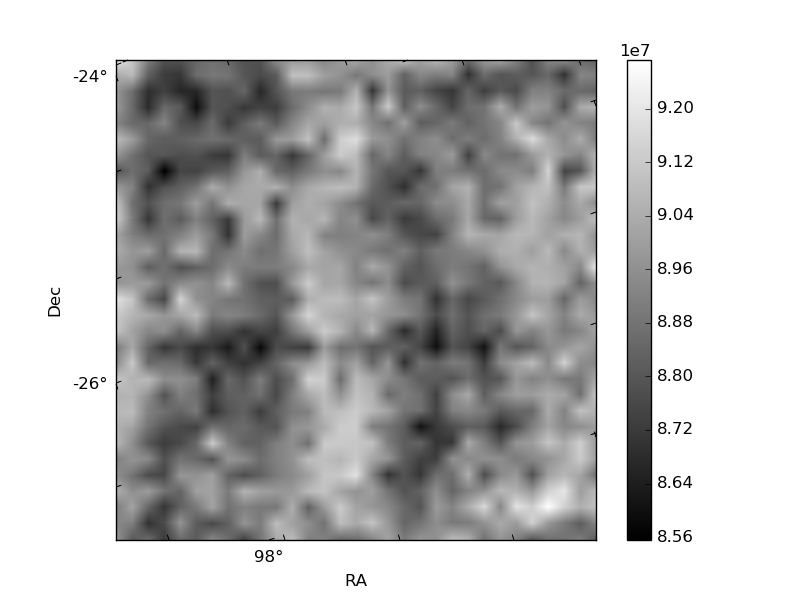
Histogram calculated using DETX and DETY for each event in the final _common_clean file
| Quadrant A | 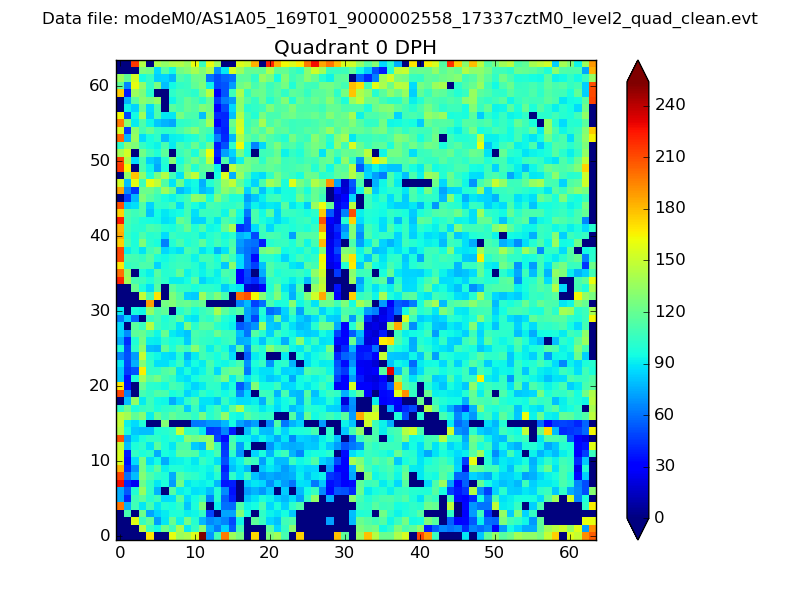 |
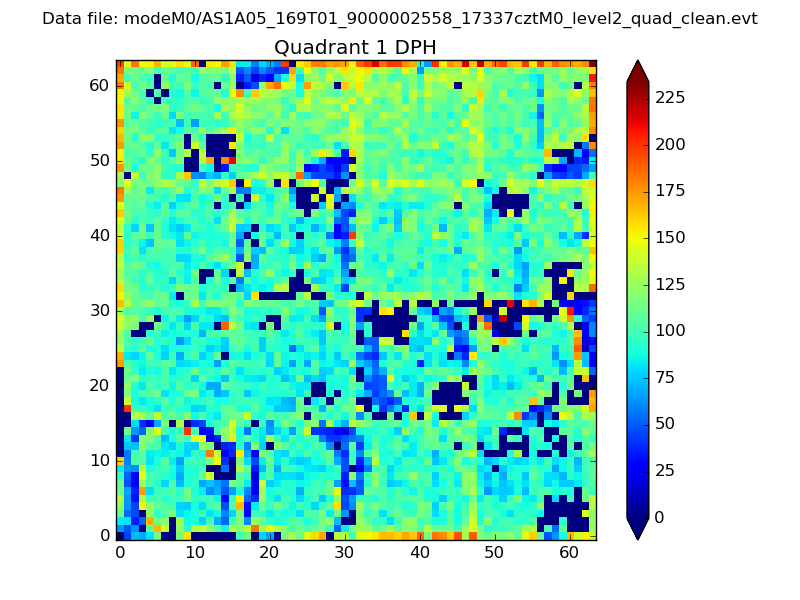 |
Quadrant B |
|---|---|---|---|
| Quadrant D | 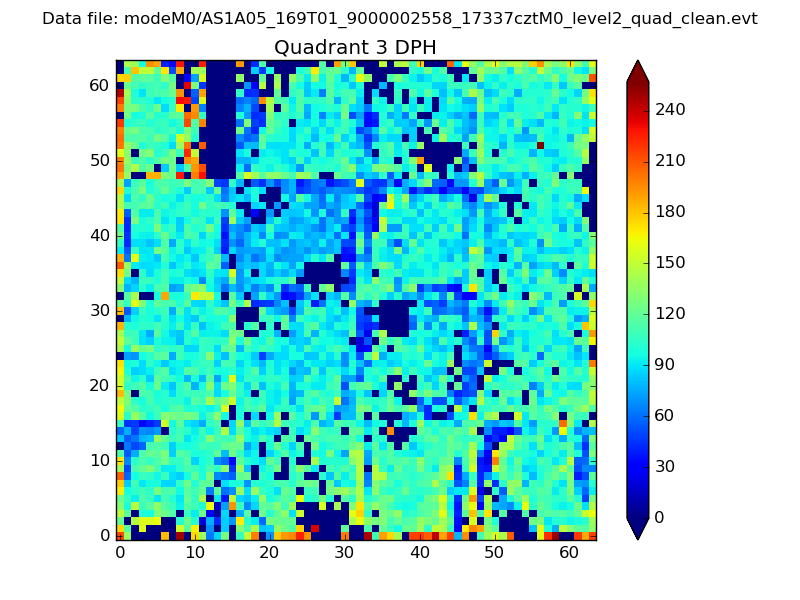 |
 |
Quadrant C |
| Plot type | Count rate plots | Images |
|---|---|---|
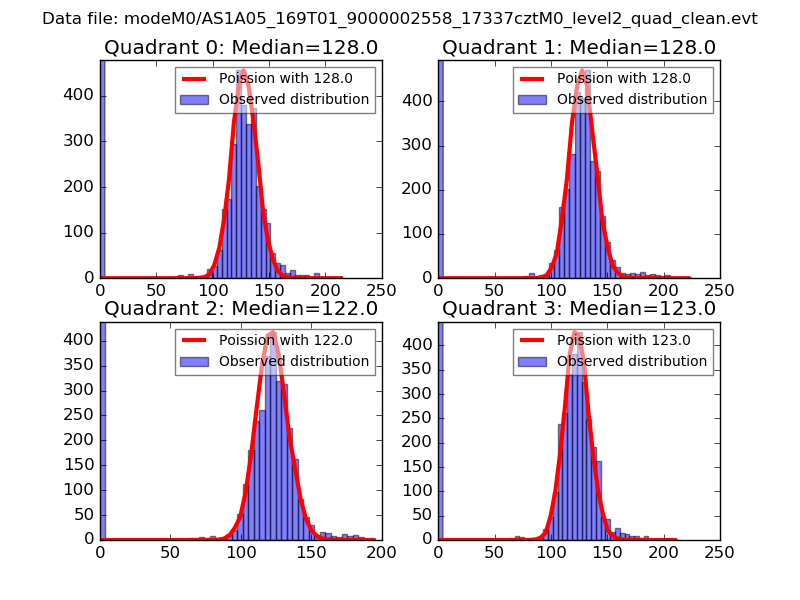
| Comparison with Poisson distribution Blue bars denote a histogram of data divided into 1 sec bins. Red curve is a Poisson curve with rate = median count rate of data. |
 |
 |
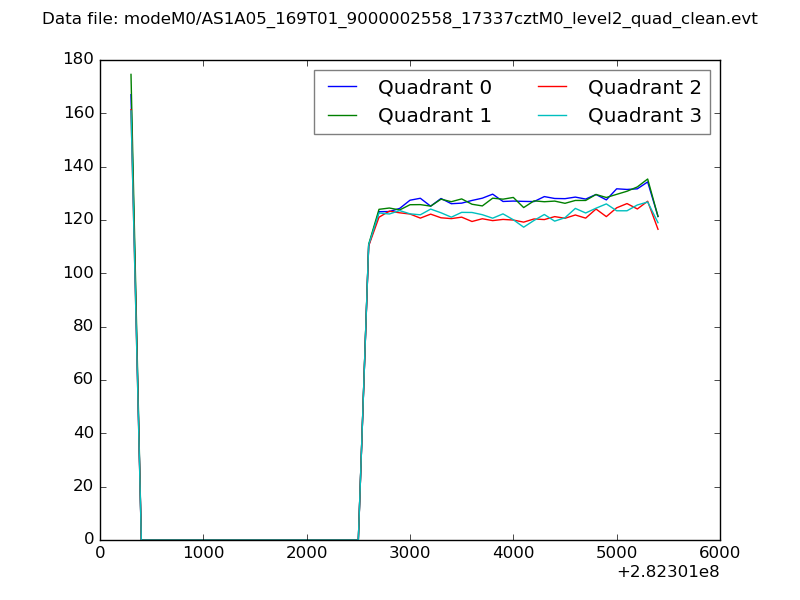
| Quadrant-wise count rates Data is divided into 100 sec bins |
 |
|
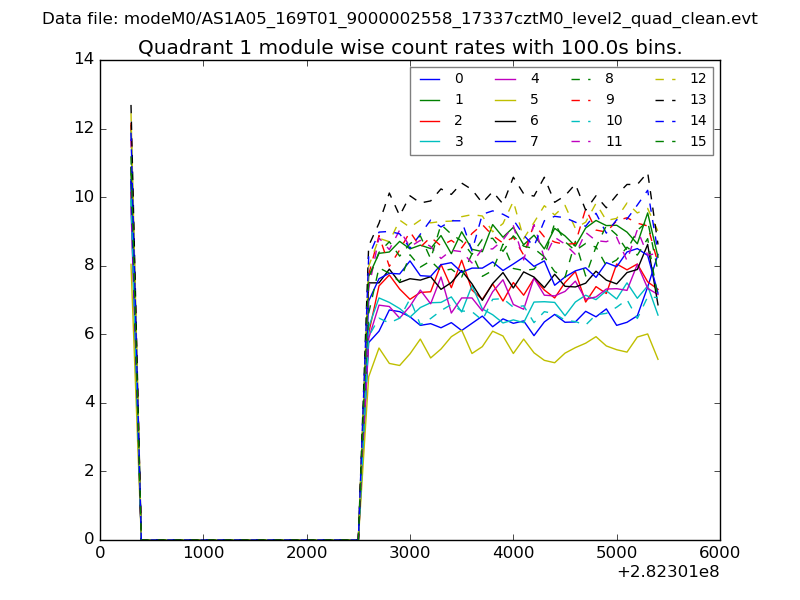
| Module-wise count rates for Quadrant A Data is divided into 100 sec bins |
 |
 |
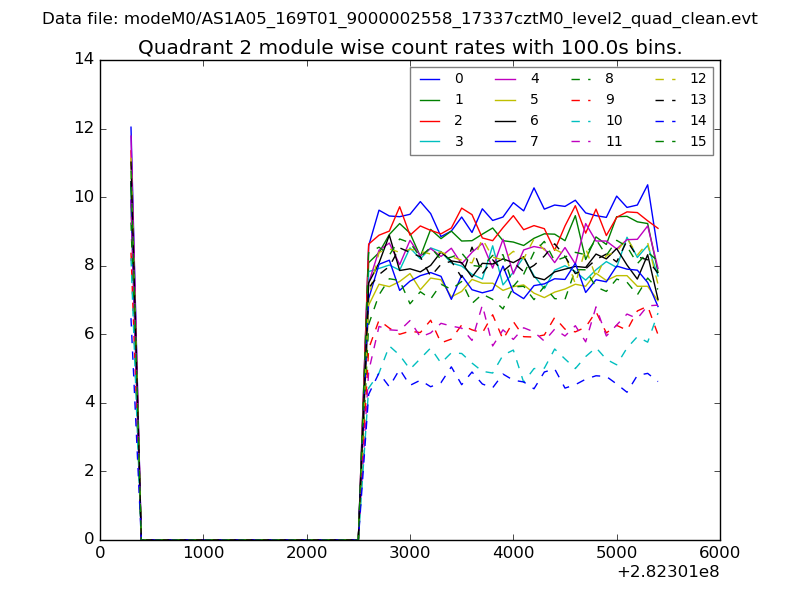
| Module-wise count rates for Quadrant B Data is divided into 100 sec bins |
 |
 |
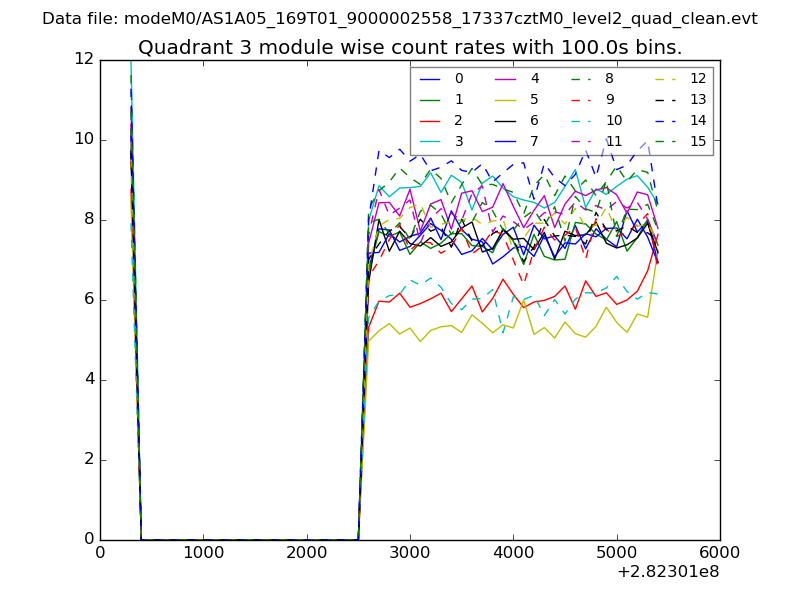
| Module-wise count rates for Quadrant C Data is divided into 100 sec bins |
 |
 |
| Module-wise count rates for Quadrant D Data is divided into 100 sec bins |
 |
 |
| Parameter | Plot |
|---|---|
| CZT HV Monitor |  |
| D_VDD | 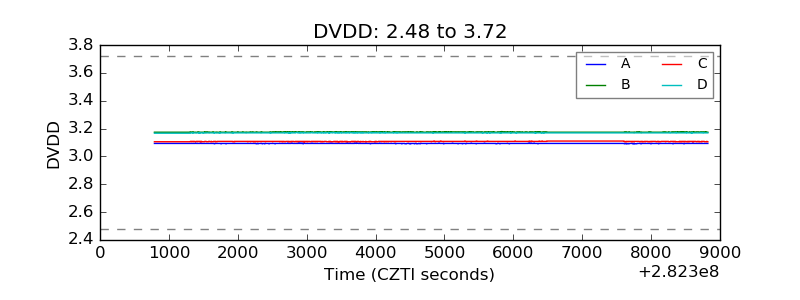 |
| Temperature 1 | 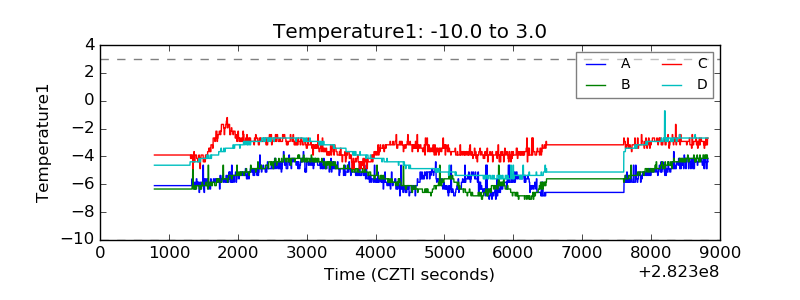 |
| Veto HV Monitor | 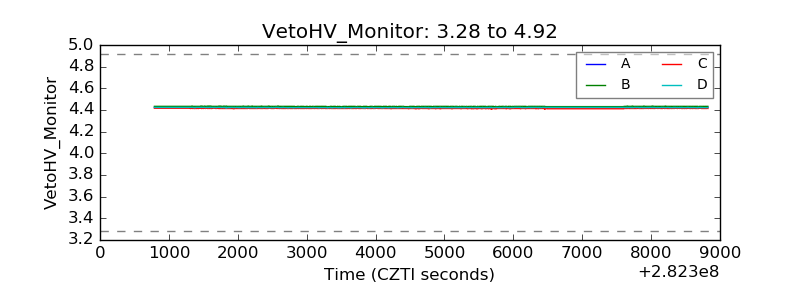 |
| Veto LLD |  |
| Alpha Counter | 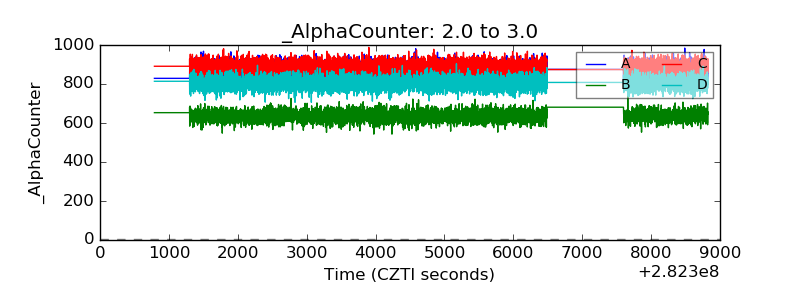 |
| _CPM_Rate | 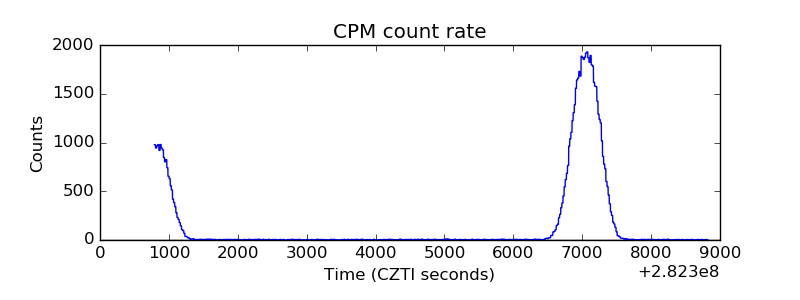 |
| CZT Counter | 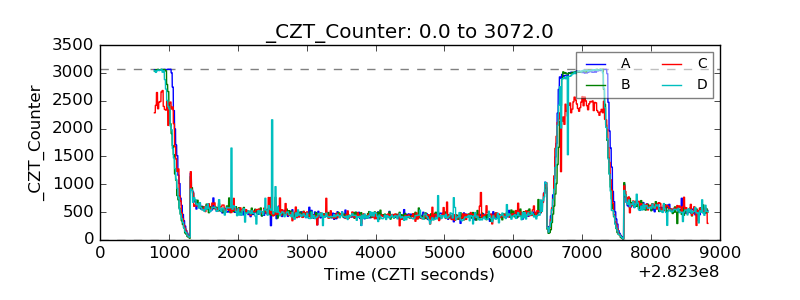 |
| +2.5 Volts monitor | 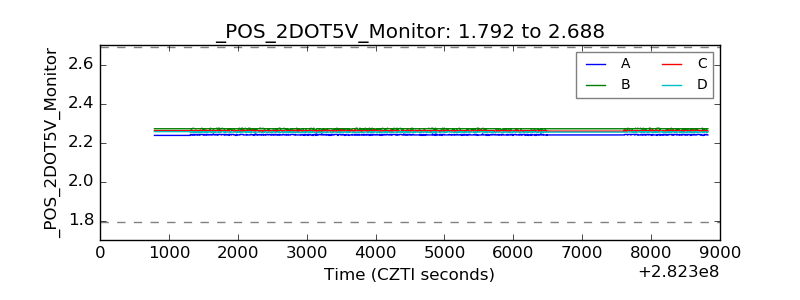 |
| +5 Volts monitor |  |
| _ROLL_ROT |  |
| _Roll_DEC | 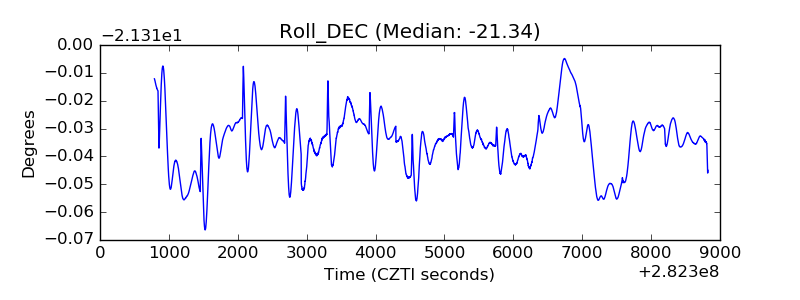 |
| _Roll_RA | 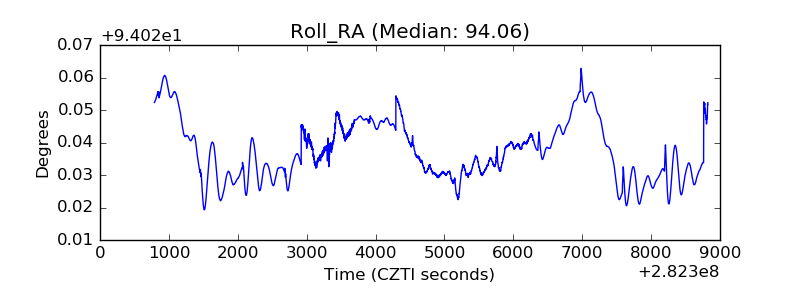 |
| Veto Counter |  |