| Param | Original file | Final file |
|---|---|---|
| Filename | modeM0/AS1A05_169T01_9000002558_17338cztM0_level2.evt | modeM0/AS1A05_169T01_9000002558_17338cztM0_level2_quad_clean.evt |
| Size (bytes) | 501,672,960 | 68,970,240 |
| Size | 478.4 MB | 65.8 MB |
| Events in quadrant A | 3,272,136 | 428,136 |
| Events in quadrant B | 3,340,988 | 429,968 |
| Events in quadrant C | 3,358,269 | 406,698 |
| Events in quadrant D | 4,789,970 | 379,495 |
| Mode SS | |||
|---|---|---|---|
| Quadrant | BADHDUFLAG | Total packets | Discarded packets |
| A | 0 | 128 | 0 |
| B | 0 | 128 | 0 |
| C | 0 | 128 | 0 |
| D | 0 | 128 | 0 |
| Mode M0 | |||
|---|---|---|---|
| Quadrant | BADHDUFLAG | Total packets | Discarded packets |
| A | 0 | 13916 | 3 |
| B | 0 | 14071 | 2 |
| C | 0 | 14232 | 2 |
| D | 0 | 18451 | 2 |
| Mode M9 | |||
|---|---|---|---|
| Quadrant | BADHDUFLAG | Total packets | Discarded packets |
| A | 0 | 20 | 0 |
| B | 0 | 21 | 0 |
| C | 0 | 21 | 0 |
| D | 0 | 21 | 0 |
| Quadrant | Total seconds | Saturated seconds | Saturation percentage |
|---|---|---|---|
| A | 6364 | 68 | 1.068510% |
| B | 6364 | 87 | 1.367065% |
| C | 6364 | 122 | 1.917033% |
| D | 6364 | 481 | 7.558140% |
Noise dominated data is calculated using 1-second bins in cleaned event files. If a bin has >2000 counts, and if more than 50% of those come from <1% of pixels, then it is considered to be noise-dominated and hence unusable.
| Quadrant | # 1 sec bins | Bins with >0 counts | Bins with >2000 counts | High rate bins dominated by noise | Noise dominated (total time) | Noise dominated (detector-on time) | Marked lightcurve |
|---|---|---|---|---|---|---|---|
| A | 7569 | 6364 | 0 | 0 | 0.00% | 0.00% | 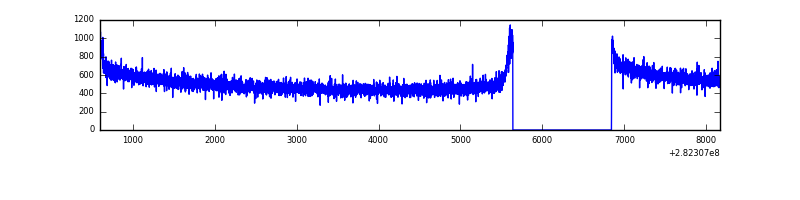 |
| B | 7569 | 6365 | 0 | 0 | 0.00% | 0.00% | 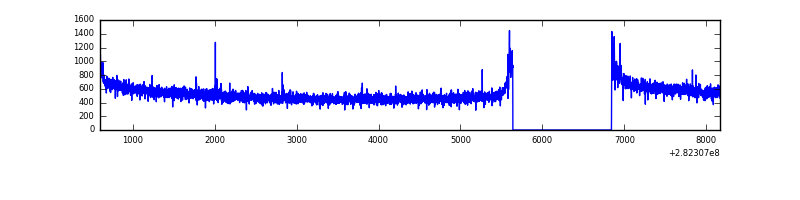 |
| C | 7569 | 6365 | 0 | 0 | 0.00% | 0.00% | 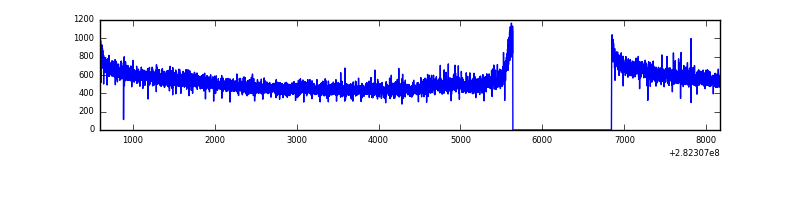 |
| D | 7569 | 6364 | 366 | 366 | 4.84% | 5.75% | 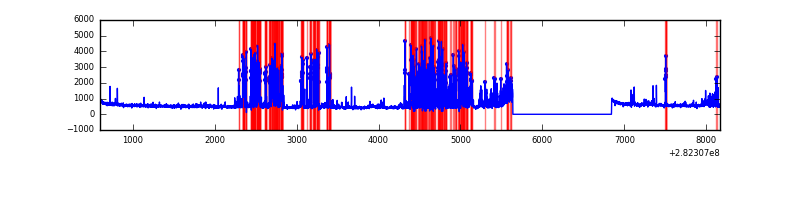 |
Top three noisy pixels from each quadrant. If the there are fewer than three noisy pixels in the level2.evt file, extra rows are filled as -1
| Pixel properties | Quadrant properties | ||||||
|---|---|---|---|---|---|---|---|
| Quadrant | DetID | PixID | Counts | Sigma | Mean | Median | Sigma |
| A | 0 | 226 | 7494 | 39.41 | 851 | 838 | 168.9 |
| A | 12 | 194 | 6073 | 30.99 | 851 | 838 | 168.9 |
| A | 3 | 137 | 6066 | 30.95 | 851 | 838 | 168.9 |
| B | 12 | 111 | 18958 | 113.81 | 846 | 827 | 159.3 |
| B | 11 | 111 | 16565 | 98.79 | 846 | 827 | 159.3 |
| B | 5 | 207 | 16461 | 98.14 | 846 | 827 | 159.3 |
| C | 14 | 238 | 128051 | 677.21 | 814 | 821 | 187.9 |
| C | 3 | 233 | 54165 | 283.93 | 814 | 821 | 187.9 |
| C | 13 | 61 | 5516 | 24.99 | 814 | 821 | 187.9 |
| D | 5 | 222 | 1668466 | 8630.39 | 800 | 777 | 193.2 |
| D | 2 | 152 | 68144 | 348.63 | 800 | 777 | 193.2 |
| D | 2 | 120 | 21506 | 107.27 | 800 | 777 | 193.2 |
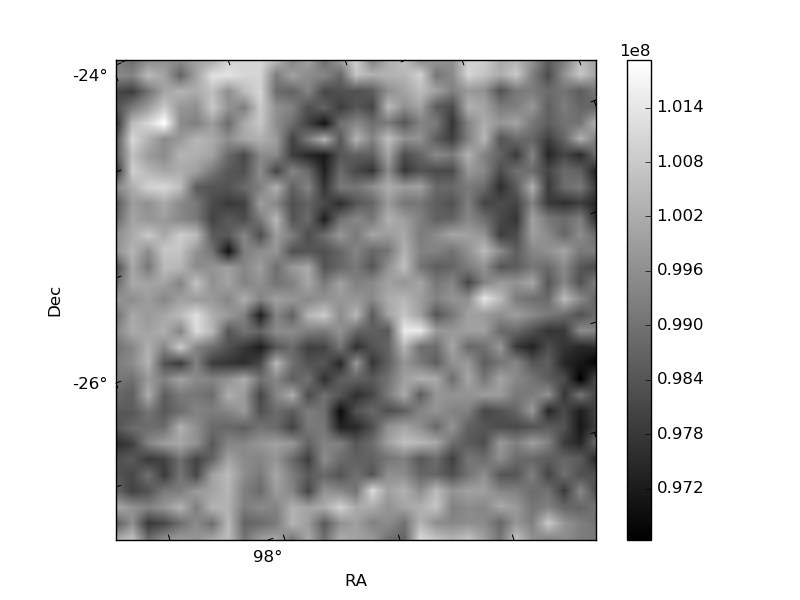
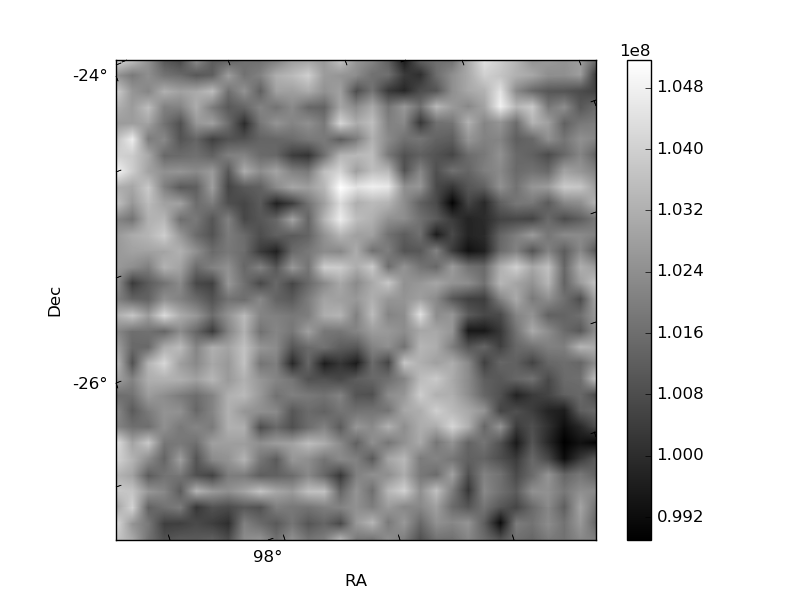
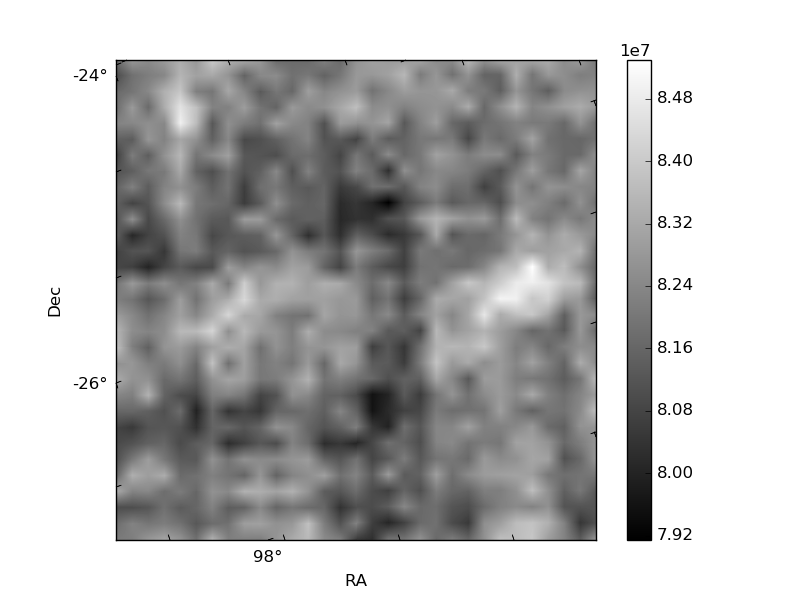
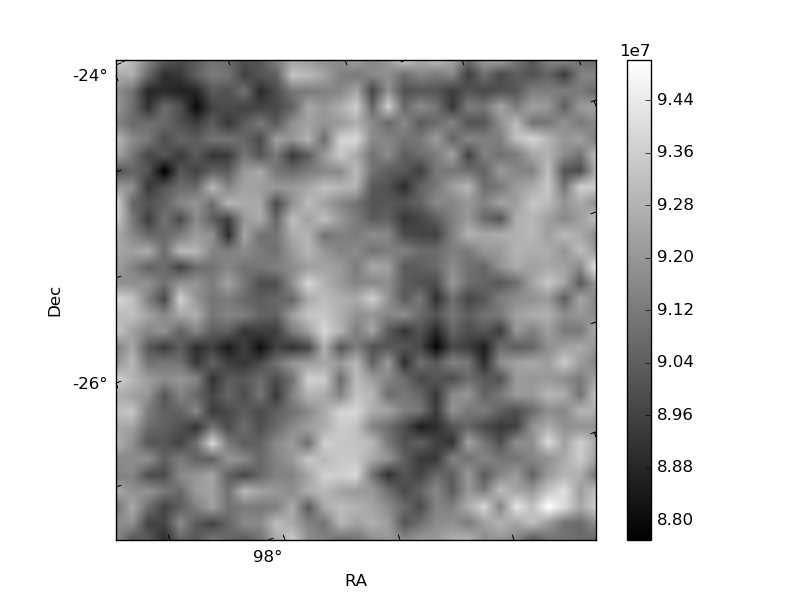
Histogram calculated using DETX and DETY for each event in the final _common_clean file
| Quadrant A | 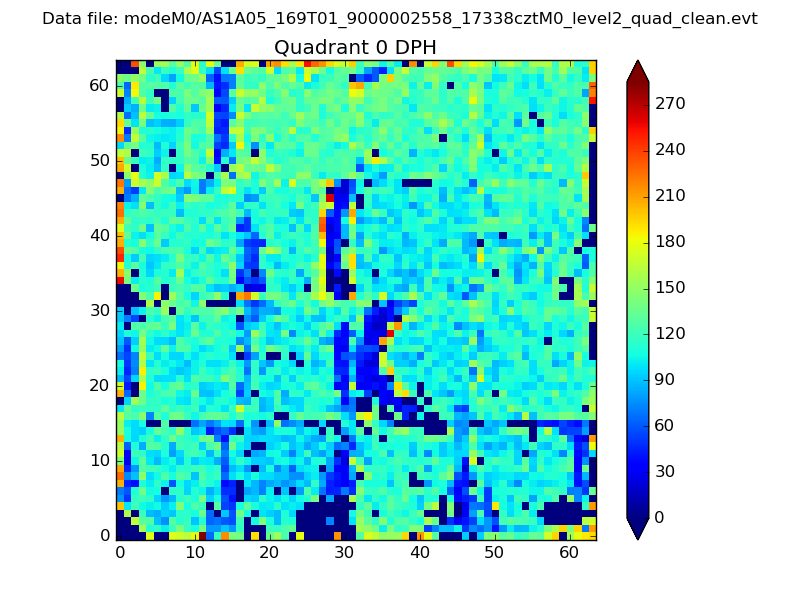 |
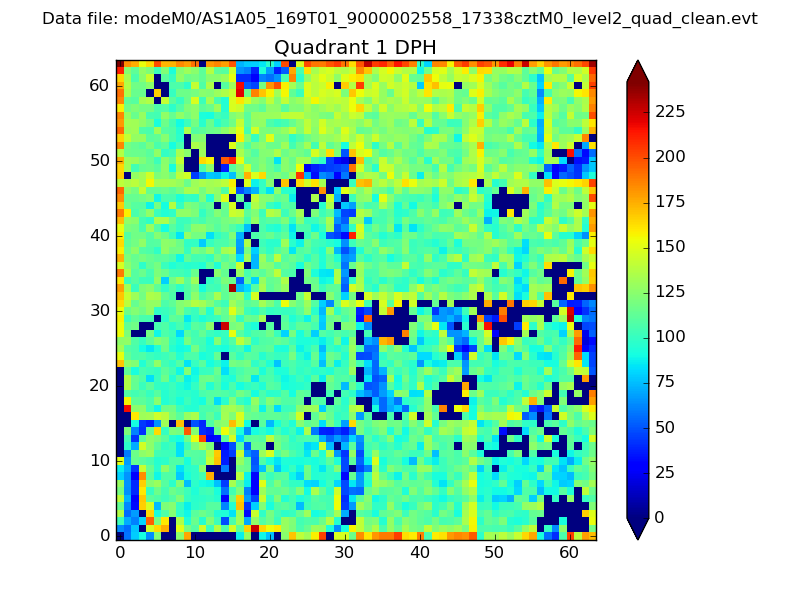 |
Quadrant B |
|---|---|---|---|
| Quadrant D | 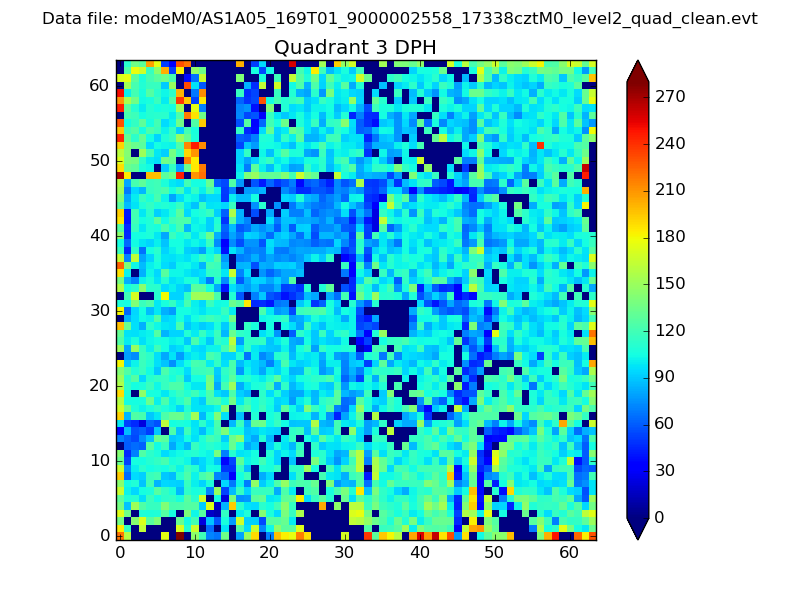 |
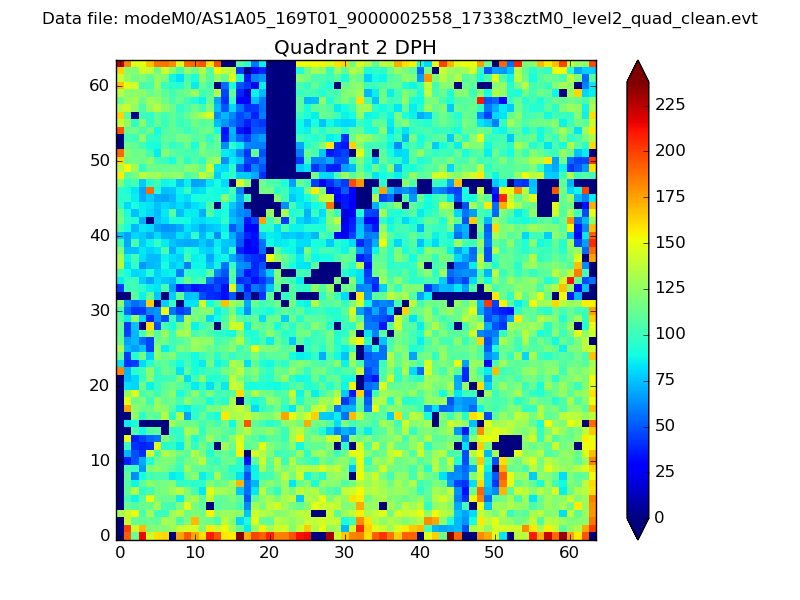 |
Quadrant C |
| Plot type | Count rate plots | Images |
|---|---|---|
| Comparison with Poisson distribution Blue bars denote a histogram of data divided into 1 sec bins. Red curve is a Poisson curve with rate = median count rate of data. |
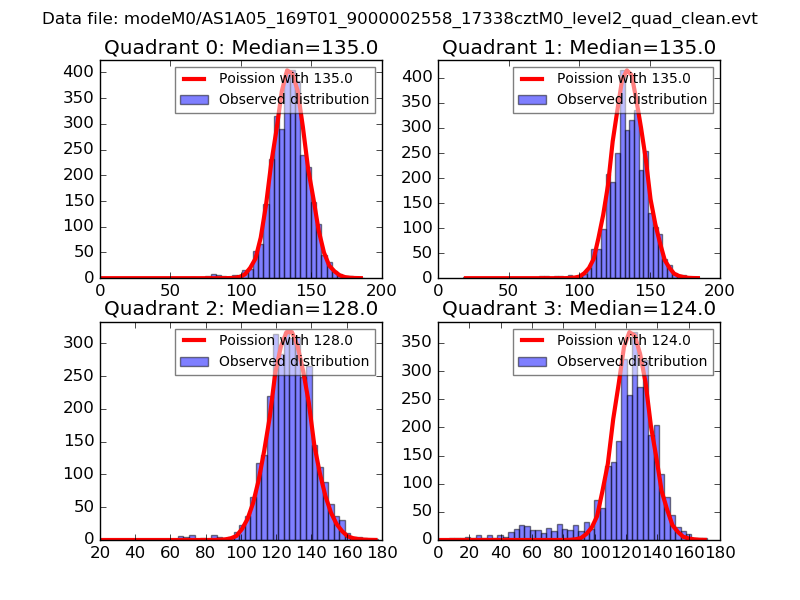 |
 |
| Quadrant-wise count rates Data is divided into 100 sec bins |
 |
|
| Module-wise count rates for Quadrant A Data is divided into 100 sec bins |
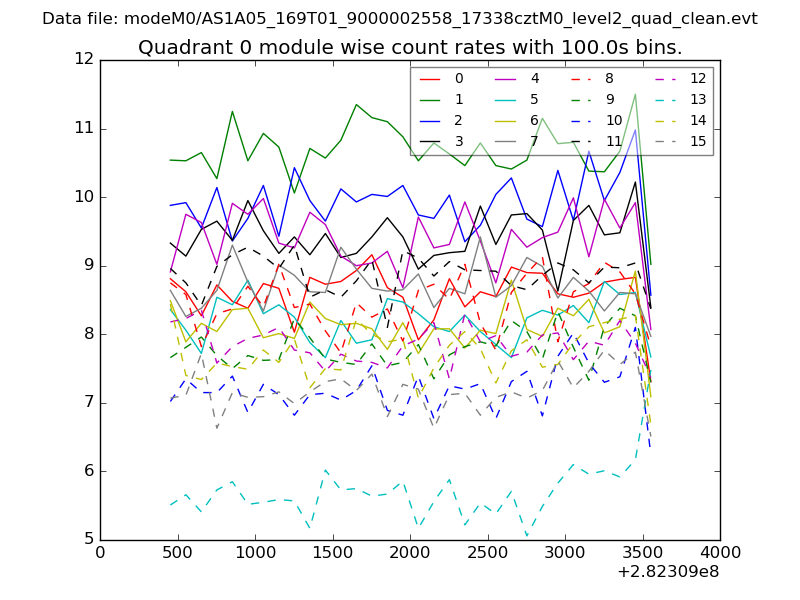 |
 |
| Module-wise count rates for Quadrant B Data is divided into 100 sec bins |
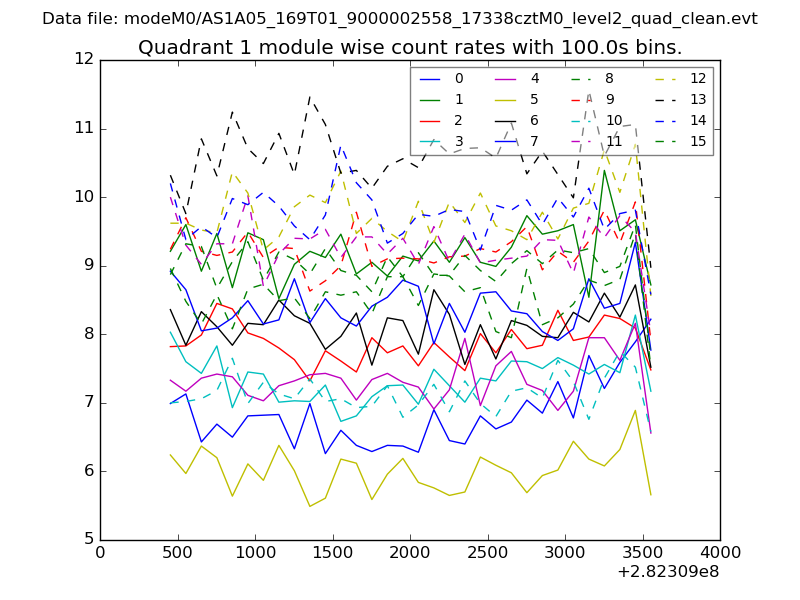 |
 |
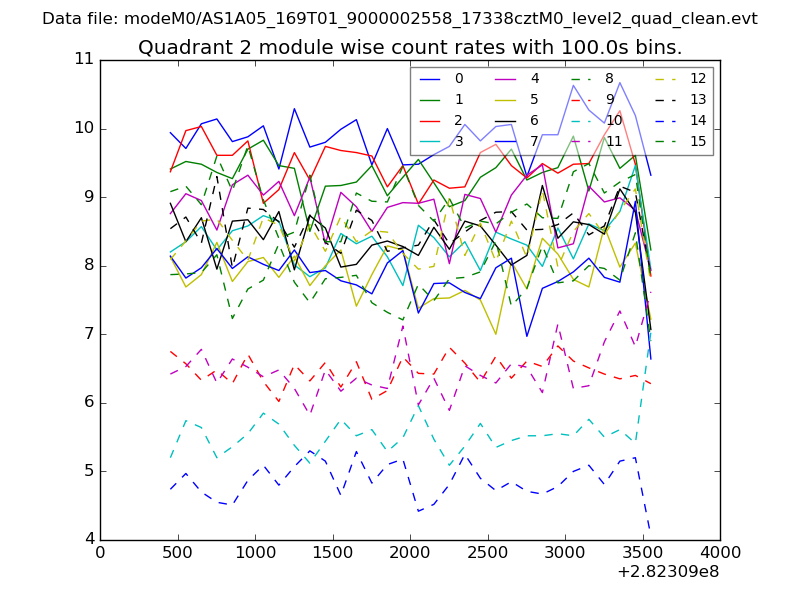
| Module-wise count rates for Quadrant C Data is divided into 100 sec bins |
 |
 |
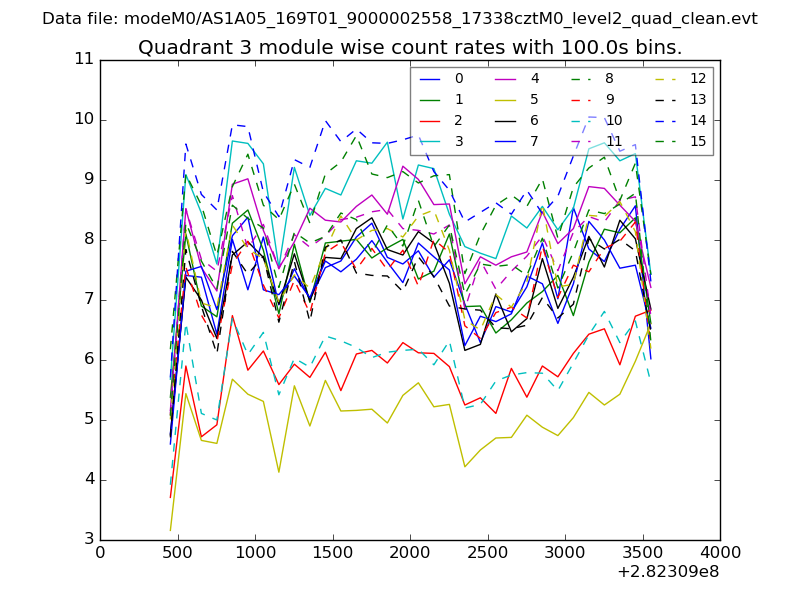
| Module-wise count rates for Quadrant D Data is divided into 100 sec bins |
 |
 |
| Parameter | Plot |
|---|---|
| CZT HV Monitor | 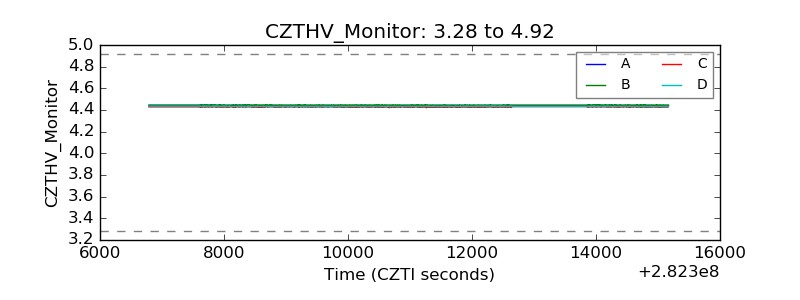 |
| D_VDD | 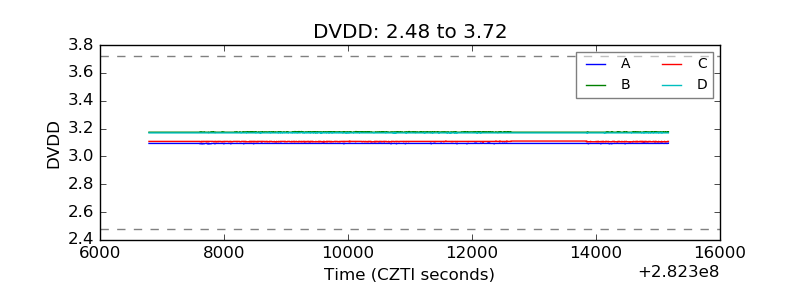 |
| Temperature 1 | 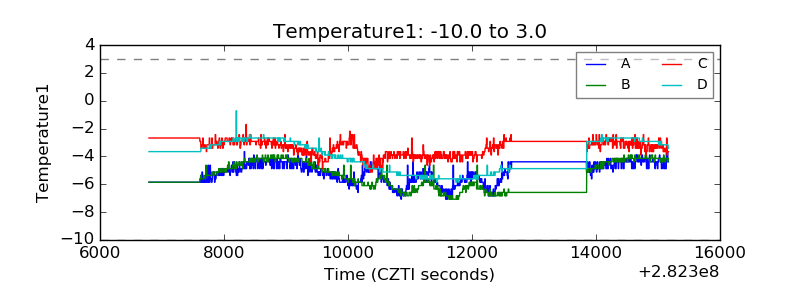 |
| Veto HV Monitor |  |
| Veto LLD | 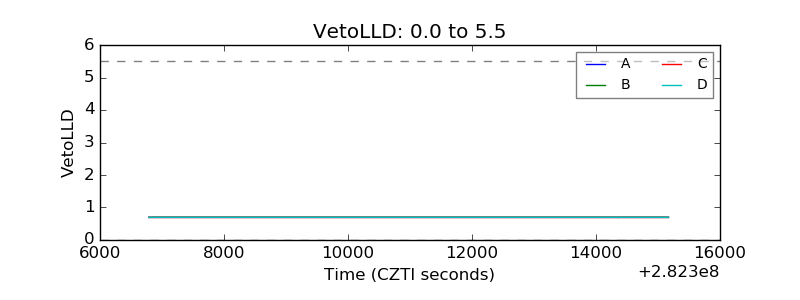 |
| Alpha Counter | 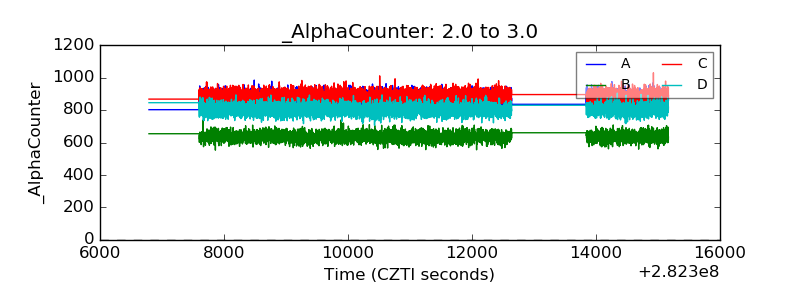 |
| _CPM_Rate | 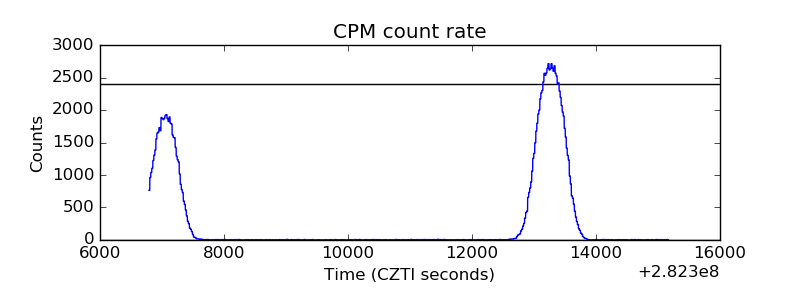 |
| CZT Counter |  |
| +2.5 Volts monitor |  |
| +5 Volts monitor |  |
| _ROLL_ROT | 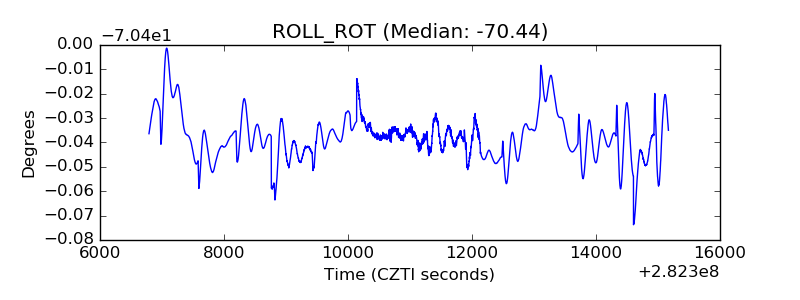 |
| _Roll_DEC |  |
| _Roll_RA | 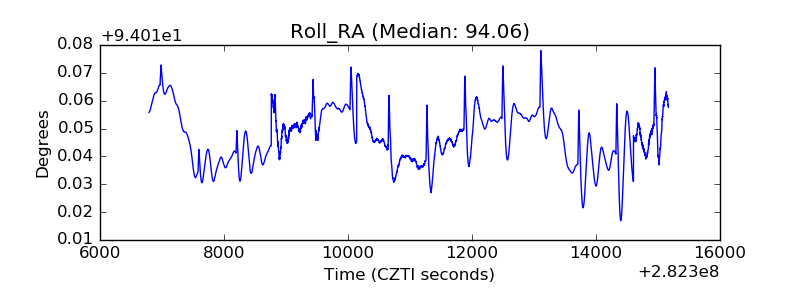 |
| Veto Counter | 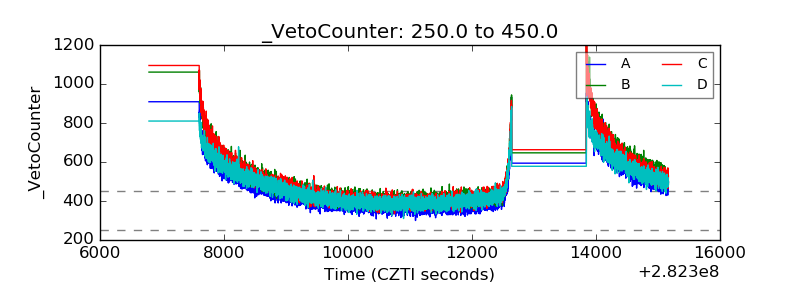 |