| Param | Original file | Final file |
|---|---|---|
| Filename | modeM0/AS1A05_169T01_9000002558_17340cztM0_level2.evt | modeM0/AS1A05_169T01_9000002558_17340cztM0_level2_quad_clean.evt |
| Size (bytes) | 96,154,560 | 30,101,760 |
| Size | 91.7 MB | 28.7 MB |
| Events in quadrant A | 673,834 | 212,544 |
| Events in quadrant B | 685,830 | 214,032 |
| Events in quadrant C | 705,333 | 196,437 |
| Events in quadrant D | 746,430 | 181,521 |
| Mode SS | |||
|---|---|---|---|
| Quadrant | BADHDUFLAG | Total packets | Discarded packets |
| A | 0 | 85 | 61 |
| B | 0 | 85 | 52 |
| C | 0 | 87 | 51 |
| D | 0 | 86 | 52 |
| Mode M0 | |||
|---|---|---|---|
| Quadrant | BADHDUFLAG | Total packets | Discarded packets |
| A | 0 | 9086 | 6191 |
| B | 0 | 9177 | 6249 |
| C | 0 | 9579 | 6584 |
| D | 0 | 9928 | 6798 |
| Mode M9 | |||
|---|---|---|---|
| Quadrant | BADHDUFLAG | Total packets | Discarded packets |
| A | 0 | 12 | 12 |
| B | 0 | 12 | 12 |
| C | 0 | 12 | 12 |
| D | 0 | 13 | 13 |
| Quadrant | Total seconds | Saturated seconds | Saturation percentage |
|---|---|---|---|
| A | 1444 | 0 | 0.000000% |
| B | 1454 | 1 | 0.068776% |
| C | 1436 | 3 | 0.208914% |
| D | 1348 | 19 | 1.409496% |
Noise dominated data is calculated using 1-second bins in cleaned event files. If a bin has >2000 counts, and if more than 50% of those come from <1% of pixels, then it is considered to be noise-dominated and hence unusable.
| Quadrant | # 1 sec bins | Bins with >0 counts | Bins with >2000 counts | High rate bins dominated by noise | Noise dominated (total time) | Noise dominated (detector-on time) | Marked lightcurve |
|---|---|---|---|---|---|---|---|
| A | 2807 | 1781 | 0 | 0 | 0.00% | 0.00% | 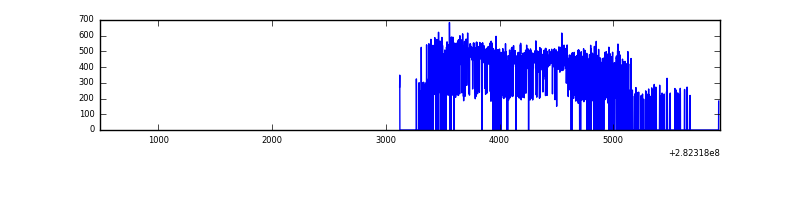 |
| B | 5224 | 1748 | 0 | 0 | 0.00% | 0.00% | 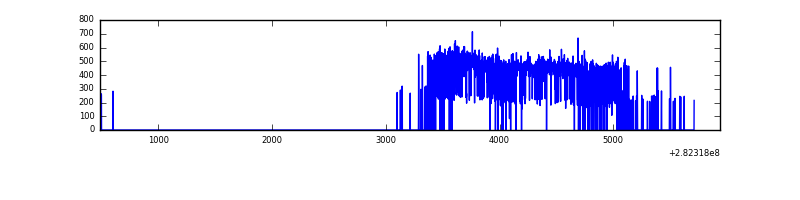 |
| C | 2809 | 1744 | 1 | 1 | 0.04% | 0.06% | 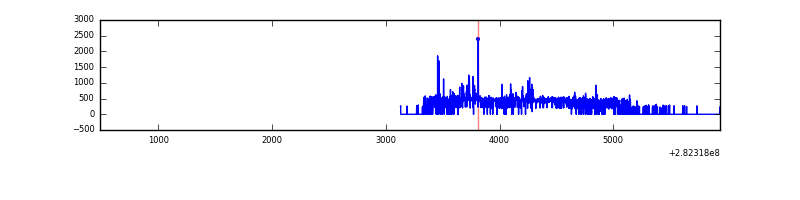 |
| D | 5186 | 1674 | 11 | 11 | 0.21% | 0.66% | 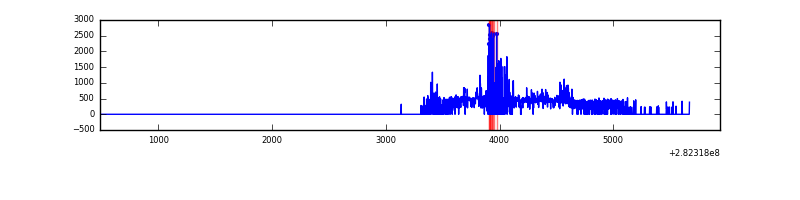 |
Top three noisy pixels from each quadrant. If the there are fewer than three noisy pixels in the level2.evt file, extra rows are filled as -1
| Pixel properties | Quadrant properties | ||||||
|---|---|---|---|---|---|---|---|
| Quadrant | DetID | PixID | Counts | Sigma | Mean | Median | Sigma |
| A | 0 | 226 | 1591 | 38.58 | 174 | 172 | 36.8 |
| A | 0 | 8 | 1427 | 34.12 | 174 | 172 | 36.8 |
| A | 3 | 137 | 1231 | 28.79 | 174 | 172 | 36.8 |
| B | 12 | 111 | 3913 | 107.74 | 174 | 171 | 34.7 |
| B | 11 | 111 | 3257 | 88.86 | 174 | 171 | 34.7 |
| B | 0 | 229 | 3124 | 85.03 | 174 | 171 | 34.7 |
| C | 3 | 233 | 48925 | 1252.58 | 160 | 162 | 38.9 |
| C | 14 | 238 | 26335 | 672.31 | 160 | 162 | 38.9 |
| C | 7 | 220 | 3043 | 74.0 | 160 | 162 | 38.9 |
| D | 5 | 222 | 164906 | 4362.05 | 150 | 146 | 37.8 |
| D | 2 | 152 | 13903 | 364.22 | 150 | 146 | 37.8 |
| D | 2 | 234 | 4177 | 106.72 | 150 | 146 | 37.8 |
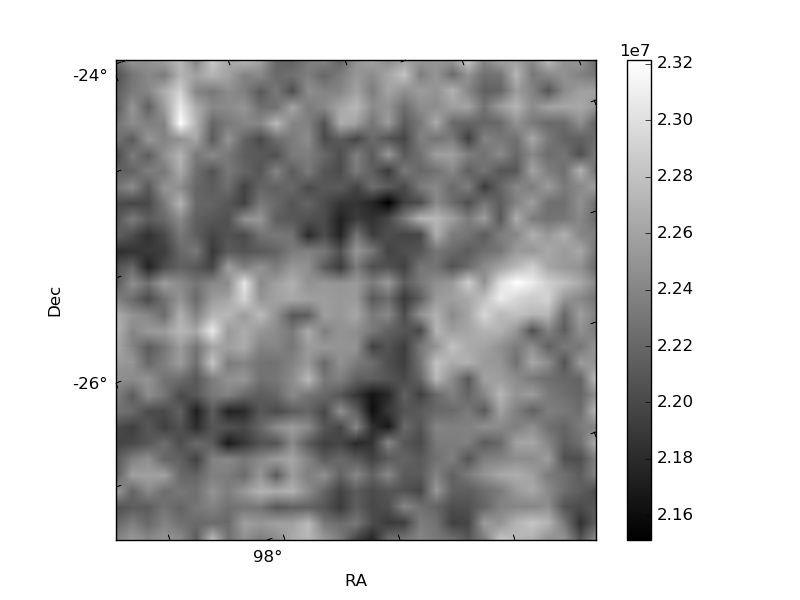
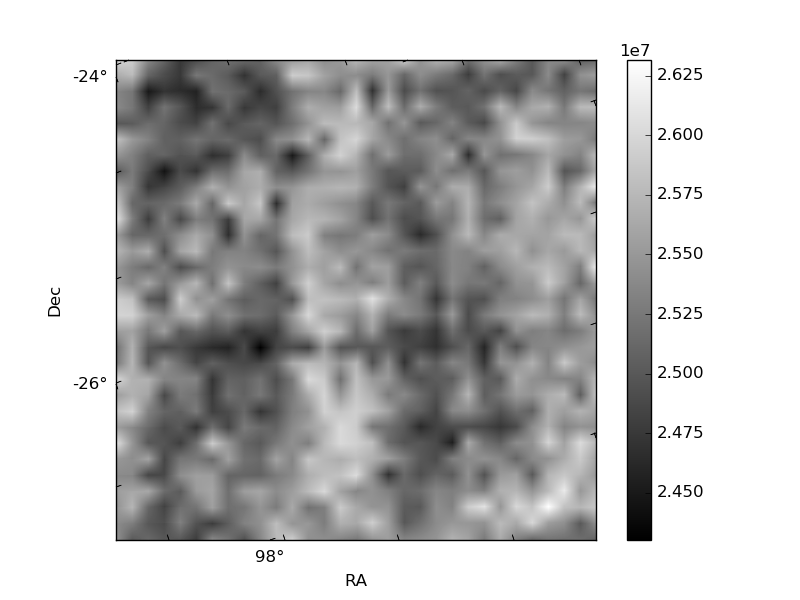
Histogram calculated using DETX and DETY for each event in the final _common_clean file
| Quadrant A | 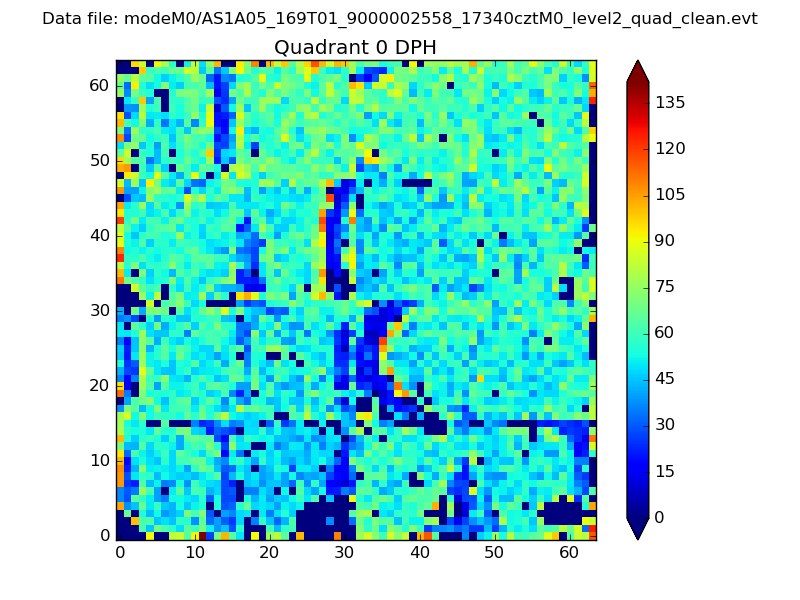 |
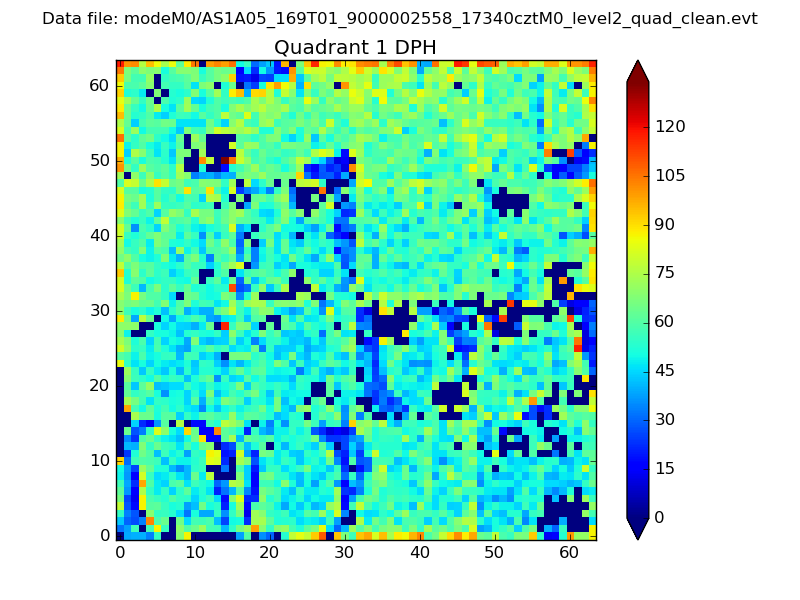 |
Quadrant B |
|---|---|---|---|
| Quadrant D |  |
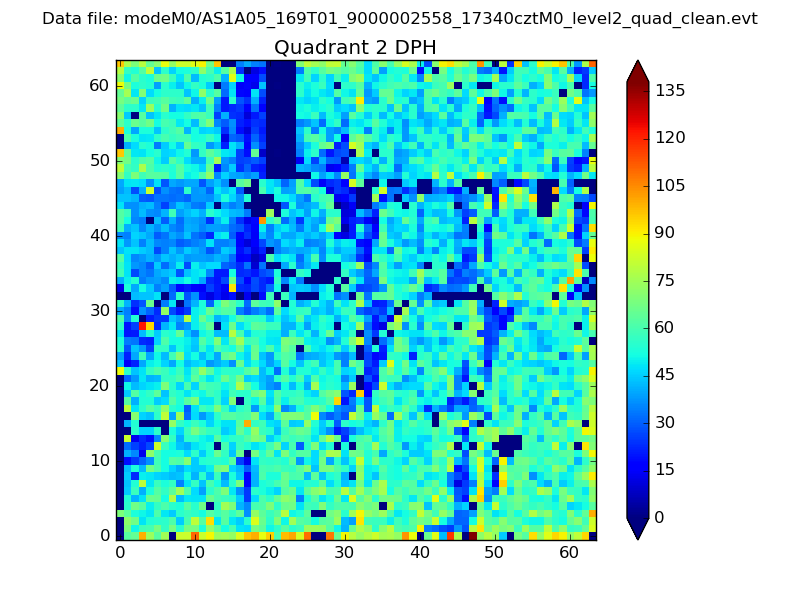 |
Quadrant C |
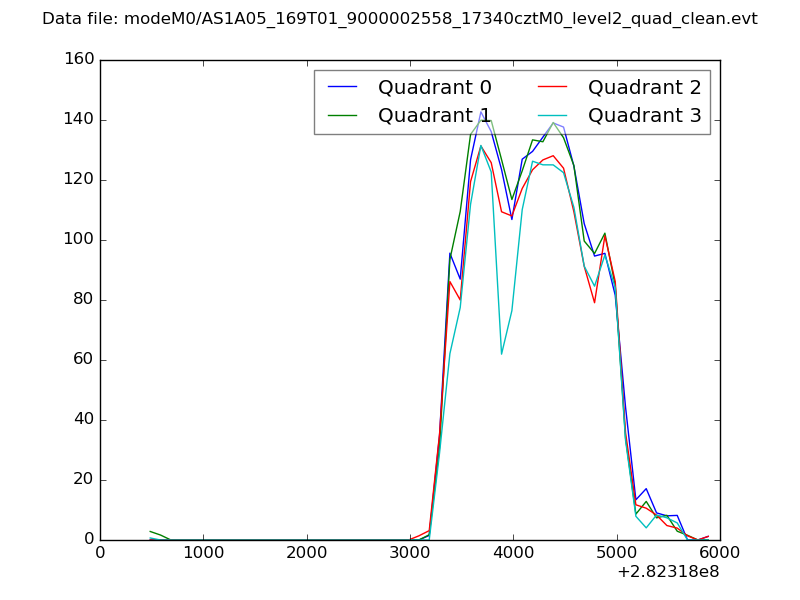
| Plot type | Count rate plots | Images |
|---|---|---|
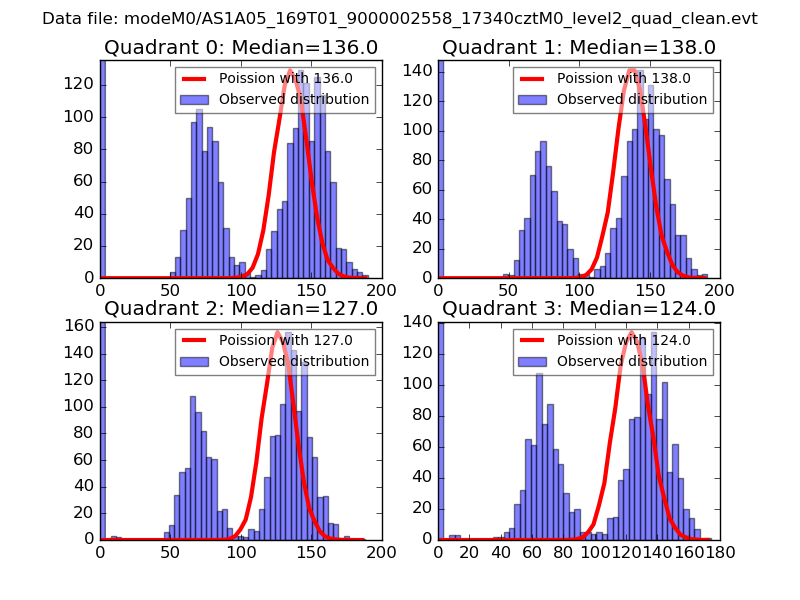
| Comparison with Poisson distribution Blue bars denote a histogram of data divided into 1 sec bins. Red curve is a Poisson curve with rate = median count rate of data. |
 |
 |
| Quadrant-wise count rates Data is divided into 100 sec bins |
 |
|
| Module-wise count rates for Quadrant A Data is divided into 100 sec bins |
 |
 |
| Module-wise count rates for Quadrant B Data is divided into 100 sec bins |
 |
 |
| Module-wise count rates for Quadrant C Data is divided into 100 sec bins |
 |
 |
| Module-wise count rates for Quadrant D Data is divided into 100 sec bins |
 |
 |
| Parameter | Plot |
|---|---|
| CZT HV Monitor |  |
| D_VDD | 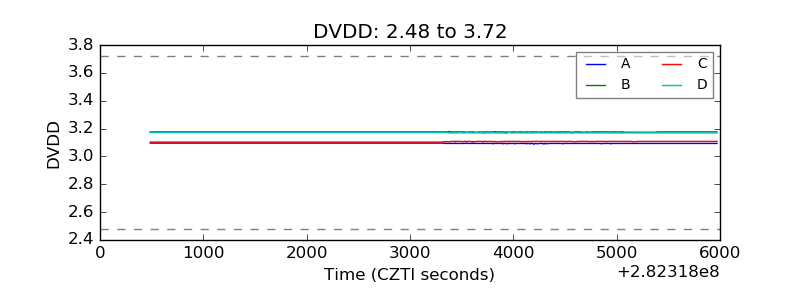 |
| Temperature 1 | 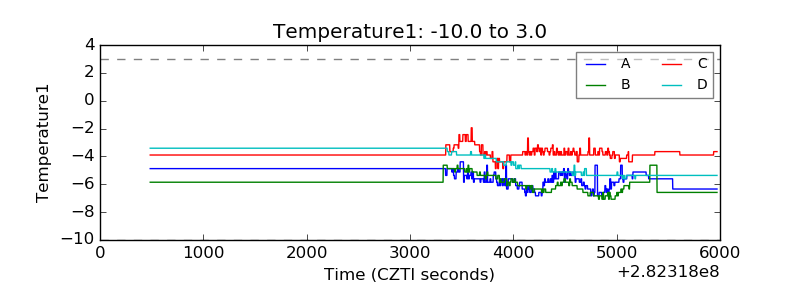 |
| Veto HV Monitor | 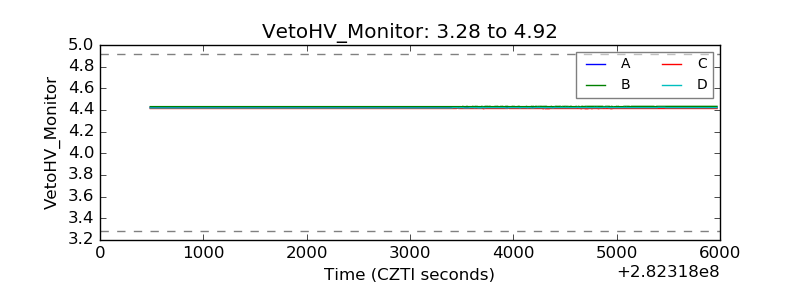 |
| Veto LLD | 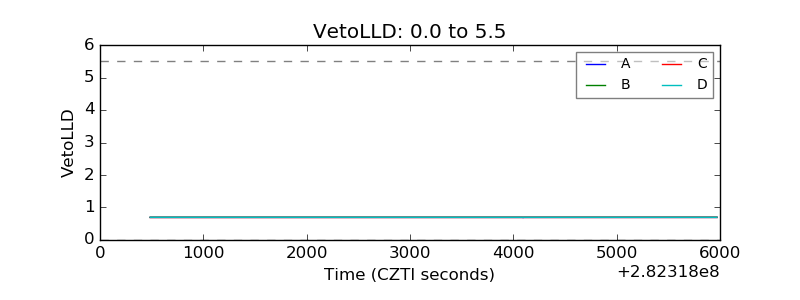 |
| Alpha Counter | 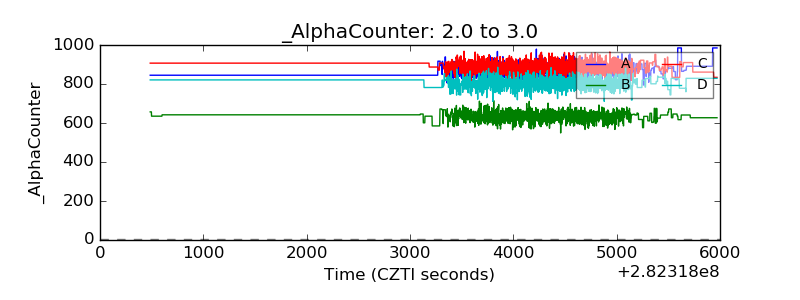 |
| _CPM_Rate | 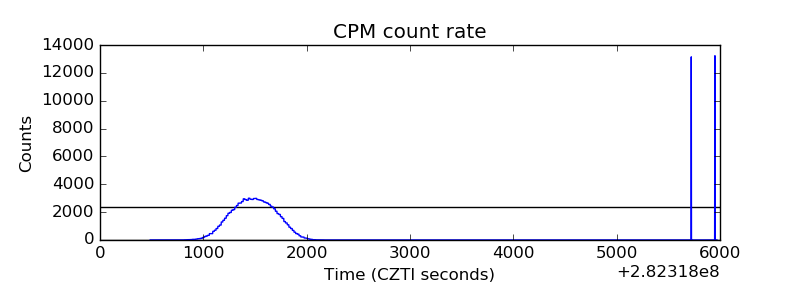 |
| CZT Counter | 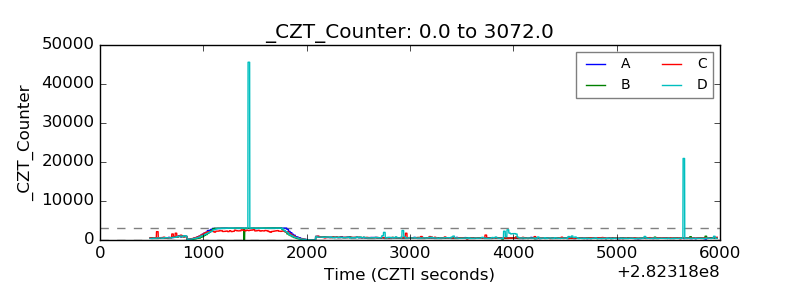 |
| +2.5 Volts monitor |  |
| +5 Volts monitor | 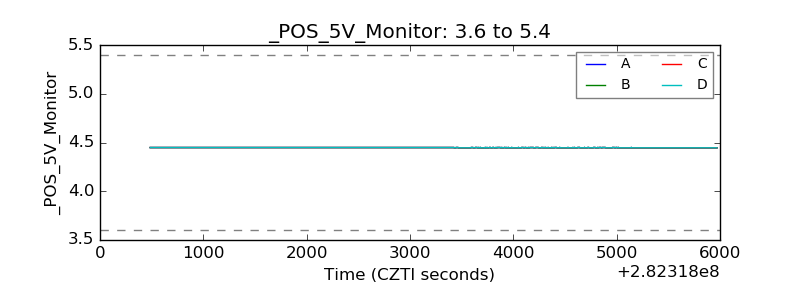 |
| _ROLL_ROT |  |
| _Roll_DEC | 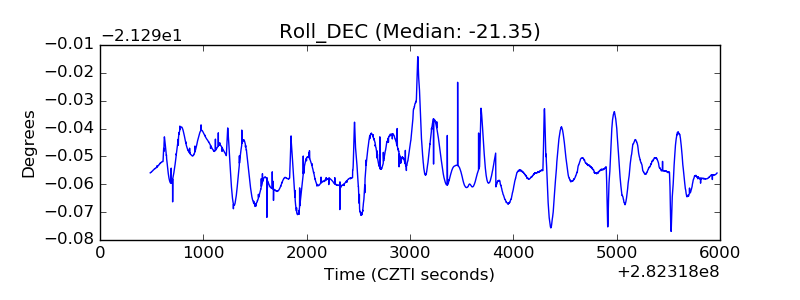 |
| _Roll_RA | 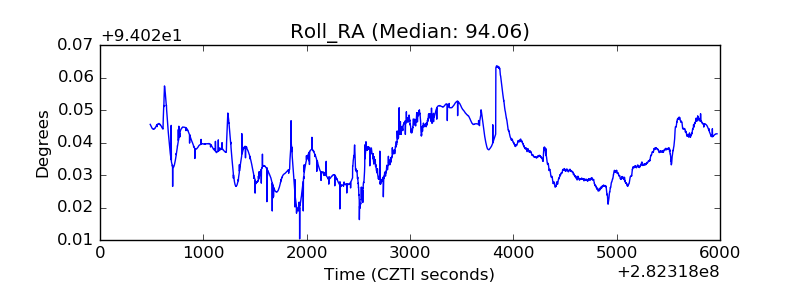 |
| Veto Counter |  |