| Param | Original file | Final file |
|---|---|---|
| Filename | modeM0/AS1A05_169T01_9000002558_17341cztM0_level2.evt | modeM0/AS1A05_169T01_9000002558_17341cztM0_level2_quad_clean.evt |
| Size (bytes) | 819,290,880 | 185,425,920 |
| Size | 781.3 MB | 176.8 MB |
| Events in quadrant A | 5,732,385 | 1,245,669 |
| Events in quadrant B | 5,829,430 | 1,261,695 |
| Events in quadrant C | 5,912,895 | 1,171,669 |
| Events in quadrant D | 6,572,545 | 1,155,415 |
| Mode SS | |||
|---|---|---|---|
| Quadrant | BADHDUFLAG | Total packets | Discarded packets |
| A | 0 | 230 | 0 |
| B | 0 | 230 | 0 |
| C | 0 | 230 | 0 |
| D | 0 | 230 | 0 |
| Mode M0 | |||
|---|---|---|---|
| Quadrant | BADHDUFLAG | Total packets | Discarded packets |
| A | 0 | 24159 | 2 |
| B | 0 | 24413 | 2 |
| C | 0 | 24671 | 2 |
| D | 0 | 27163 | 2 |
| Mode M9 | |||
|---|---|---|---|
| Quadrant | BADHDUFLAG | Total packets | Discarded packets |
| A | 0 | 26 | 0 |
| B | 0 | 26 | 0 |
| C | 0 | 26 | 0 |
| D | 0 | 26 | 0 |
| Quadrant | Total seconds | Saturated seconds | Saturation percentage |
|---|---|---|---|
| A | 11303 | 160 | 1.415553% |
| B | 11303 | 187 | 1.654428% |
| C | 11304 | 218 | 1.928521% |
| D | 11304 | 252 | 2.229299% |
Noise dominated data is calculated using 1-second bins in cleaned event files. If a bin has >2000 counts, and if more than 50% of those come from <1% of pixels, then it is considered to be noise-dominated and hence unusable.
| Quadrant | # 1 sec bins | Bins with >0 counts | Bins with >2000 counts | High rate bins dominated by noise | Noise dominated (total time) | Noise dominated (detector-on time) | Marked lightcurve |
|---|---|---|---|---|---|---|---|
| A | 13913 | 11305 | 0 | 0 | 0.00% | 0.00% | 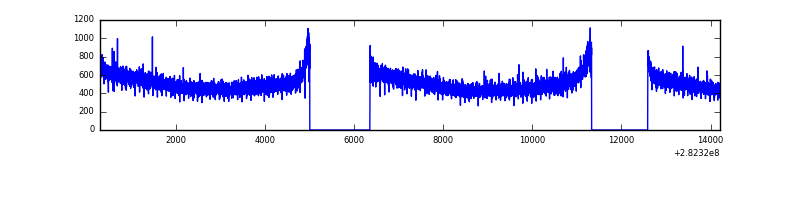 |
| B | 13913 | 11305 | 1 | 1 | 0.01% | 0.01% | 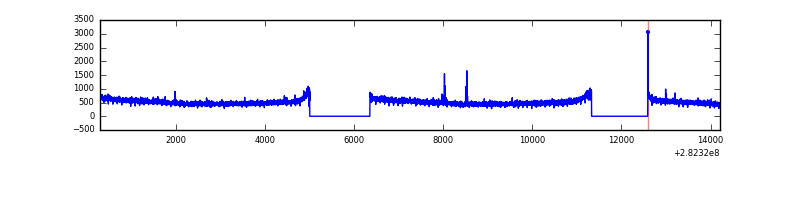 |
| C | 13914 | 11306 | 1 | 1 | 0.01% | 0.01% | 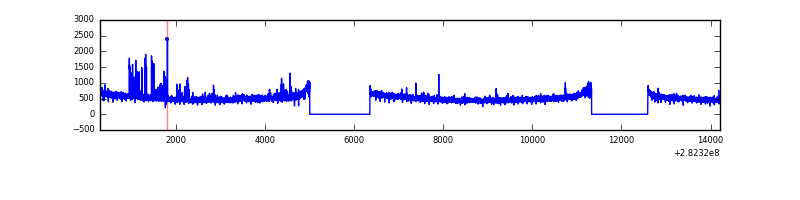 |
| D | 13914 | 11306 | 131 | 131 | 0.94% | 1.16% | 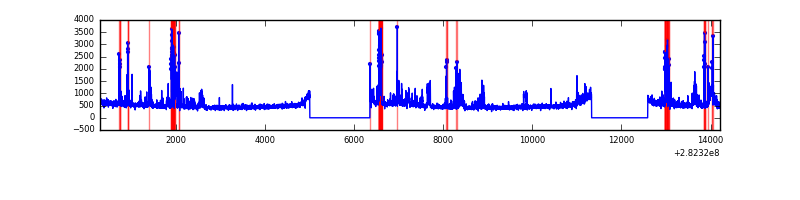 |
Top three noisy pixels from each quadrant. If the there are fewer than three noisy pixels in the level2.evt file, extra rows are filled as -1
| Pixel properties | Quadrant properties | ||||||
|---|---|---|---|---|---|---|---|
| Quadrant | DetID | PixID | Counts | Sigma | Mean | Median | Sigma |
| A | 0 | 226 | 12872 | 38.67 | 1491 | 1466 | 295.0 |
| A | 3 | 137 | 10888 | 31.94 | 1491 | 1466 | 295.0 |
| A | 12 | 194 | 10339 | 30.08 | 1491 | 1466 | 295.0 |
| B | 12 | 111 | 33368 | 114.88 | 1485 | 1451 | 277.8 |
| B | 11 | 111 | 28903 | 98.81 | 1485 | 1451 | 277.8 |
| B | 14 | 111 | 26294 | 89.42 | 1485 | 1451 | 277.8 |
| C | 14 | 238 | 221811 | 676.94 | 1405 | 1418 | 325.6 |
| C | 3 | 233 | 185844 | 566.47 | 1405 | 1418 | 325.6 |
| C | 7 | 220 | 26223 | 76.19 | 1405 | 1418 | 325.6 |
| D | 5 | 222 | 1084521 | 3179.44 | 1412 | 1373 | 340.7 |
| D | 2 | 152 | 97409 | 281.9 | 1412 | 1373 | 340.7 |
| D | 13 | 238 | 38276 | 108.32 | 1412 | 1373 | 340.7 |
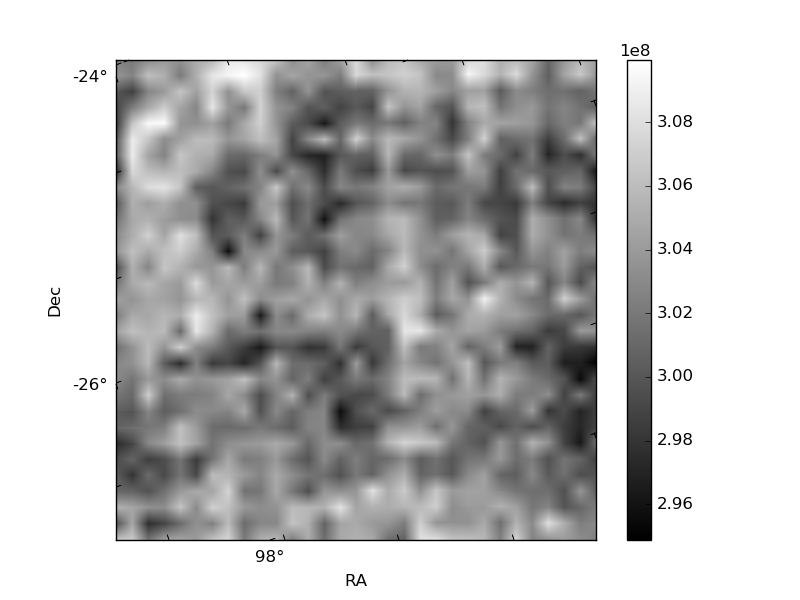
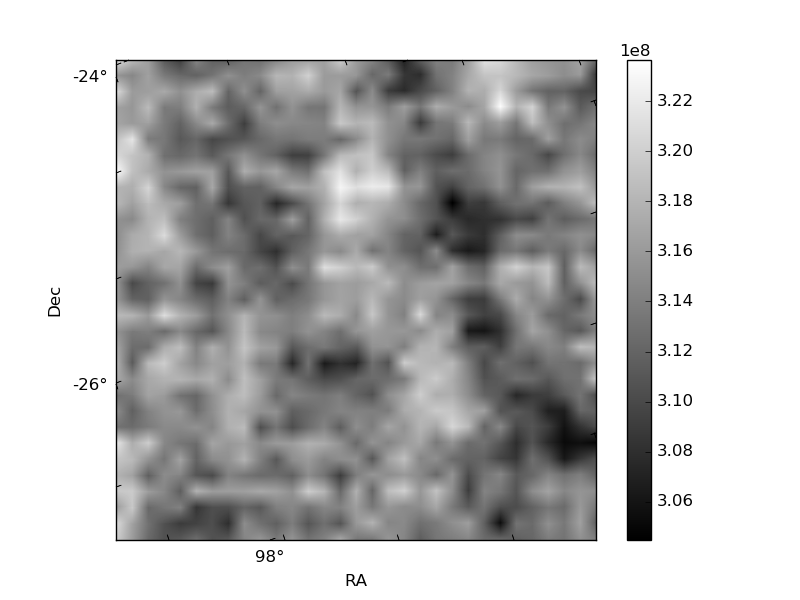
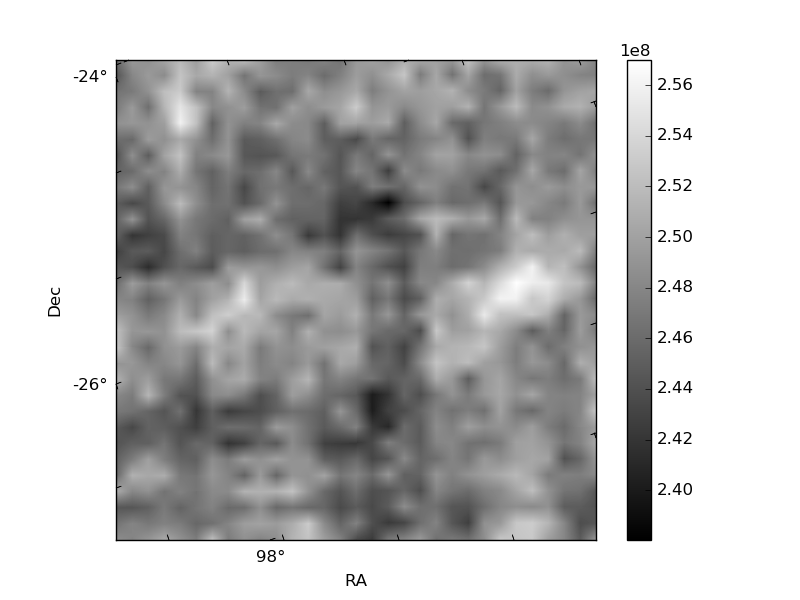
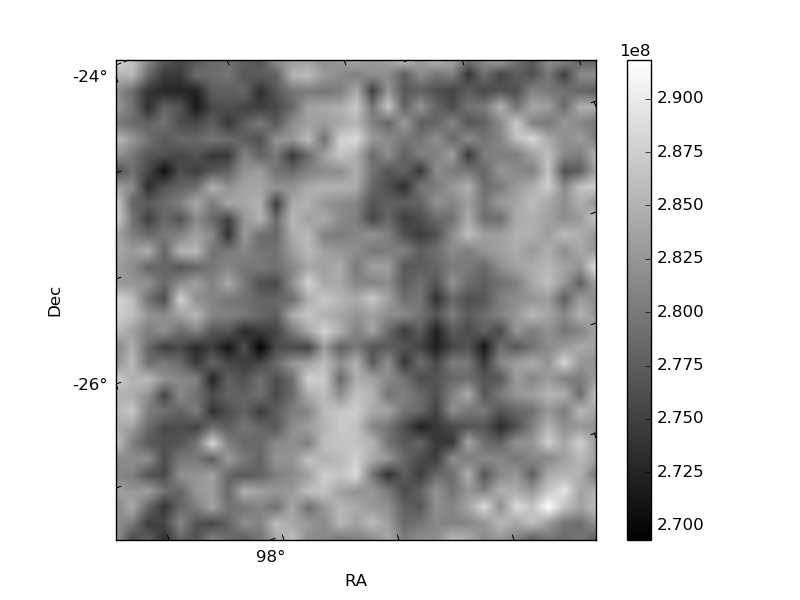
Histogram calculated using DETX and DETY for each event in the final _common_clean file
| Quadrant A |  |
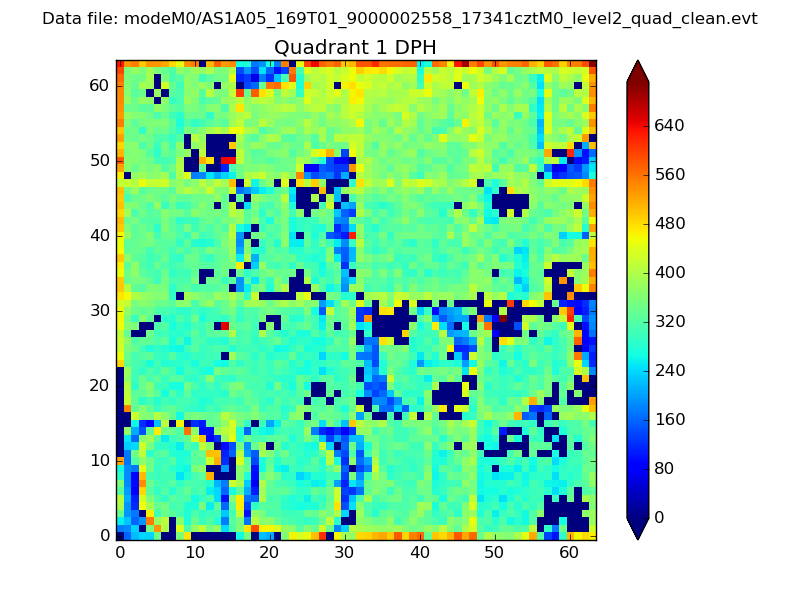 |
Quadrant B |
|---|---|---|---|
| Quadrant D |  |
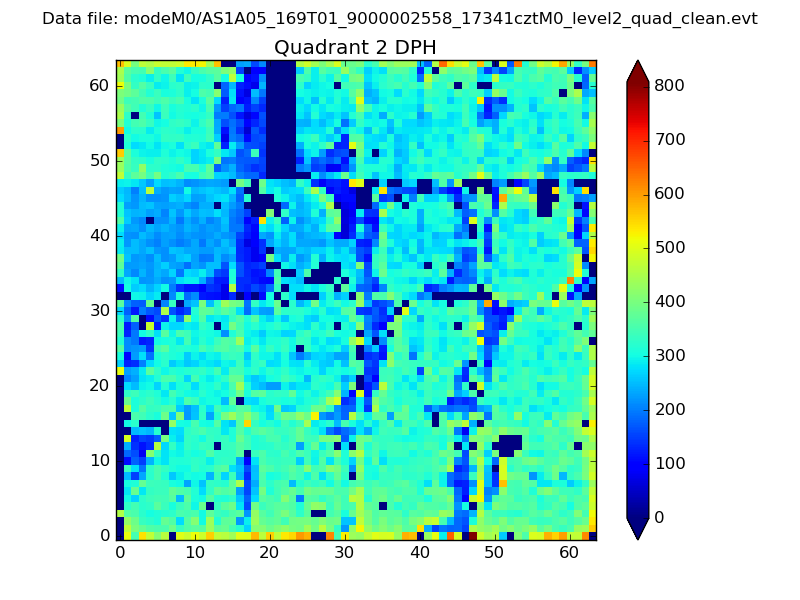 |
Quadrant C |
| Plot type | Count rate plots | Images |
|---|---|---|
| Comparison with Poisson distribution Blue bars denote a histogram of data divided into 1 sec bins. Red curve is a Poisson curve with rate = median count rate of data. |
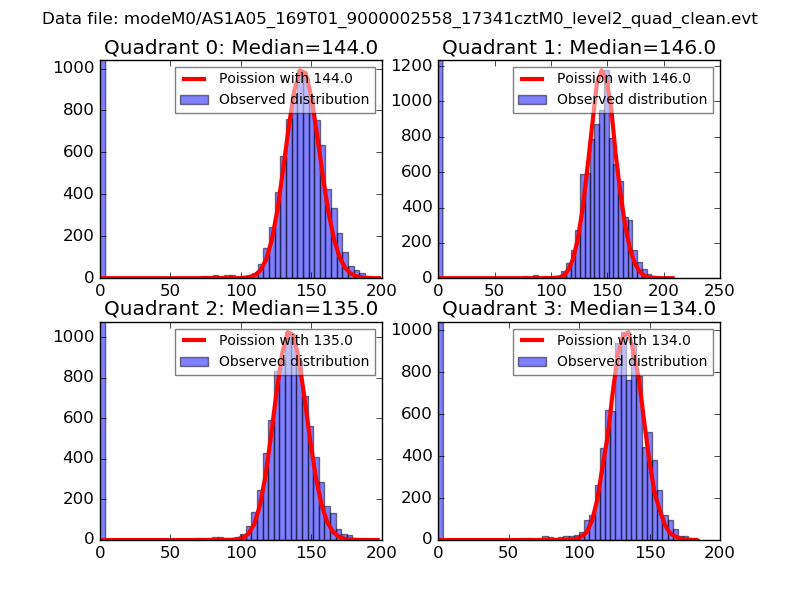 |
 |
| Quadrant-wise count rates Data is divided into 100 sec bins |
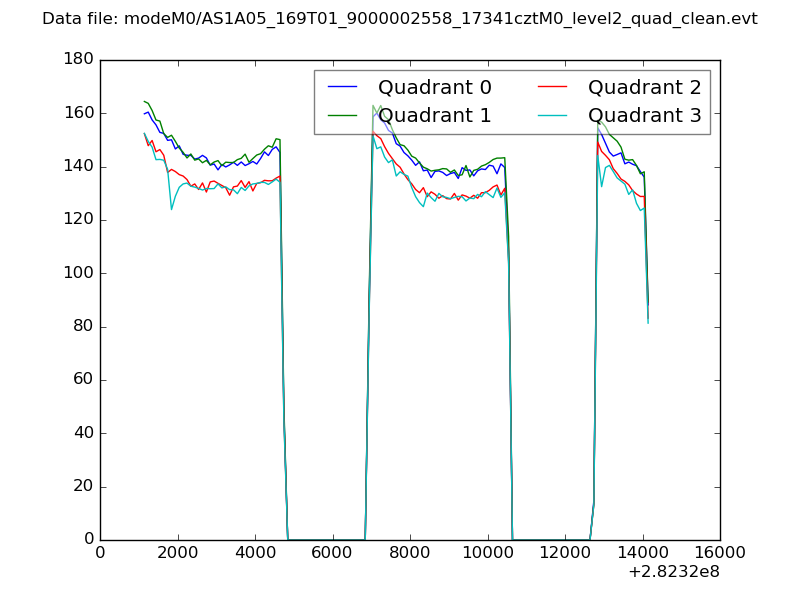 |
|
| Module-wise count rates for Quadrant A Data is divided into 100 sec bins |
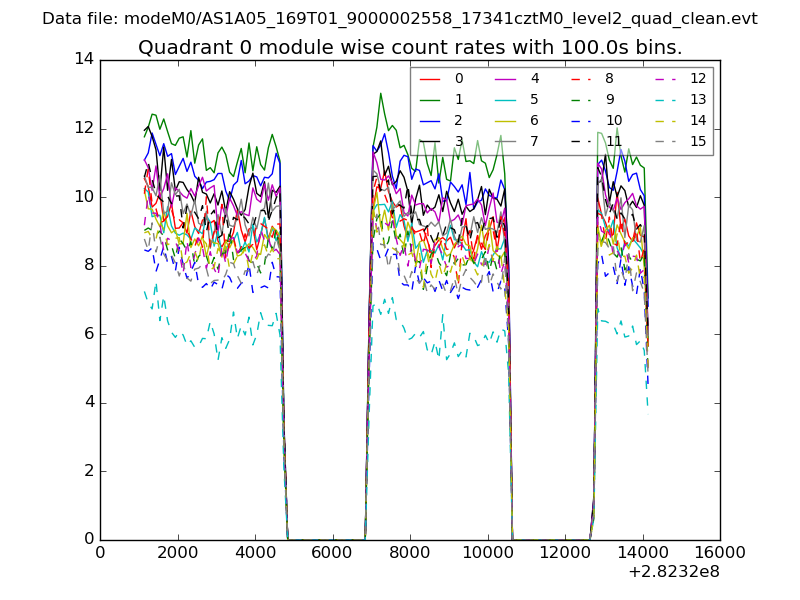 |
 |
| Module-wise count rates for Quadrant B Data is divided into 100 sec bins |
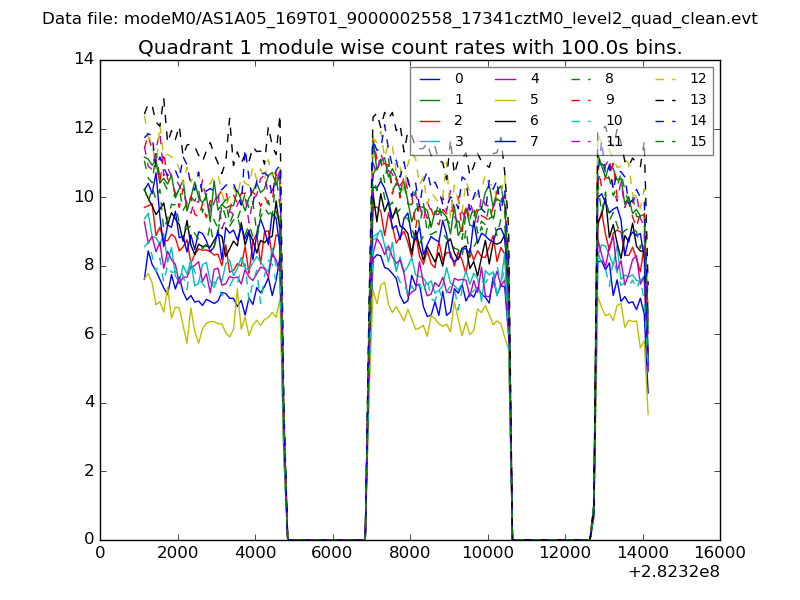 |
 |
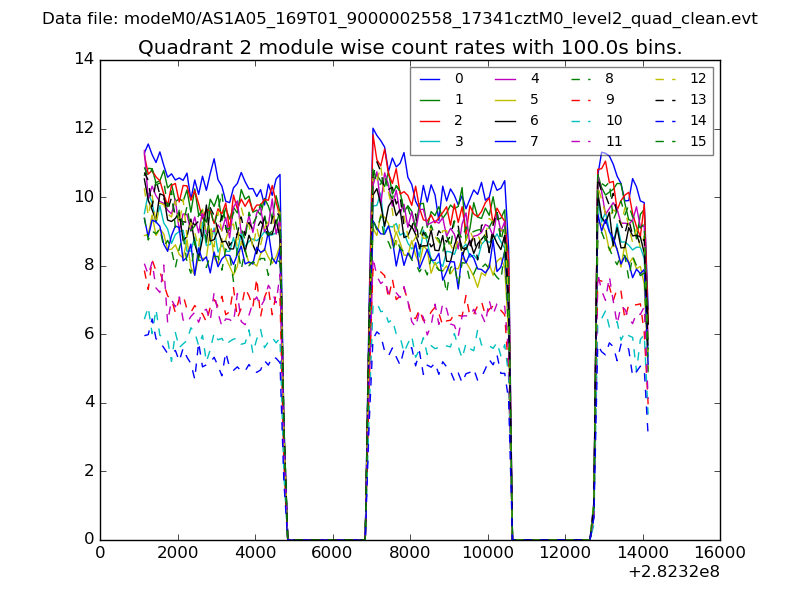
| Module-wise count rates for Quadrant C Data is divided into 100 sec bins |
 |
 |
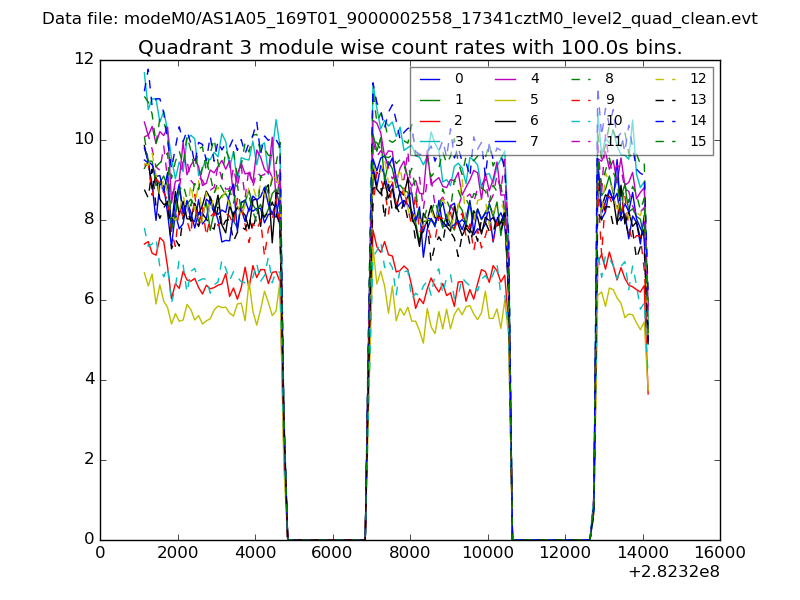
| Module-wise count rates for Quadrant D Data is divided into 100 sec bins |
 |
 |
| Parameter | Plot |
|---|---|
| CZT HV Monitor |  |
| D_VDD | 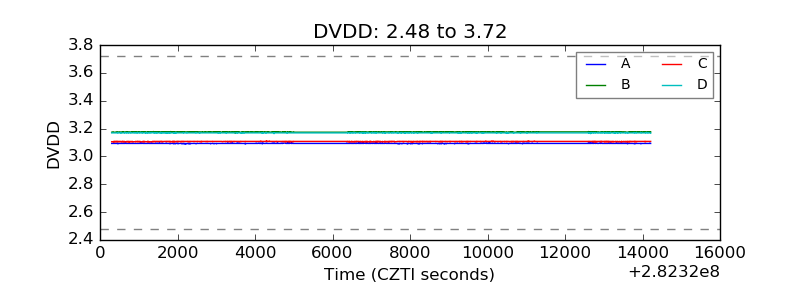 |
| Temperature 1 | 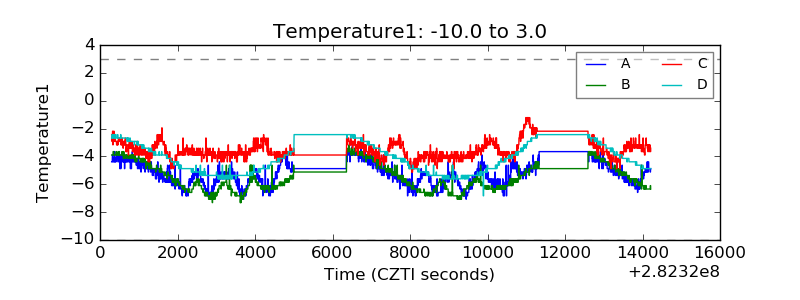 |
| Veto HV Monitor | 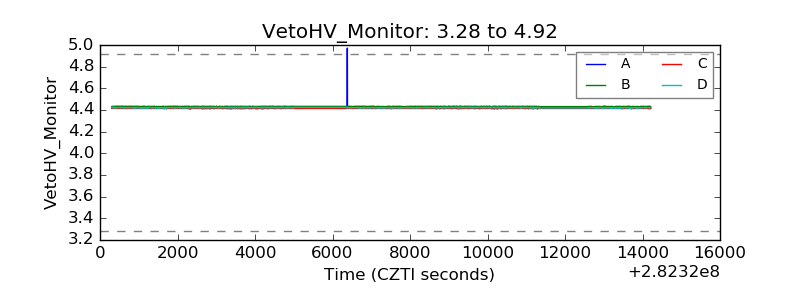 |
| Veto LLD | 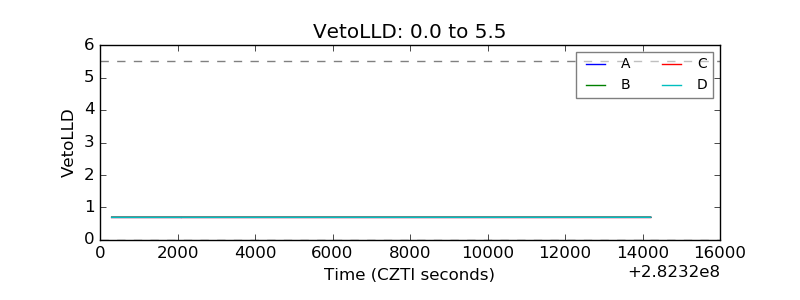 |
| Alpha Counter | 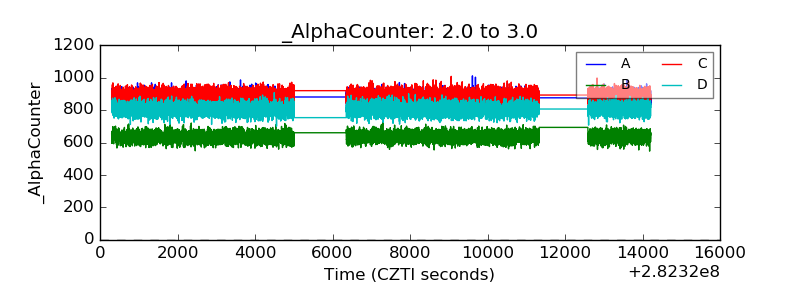 |
| _CPM_Rate | 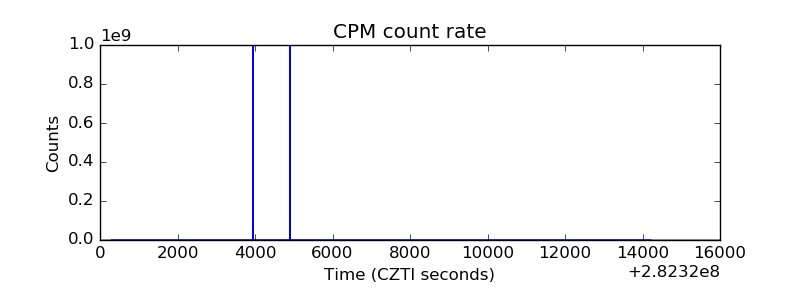 |
| CZT Counter | 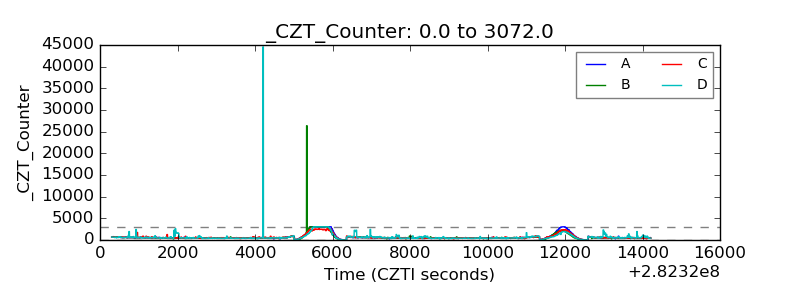 |
| +2.5 Volts monitor |  |
| +5 Volts monitor |  |
| _ROLL_ROT | 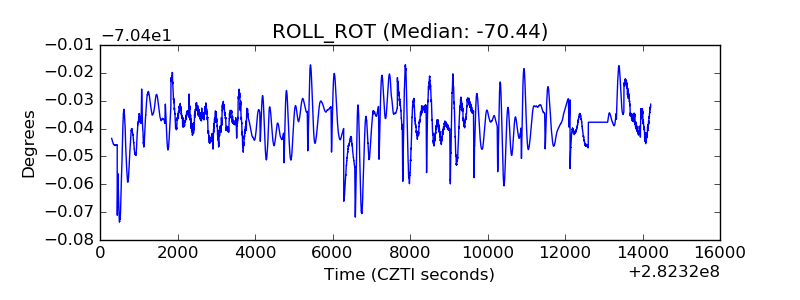 |
| _Roll_DEC | 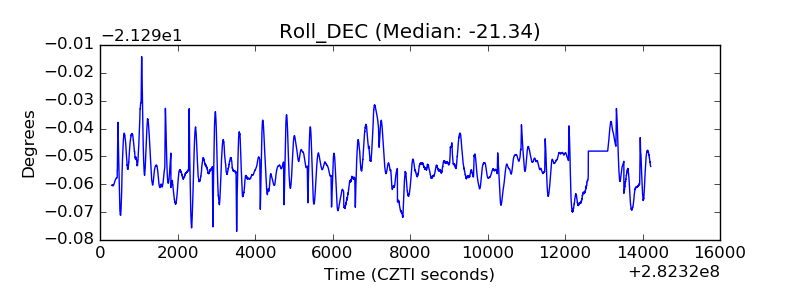 |
| _Roll_RA | 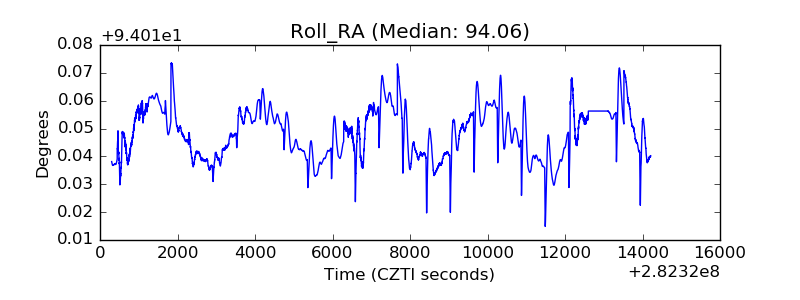 |
| Veto Counter | 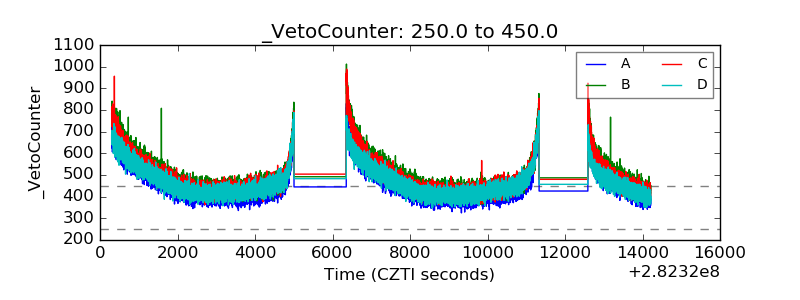 |