| Param | Original file | Final file |
|---|---|---|
| Filename | modeM0/AS1A05_025T16_9000002560cztM0_level2.fits | modeM0/AS1A05_025T16_9000002560cztM0_level2_quad_clean.evt |
| Size (bytes) | 200,064,960 | 198,086,400 |
| Size | 190.8 MB | 188.9 MB |
| Events in quadrant A | 1,222,626 | 1,204,186 |
| Events in quadrant B | 1,180,076 | 1,199,076 |
| Events in quadrant C | 1,176,326 | 1,108,792 |
| Events in quadrant D | 1,025,878 | 1,032,305 |
| Mode M9 | |||
|---|---|---|---|
| Quadrant | BADHDUFLAG | Total packets | Discarded packets |
| A | 0 | 24 | 0 |
| B | 0 | 24 | 0 |
| C | 0 | 24 | 0 |
| D | 0 | 24 | 0 |
| Mode M0 | |||
|---|---|---|---|
| Quadrant | BADHDUFLAG | Total packets | Discarded packets |
| A | 0 | 43307 | 0 |
| B | 0 | 43792 | 0 |
| C | 0 | 44761 | 0 |
| D | 0 | 49240 | 0 |
| Mode SS | |||
|---|---|---|---|
| Quadrant | BADHDUFLAG | Total packets | Discarded packets |
| A | 0 | 432 | 0 |
| B | 0 | 432 | 0 |
| C | 0 | 432 | 0 |
| D | 0 | 432 | 0 |
| Quadrant | Total seconds | Saturated seconds | Saturation percentage |
|---|---|---|---|
| A | 21116 | 72 | 0.340974% |
| B | 21116 | 170 | 0.805077% |
| C | 21116 | 346 | 1.638568% |
| D | 21116 | 374 | 1.771169% |
Noise dominated data is calculated using 1-second bins in cleaned event files. If a bin has >2000 counts, and if more than 50% of those come from <1% of pixels, then it is considered to be noise-dominated and hence unusable.
| Quadrant | # 1 sec bins | Bins with >0 counts | Bins with >2000 counts | High rate bins dominated by noise | Noise dominated (total time) | Noise dominated (detector-on time) | Marked lightcurve |
|---|---|---|---|---|---|---|---|
| A | 23601 | 21116 | 0 | 0 | 0.00% | 0.00% |  |
| B | 23601 | 21117 | 0 | 0 | 0.00% | 0.00% |  |
| C | 23601 | 21116 | 0 | 0 | 0.00% | 0.00% | 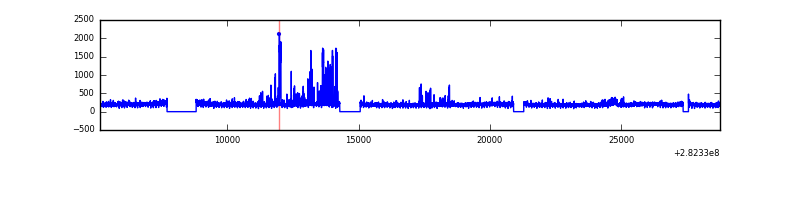 |
| D | 23601 | 21108 | 0 | 0 | 0.00% | 0.00% |  |
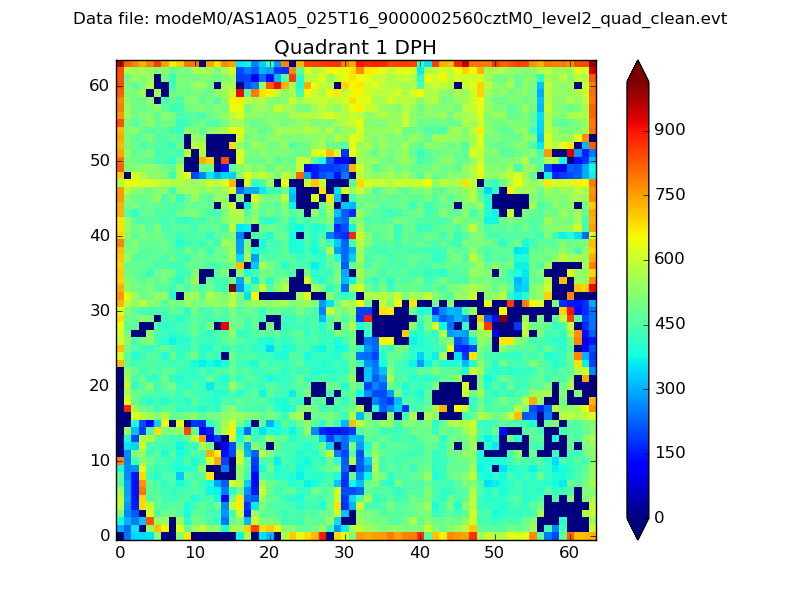
Top three noisy pixels from each quadrant. If the there are fewer than three noisy pixels in the level2.evt file, extra rows are filled as -1
| Pixel properties | Quadrant properties | ||||||
|---|---|---|---|---|---|---|---|
| Quadrant | DetID | PixID | Counts | Sigma | Mean | Median | Sigma |
| A | 0 | 29 | 1250 | 11.72 | 318 | 299 | 81.2 |
| A | 7 | 110 | 1024 | 8.93 | 318 | 299 | 81.2 |
| A | 9 | 19 | 965 | 8.2 | 318 | 299 | 81.2 |
| B | 2 | 9 | 951 | 10.46 | 311 | 296 | 62.6 |
| B | 5 | 232 | 804 | 8.11 | 311 | 296 | 62.6 |
| B | 3 | 80 | 772 | 7.6 | 311 | 296 | 62.6 |
| C | 12 | 241 | 837 | 6.7 | 311 | 288 | 82.0 |
| C | 9 | 233 | 778 | 5.98 | 311 | 288 | 82.0 |
| C | 3 | 187 | 770 | 5.88 | 311 | 288 | 82.0 |
| D | 6 | 231 | 783 | 6.43 | 292 | 263 | 80.9 |
| D | 6 | 67 | 737 | 5.86 | 292 | 263 | 80.9 |
| D | 7 | 5 | 728 | 5.75 | 292 | 263 | 80.9 |
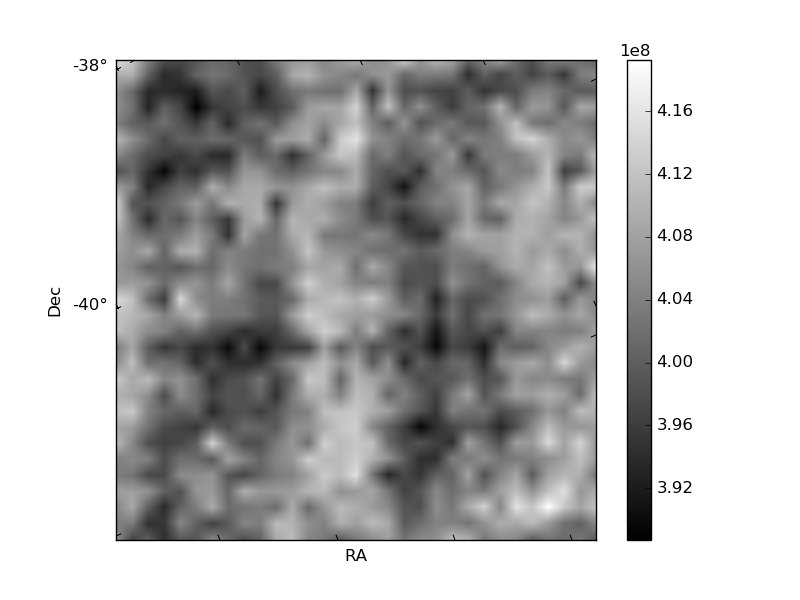
Histogram calculated using DETX and DETY for each event in the final _common_clean file
| Quadrant A | 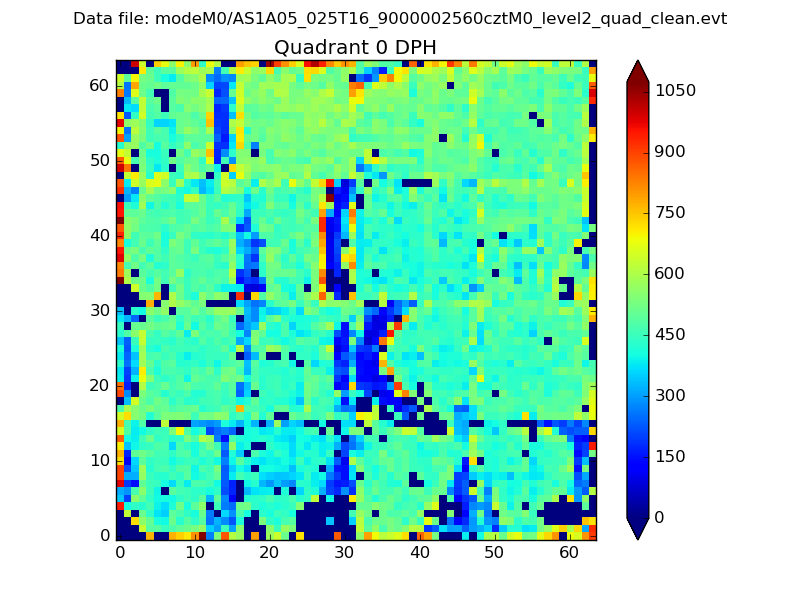 |
 |
Quadrant B |
|---|---|---|---|
| Quadrant D | 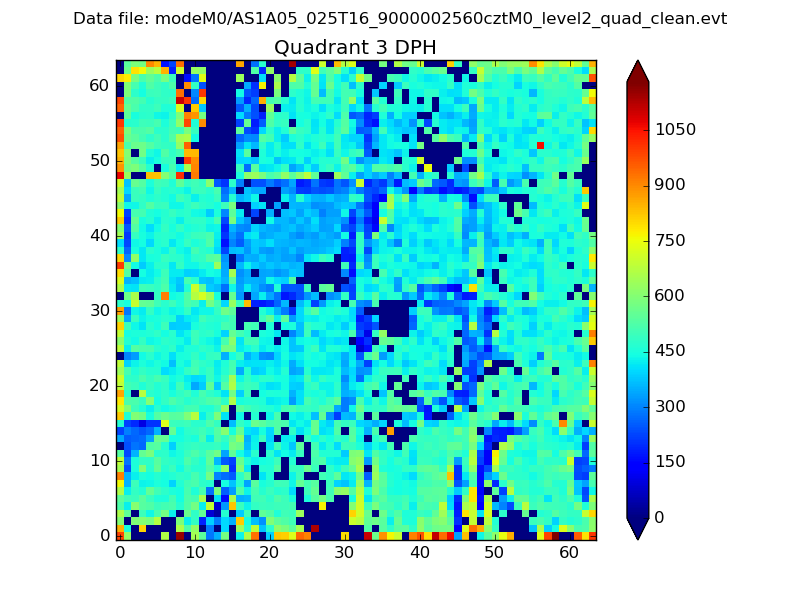 |
 |
Quadrant C |
| Plot type | Count rate plots | Images |
|---|---|---|
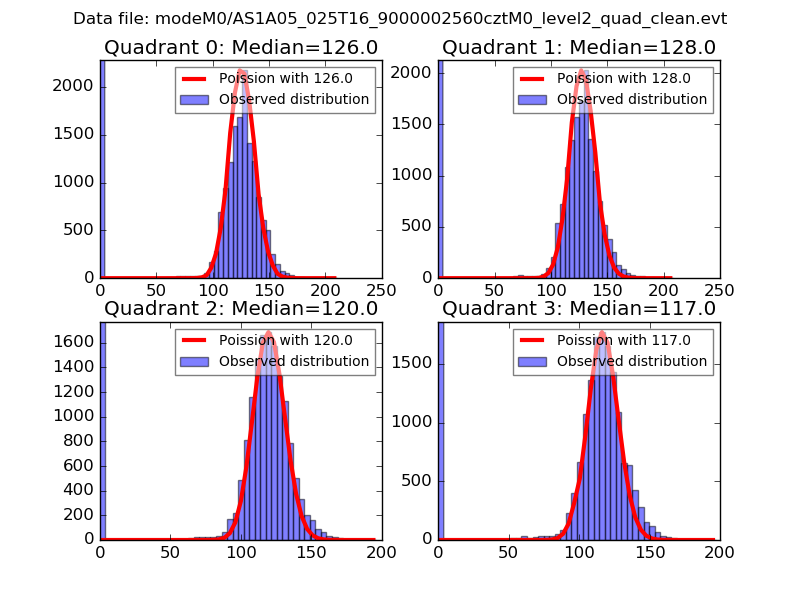
| Comparison with Poisson distribution Blue bars denote a histogram of data divided into 1 sec bins. Red curve is a Poisson curve with rate = median count rate of data. |
 |
 |
| Quadrant-wise count rates Data is divided into 100 sec bins |
 |
|
| Module-wise count rates for Quadrant A Data is divided into 100 sec bins |
 |
 |
| Module-wise count rates for Quadrant B Data is divided into 100 sec bins |
 |
 |
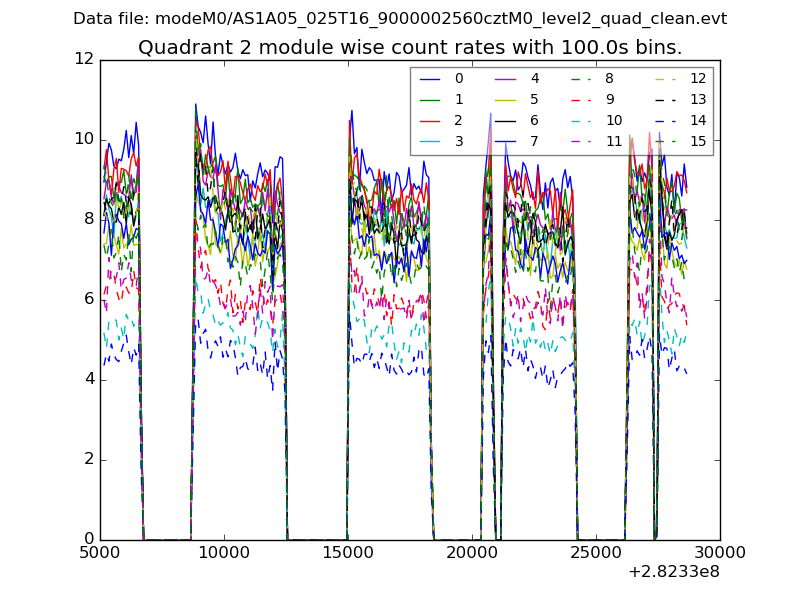
| Module-wise count rates for Quadrant C Data is divided into 100 sec bins |
 |
 |
| Module-wise count rates for Quadrant D Data is divided into 100 sec bins |
 |
 |
| Parameter | Plot |
|---|---|
| CZT HV Monitor |  |
| D_VDD | 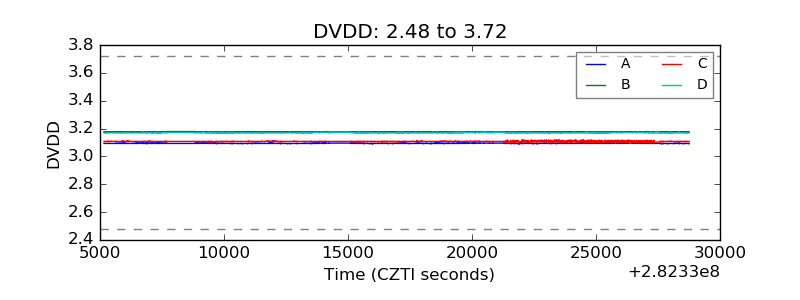 |
| Temperature 1 |  |
| Veto HV Monitor |  |
| Veto LLD | 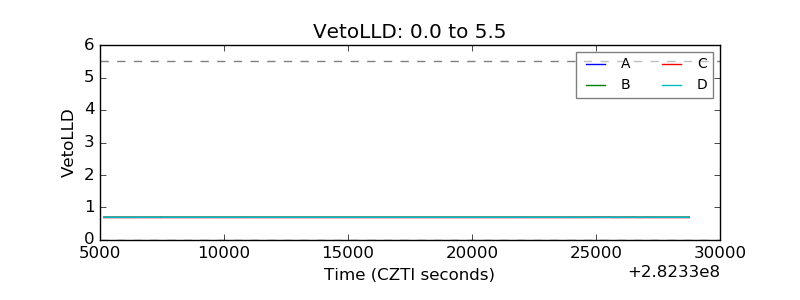 |
| Alpha Counter | 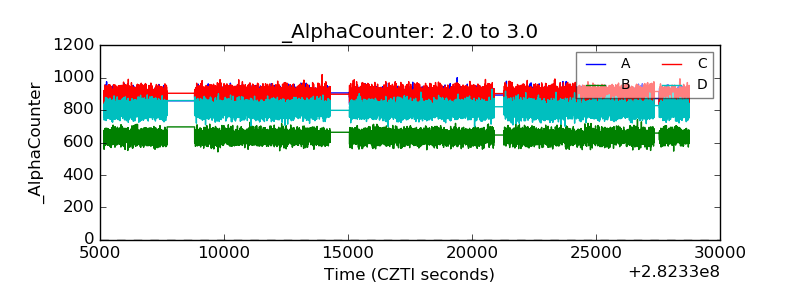 |
| _CPM_Rate | 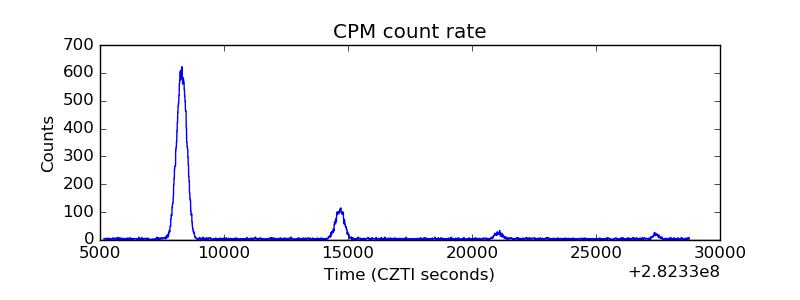 |
| CZT Counter | 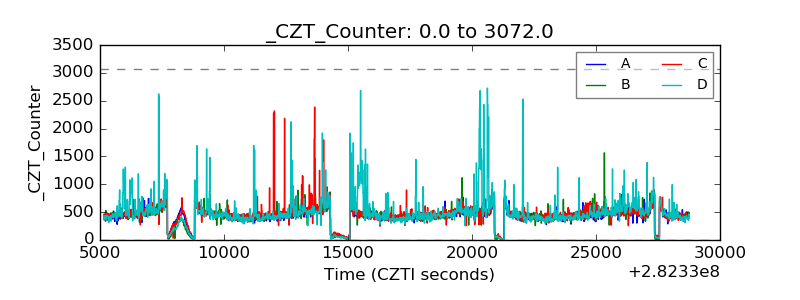 |
| +2.5 Volts monitor |  |
| +5 Volts monitor | 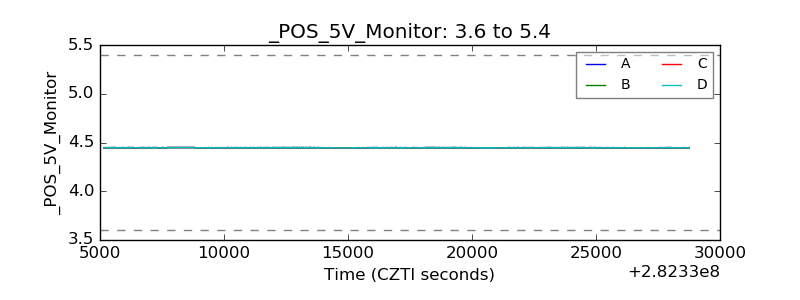 |
| _ROLL_ROT | 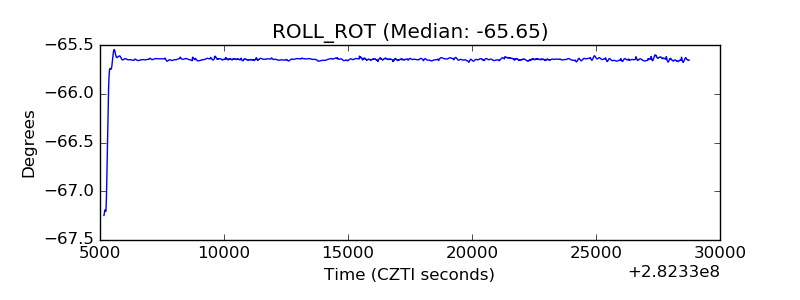 |
| _Roll_DEC |  |
| _Roll_RA | 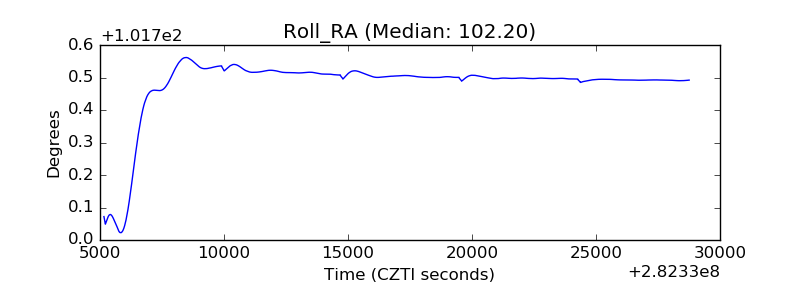 |
| Veto Counter |  |