| Param | Original file | Final file |
|---|---|---|
| Filename | modeM0/AS1A05_025T16_9000002560_17342cztM0_level2.evt | modeM0/AS1A05_025T16_9000002560_17342cztM0_level2_quad_clean.evt |
| Size (bytes) | 285,298,560 | 62,573,760 |
| Size | 272.1 MB | 59.7 MB |
| Events in quadrant A | 1,953,097 | 410,936 |
| Events in quadrant B | 2,041,081 | 418,850 |
| Events in quadrant C | 2,012,846 | 392,596 |
| Events in quadrant D | 2,352,394 | 382,487 |
| Mode M9 | |||
|---|---|---|---|
| Quadrant | BADHDUFLAG | Total packets | Discarded packets |
| A | 0 | 11 | 0 |
| B | 0 | 11 | 0 |
| C | 0 | 11 | 0 |
| D | 0 | 11 | 0 |
| Mode M0 | |||
|---|---|---|---|
| Quadrant | BADHDUFLAG | Total packets | Discarded packets |
| A | 0 | 8531 | 1 |
| B | 0 | 8693 | 1 |
| C | 0 | 8594 | 1 |
| D | 0 | 9822 | 1 |
| Mode SS | |||
|---|---|---|---|
| Quadrant | BADHDUFLAG | Total packets | Discarded packets |
| A | 0 | 84 | 0 |
| B | 0 | 84 | 0 |
| C | 0 | 84 | 0 |
| D | 0 | 84 | 0 |
| Quadrant | Total seconds | Saturated seconds | Saturation percentage |
|---|---|---|---|
| A | 4112 | 21 | 0.510700% |
| B | 4112 | 43 | 1.045720% |
| C | 4112 | 40 | 0.972763% |
| D | 4112 | 74 | 1.799611% |
Noise dominated data is calculated using 1-second bins in cleaned event files. If a bin has >2000 counts, and if more than 50% of those come from <1% of pixels, then it is considered to be noise-dominated and hence unusable.
| Quadrant | # 1 sec bins | Bins with >0 counts | Bins with >2000 counts | High rate bins dominated by noise | Noise dominated (total time) | Noise dominated (detector-on time) | Marked lightcurve |
|---|---|---|---|---|---|---|---|
| A | 5222 | 4113 | 0 | 0 | 0.00% | 0.00% | 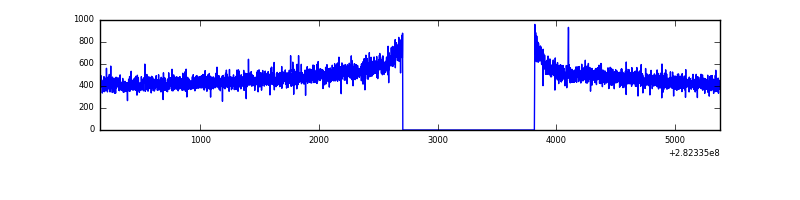 |
| B | 5222 | 4113 | 2 | 2 | 0.04% | 0.05% | 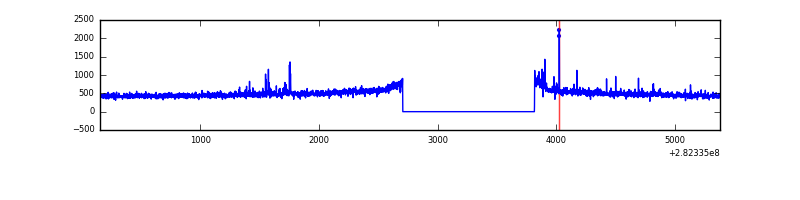 |
| C | 5222 | 4113 | 0 | 0 | 0.00% | 0.00% | 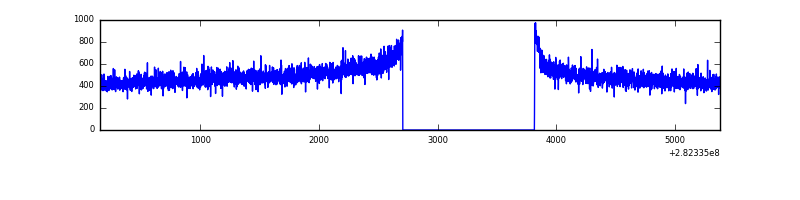 |
| D | 5222 | 4113 | 44 | 44 | 0.84% | 1.07% | 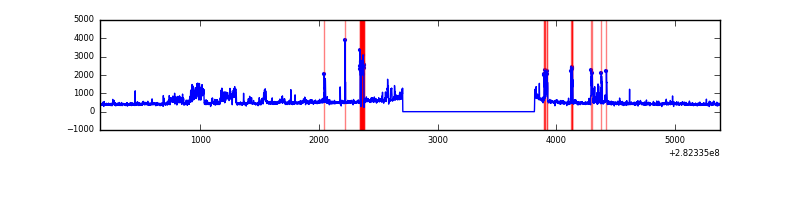 |
Top three noisy pixels from each quadrant. If the there are fewer than three noisy pixels in the level2.evt file, extra rows are filled as -1
| Pixel properties | Quadrant properties | ||||||
|---|---|---|---|---|---|---|---|
| Quadrant | DetID | PixID | Counts | Sigma | Mean | Median | Sigma |
| A | 0 | 226 | 4444 | 38.34 | 507 | 496 | 103.0 |
| A | 3 | 137 | 3899 | 33.04 | 507 | 496 | 103.0 |
| A | 12 | 194 | 3584 | 29.99 | 507 | 496 | 103.0 |
| B | 4 | 173 | 20649 | 206.41 | 510 | 499 | 97.6 |
| B | 0 | 244 | 17253 | 171.62 | 510 | 499 | 97.6 |
| B | 12 | 111 | 11623 | 113.95 | 510 | 499 | 97.6 |
| C | 14 | 238 | 75973 | 657.37 | 488 | 492 | 114.8 |
| C | 3 | 233 | 29613 | 253.62 | 488 | 492 | 114.8 |
| C | 13 | 61 | 3481 | 26.03 | 488 | 492 | 114.8 |
| D | 5 | 222 | 467815 | 3975.51 | 484 | 470 | 117.6 |
| D | 2 | 152 | 23331 | 194.47 | 484 | 470 | 117.6 |
| D | 2 | 234 | 14644 | 120.57 | 484 | 470 | 117.6 |
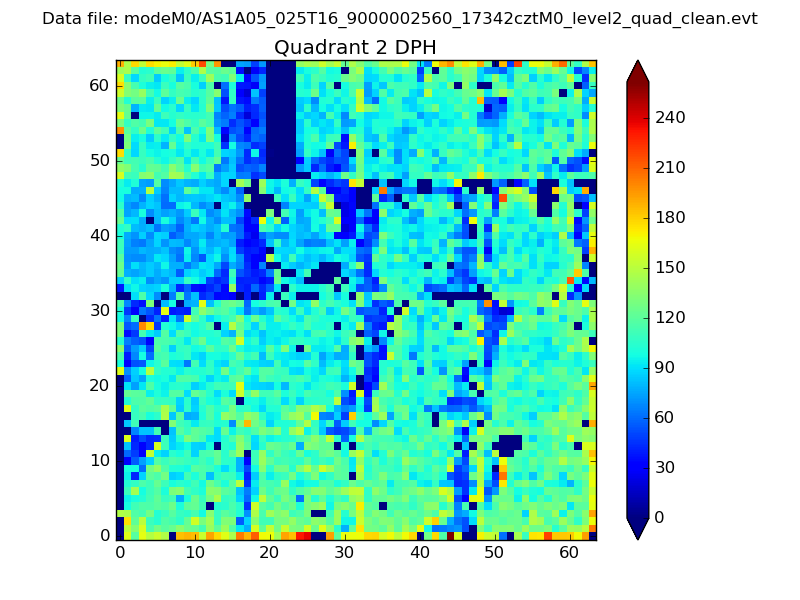
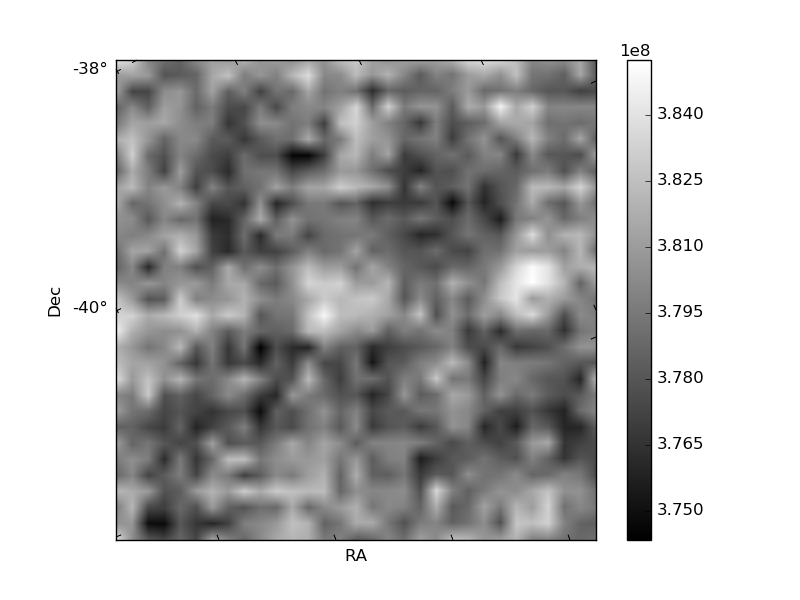
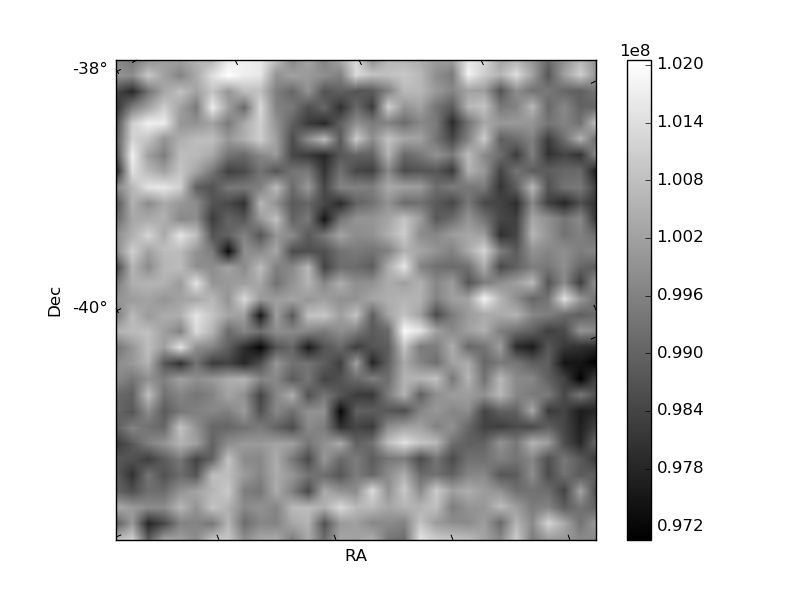
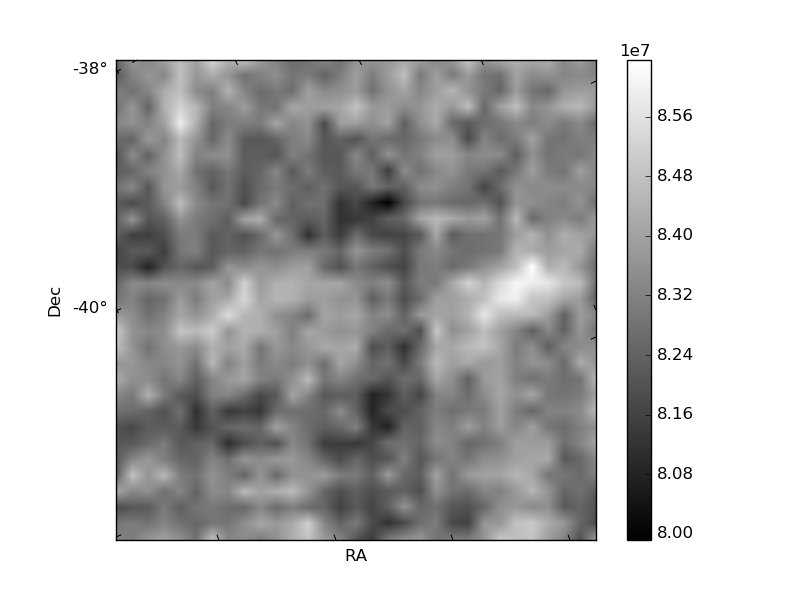
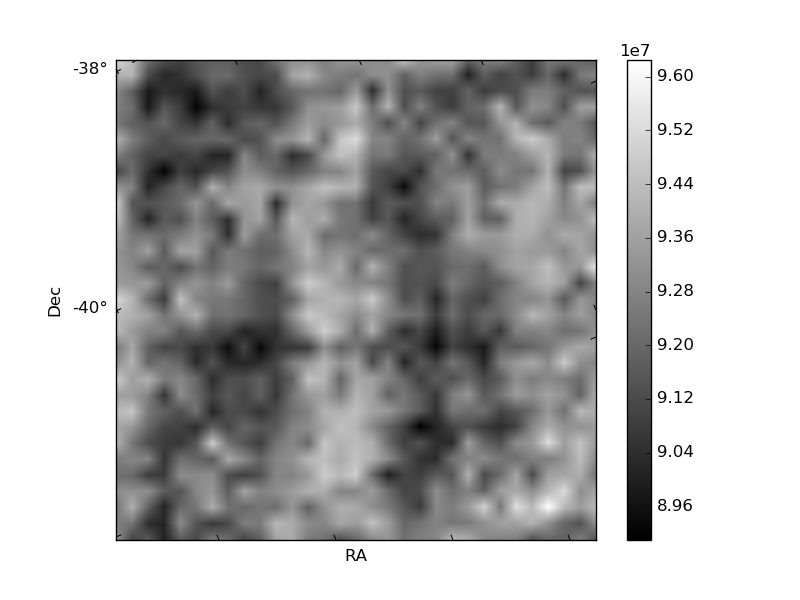
Histogram calculated using DETX and DETY for each event in the final _common_clean file
| Quadrant A | 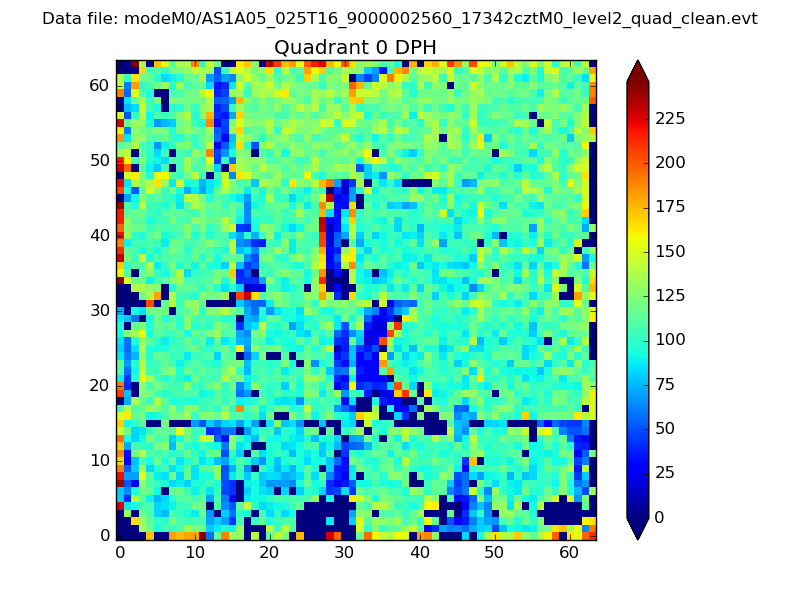 |
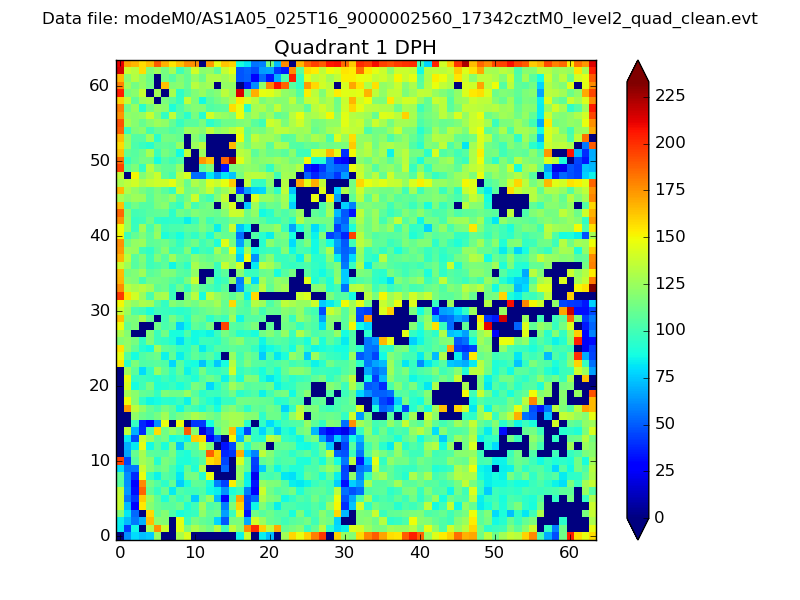 |
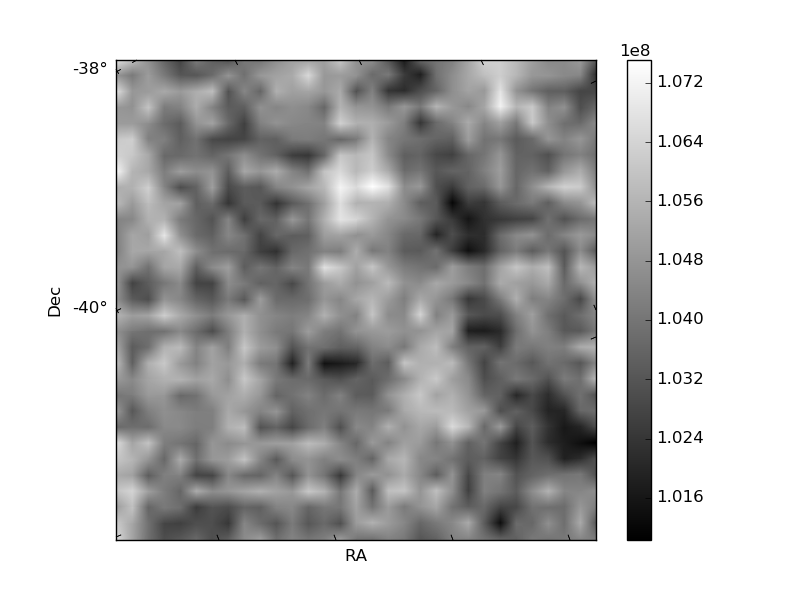
Quadrant B |
|---|---|---|---|
| Quadrant D | 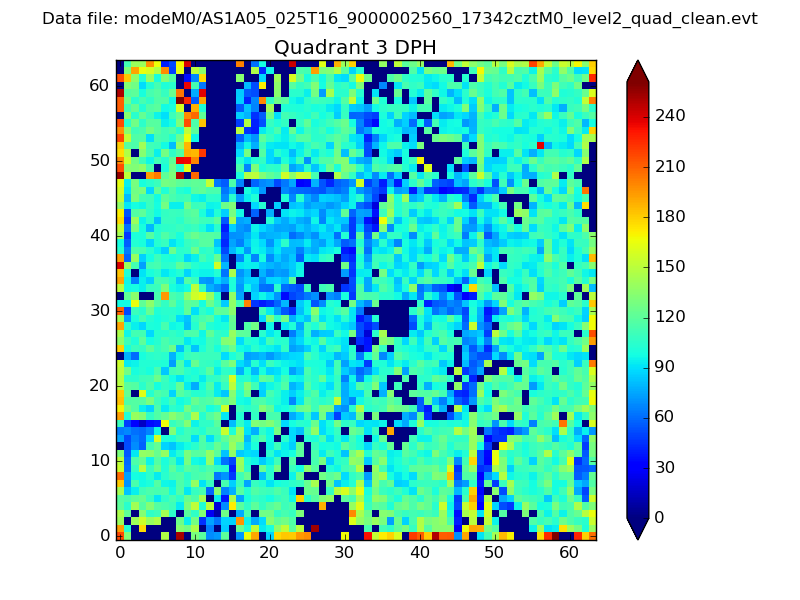 |
 |
Quadrant C |
| Plot type | Count rate plots | Images |
|---|---|---|
| Comparison with Poisson distribution Blue bars denote a histogram of data divided into 1 sec bins. Red curve is a Poisson curve with rate = median count rate of data. |
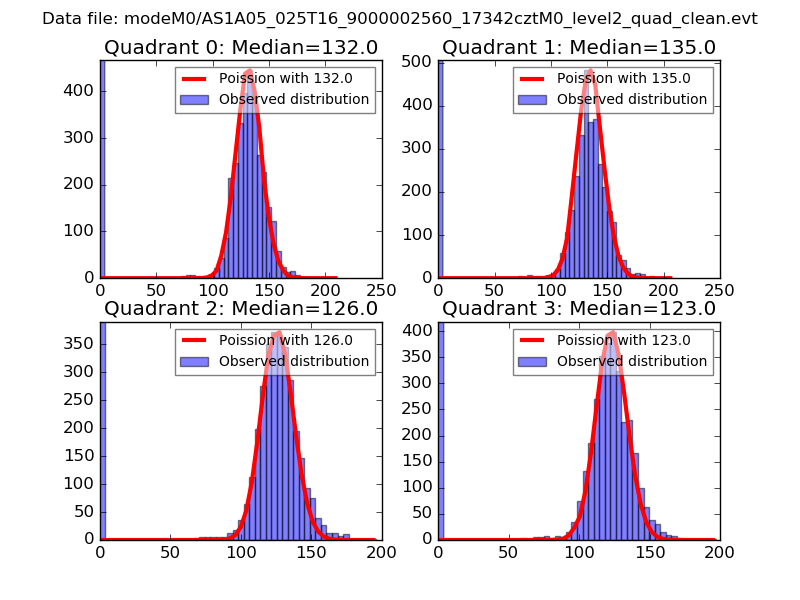 |
 |
| Quadrant-wise count rates Data is divided into 100 sec bins |
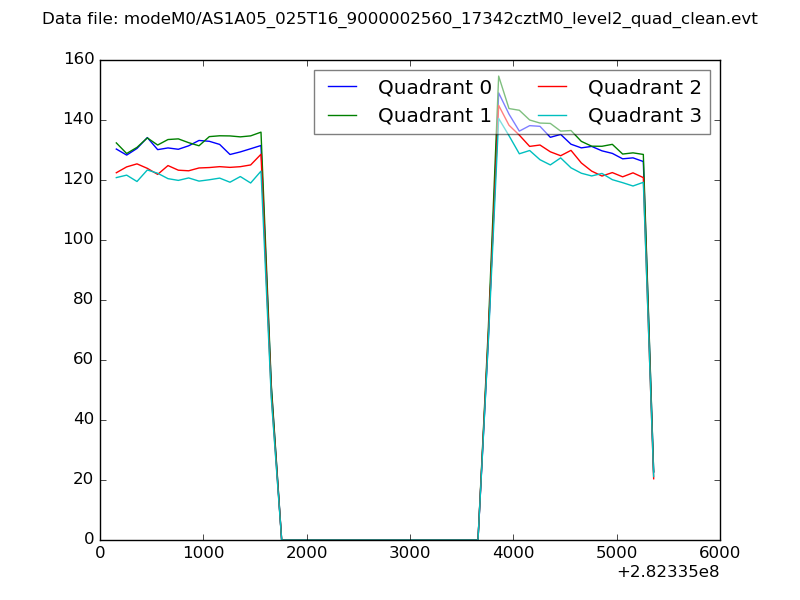 |
|
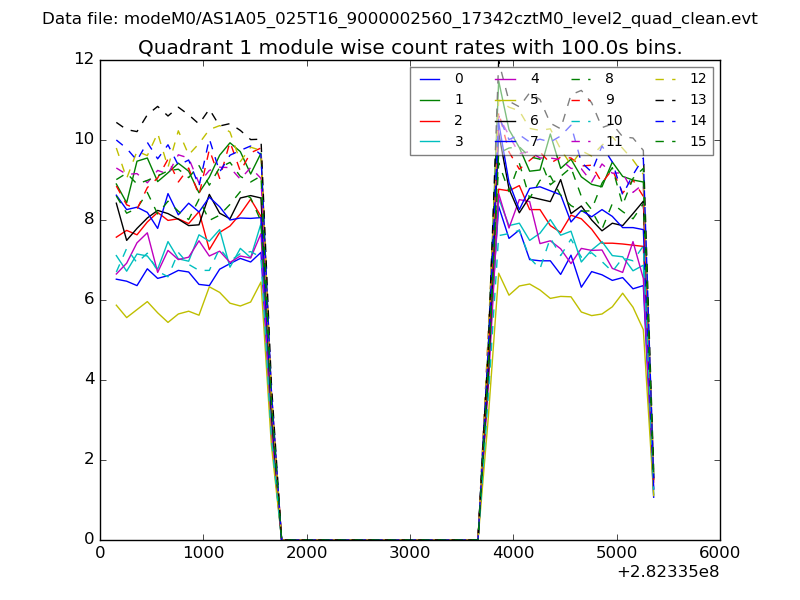
| Module-wise count rates for Quadrant A Data is divided into 100 sec bins |
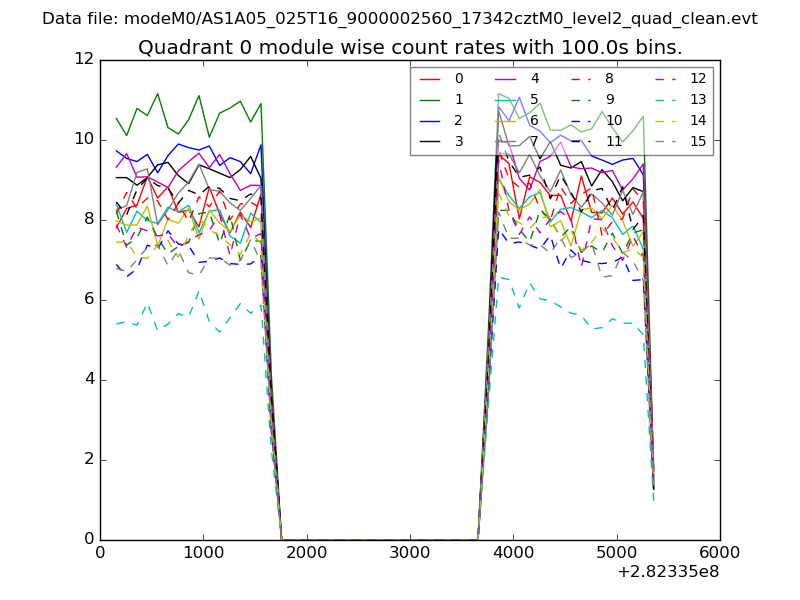 |
 |
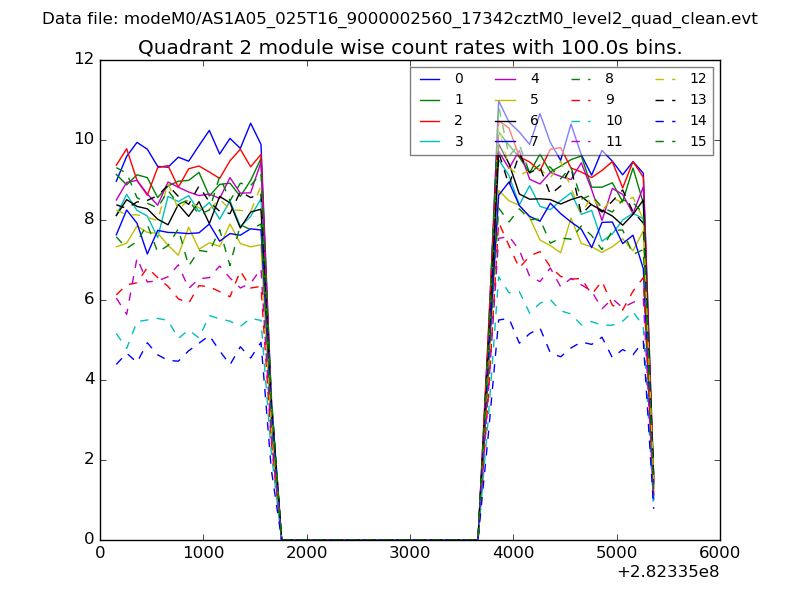
| Module-wise count rates for Quadrant B Data is divided into 100 sec bins |
 |
 |
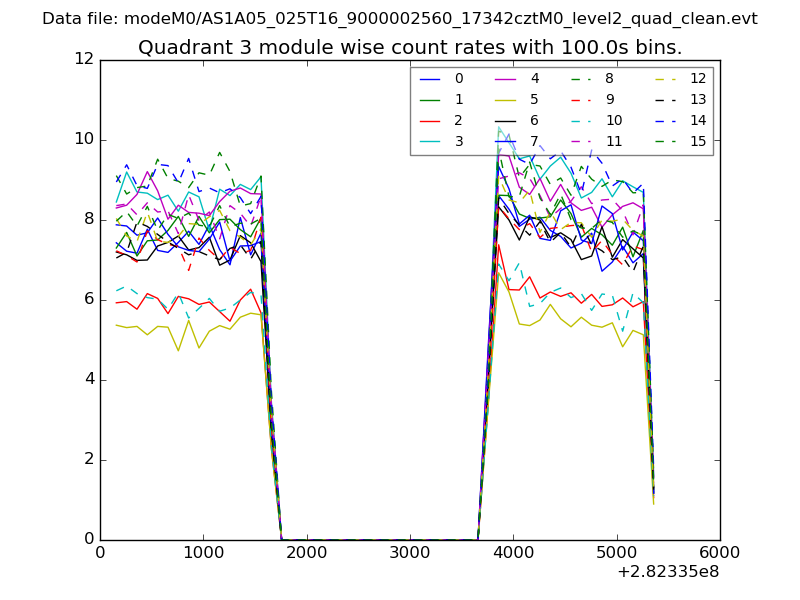
| Module-wise count rates for Quadrant C Data is divided into 100 sec bins |
 |
 |
| Module-wise count rates for Quadrant D Data is divided into 100 sec bins |
 |
 |
| Parameter | Plot |
|---|---|
| CZT HV Monitor | 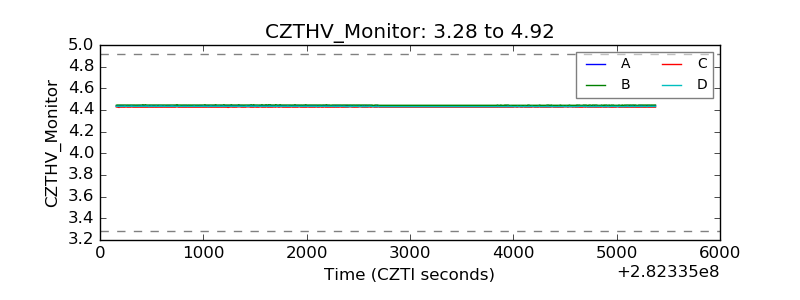 |
| D_VDD | 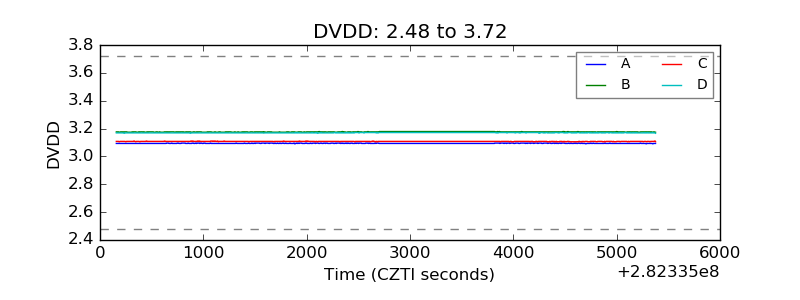 |
| Temperature 1 | 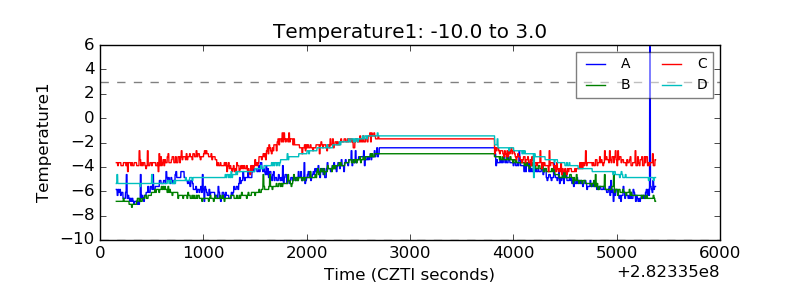 |
| Veto HV Monitor | 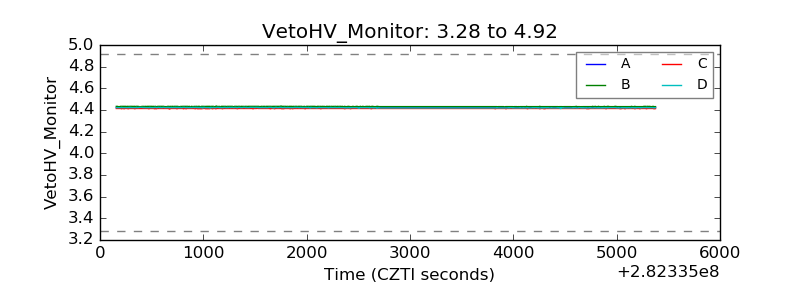 |
| Veto LLD | 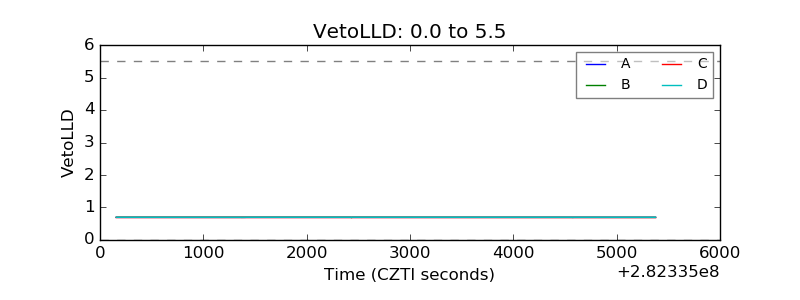 |
| Alpha Counter | 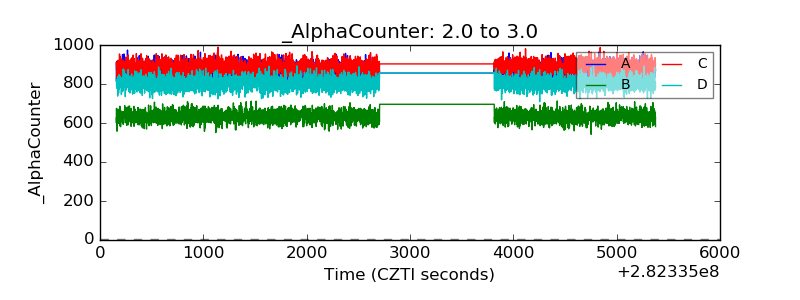 |
| _CPM_Rate | 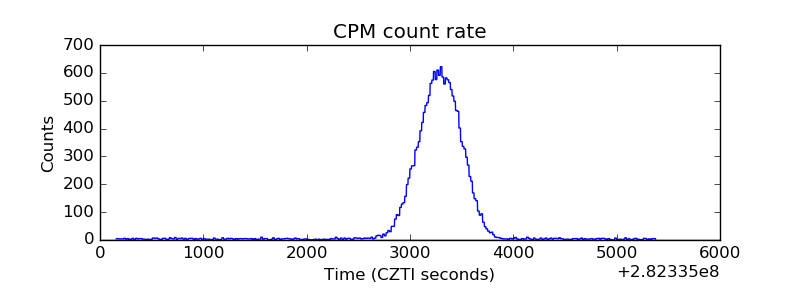 |
| CZT Counter | 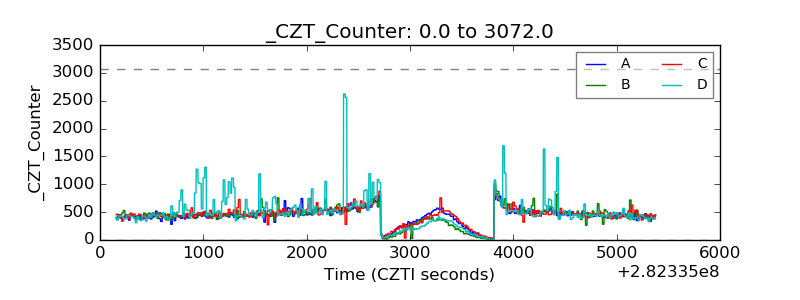 |
| +2.5 Volts monitor |  |
| +5 Volts monitor |  |
| _ROLL_ROT | 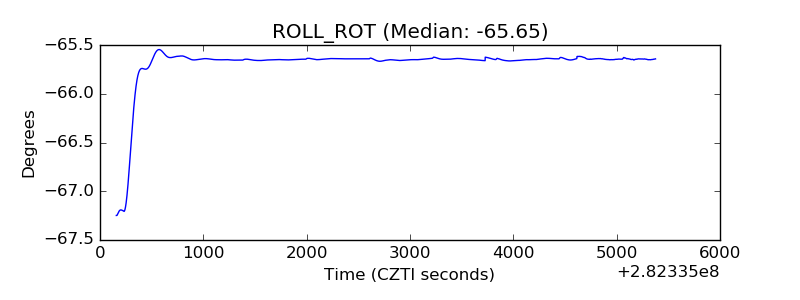 |
| _Roll_DEC | 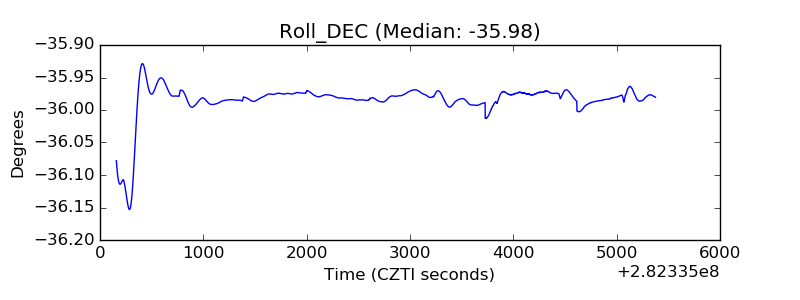 |
| _Roll_RA | 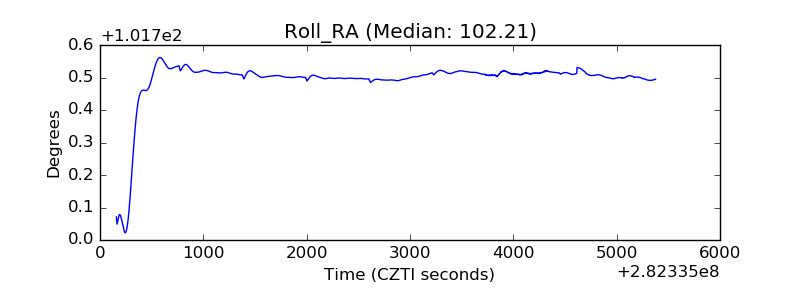 |
| Veto Counter | 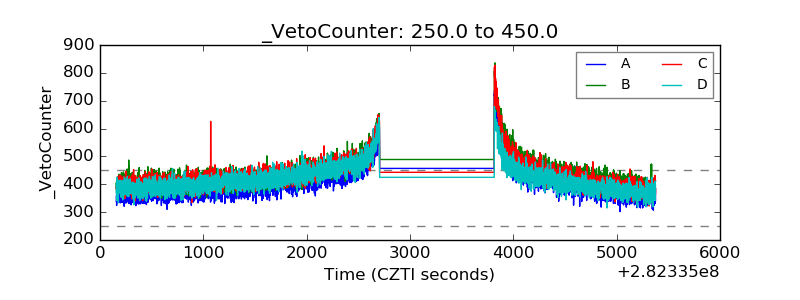 |