| Param | Original file | Final file |
|---|---|---|
| Filename | modeM0/AS1A05_025T16_9000002560_17343cztM0_level2.evt | modeM0/AS1A05_025T16_9000002560_17343cztM0_level2_quad_clean.evt |
| Size (bytes) | 499,743,360 | 106,758,720 |
| Size | 476.6 MB | 101.8 MB |
| Events in quadrant A | 3,364,643 | 700,379 |
| Events in quadrant B | 3,473,007 | 710,606 |
| Events in quadrant C | 3,758,821 | 665,409 |
| Events in quadrant D | 4,043,491 | 649,817 |
| Mode M9 | |||
|---|---|---|---|
| Quadrant | BADHDUFLAG | Total packets | Discarded packets |
| A | 0 | 19 | 0 |
| B | 0 | 19 | 0 |
| C | 0 | 19 | 0 |
| D | 0 | 19 | 0 |
| Mode M0 | |||
|---|---|---|---|
| Quadrant | BADHDUFLAG | Total packets | Discarded packets |
| A | 0 | 15005 | 3 |
| B | 0 | 15217 | 2 |
| C | 0 | 16073 | 2 |
| D | 0 | 17249 | 2 |
| Mode SS | |||
|---|---|---|---|
| Quadrant | BADHDUFLAG | Total packets | Discarded packets |
| A | 0 | 150 | 0 |
| B | 0 | 150 | 0 |
| C | 0 | 150 | 0 |
| D | 0 | 150 | 0 |
| Quadrant | Total seconds | Saturated seconds | Saturation percentage |
|---|---|---|---|
| A | 7282 | 35 | 0.480637% |
| B | 7283 | 64 | 0.878759% |
| C | 7283 | 196 | 2.691199% |
| D | 7283 | 134 | 1.839901% |
Noise dominated data is calculated using 1-second bins in cleaned event files. If a bin has >2000 counts, and if more than 50% of those come from <1% of pixels, then it is considered to be noise-dominated and hence unusable.
| Quadrant | # 1 sec bins | Bins with >0 counts | Bins with >2000 counts | High rate bins dominated by noise | Noise dominated (total time) | Noise dominated (detector-on time) | Marked lightcurve |
|---|---|---|---|---|---|---|---|
| A | 9172 | 7284 | 0 | 0 | 0.00% | 0.00% | 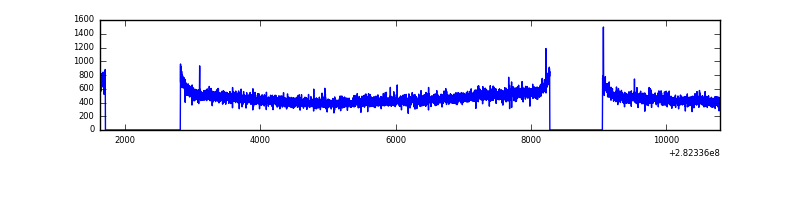 |
| B | 9173 | 7285 | 2 | 2 | 0.02% | 0.03% | 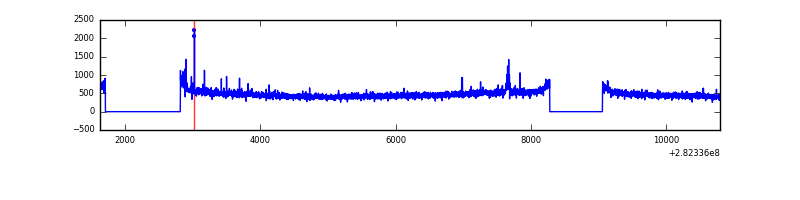 |
| C | 9173 | 7285 | 80 | 80 | 0.87% | 1.10% | 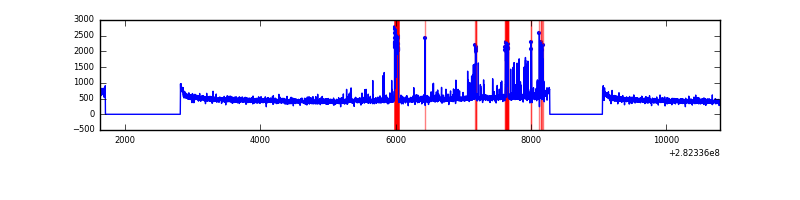 |
| D | 9173 | 7285 | 77 | 77 | 0.84% | 1.06% | 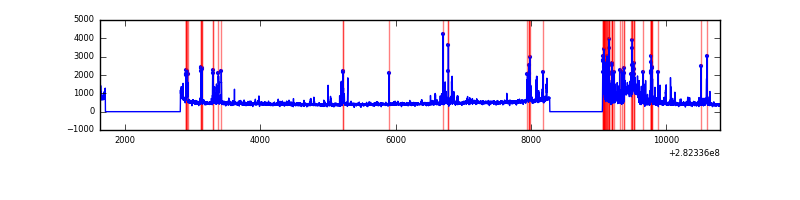 |
Top three noisy pixels from each quadrant. If the there are fewer than three noisy pixels in the level2.evt file, extra rows are filled as -1
| Pixel properties | Quadrant properties | ||||||
|---|---|---|---|---|---|---|---|
| Quadrant | DetID | PixID | Counts | Sigma | Mean | Median | Sigma |
| A | 0 | 226 | 7484 | 37.76 | 872 | 854 | 175.6 |
| A | 10 | 1 | 7255 | 36.46 | 872 | 854 | 175.6 |
| A | 3 | 137 | 6756 | 33.62 | 872 | 854 | 175.6 |
| B | 12 | 111 | 20181 | 114.14 | 876 | 853 | 169.3 |
| B | 0 | 230 | 19844 | 112.15 | 876 | 853 | 169.3 |
| B | 11 | 111 | 17639 | 99.13 | 876 | 853 | 169.3 |
| C | 3 | 233 | 386488 | 1988.38 | 830 | 838 | 194.0 |
| C | 14 | 238 | 129168 | 661.66 | 830 | 838 | 194.0 |
| C | 13 | 61 | 6006 | 26.65 | 830 | 838 | 194.0 |
| D | 13 | 189 | 206503 | 1029.29 | 830 | 807 | 199.8 |
| D | 7 | 38 | 185312 | 923.25 | 830 | 807 | 199.8 |
| D | 10 | 70 | 132776 | 660.37 | 830 | 807 | 199.8 |
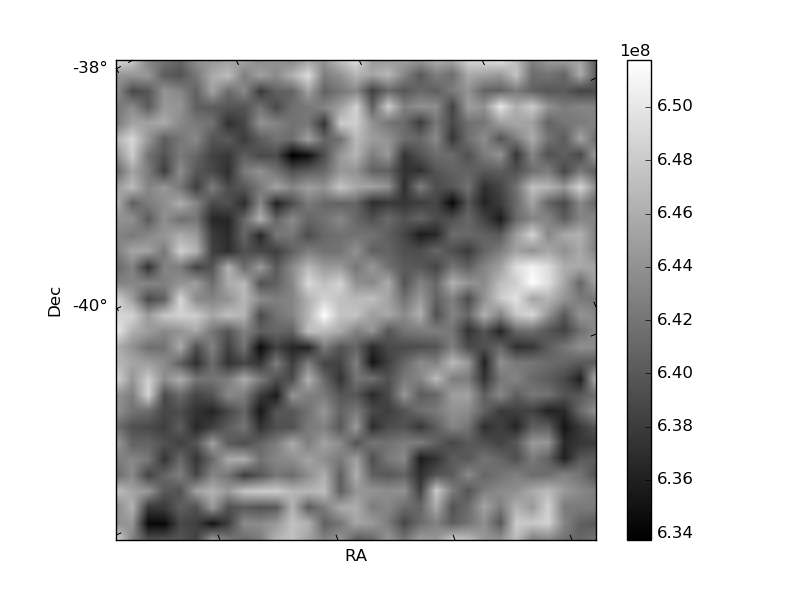
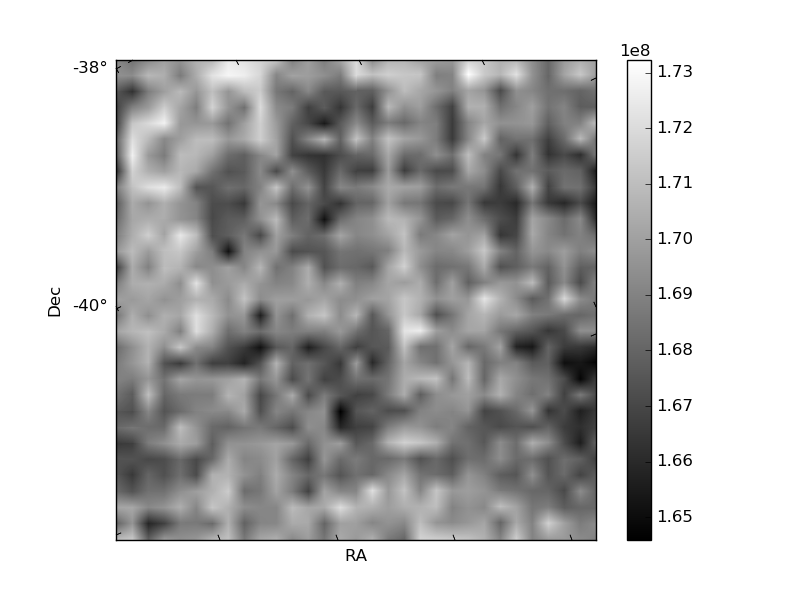
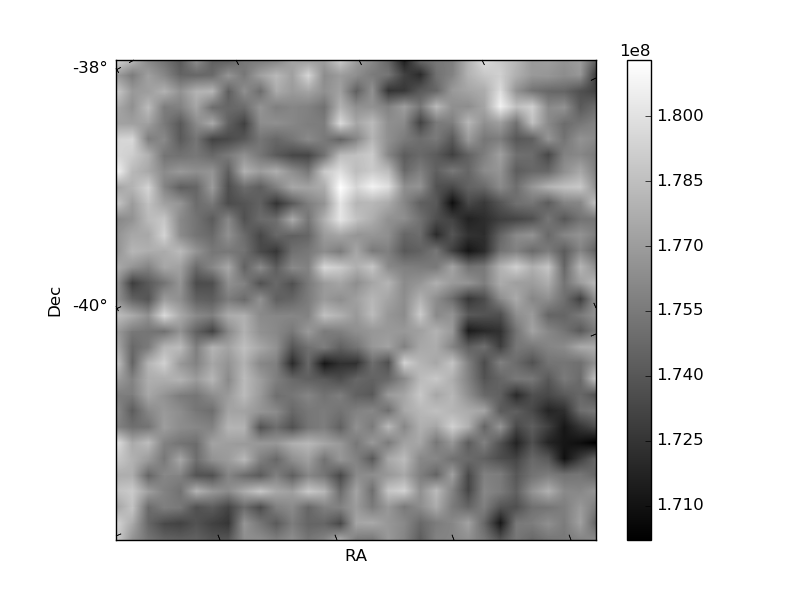
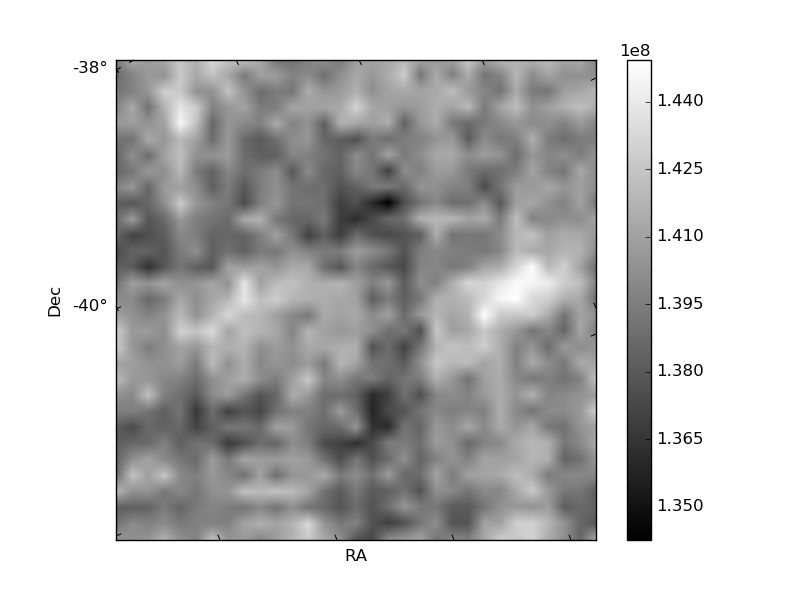
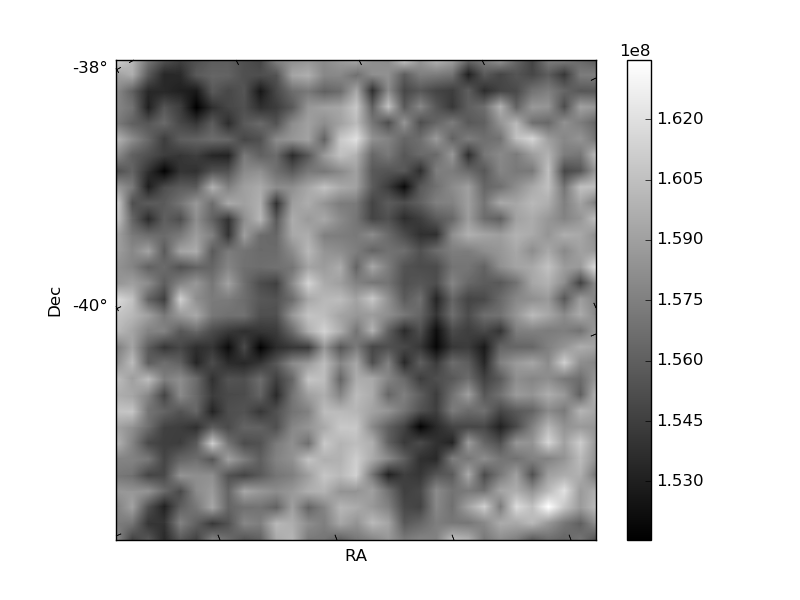
Histogram calculated using DETX and DETY for each event in the final _common_clean file
| Quadrant A | 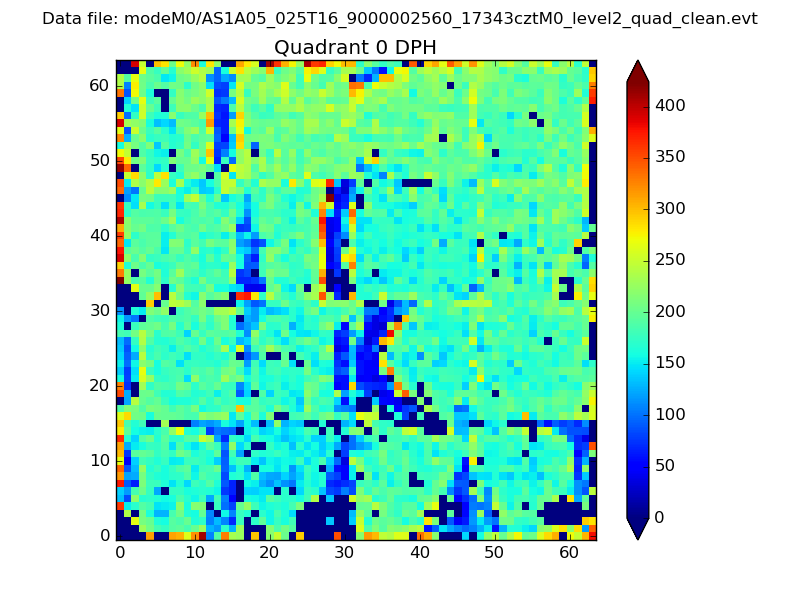 |
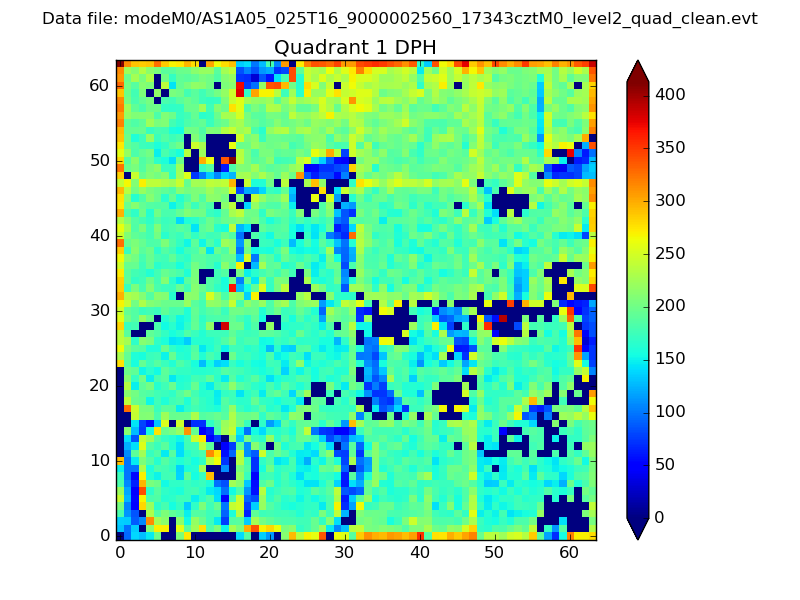 |
Quadrant B |
|---|---|---|---|
| Quadrant D | 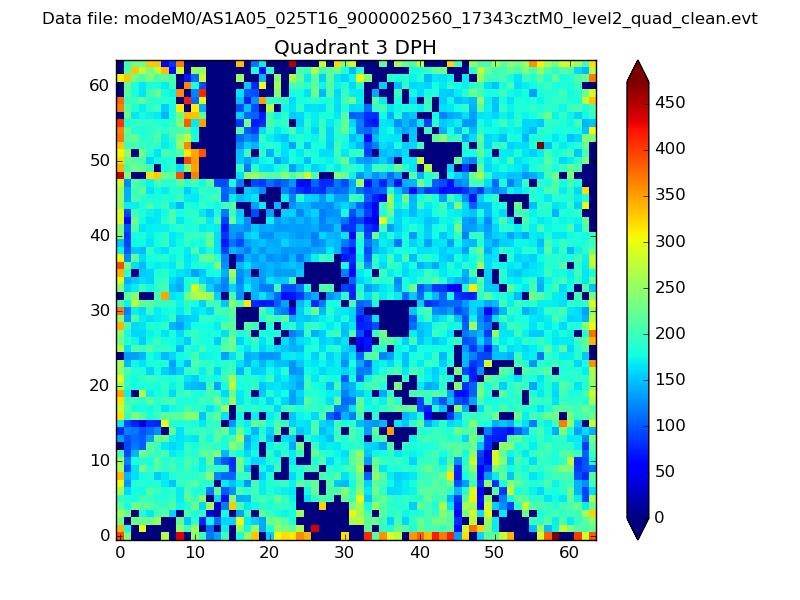 |
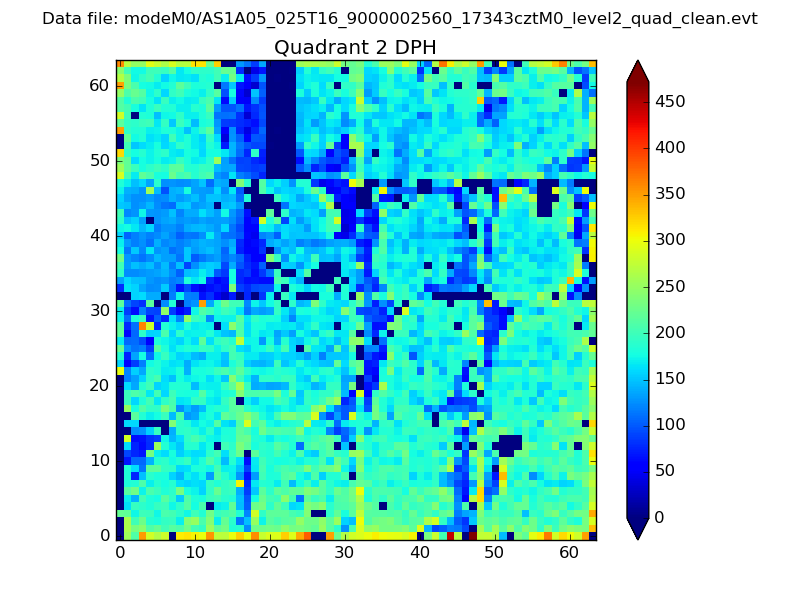 |
Quadrant C |
| Plot type | Count rate plots | Images |
|---|---|---|
| Comparison with Poisson distribution Blue bars denote a histogram of data divided into 1 sec bins. Red curve is a Poisson curve with rate = median count rate of data. |
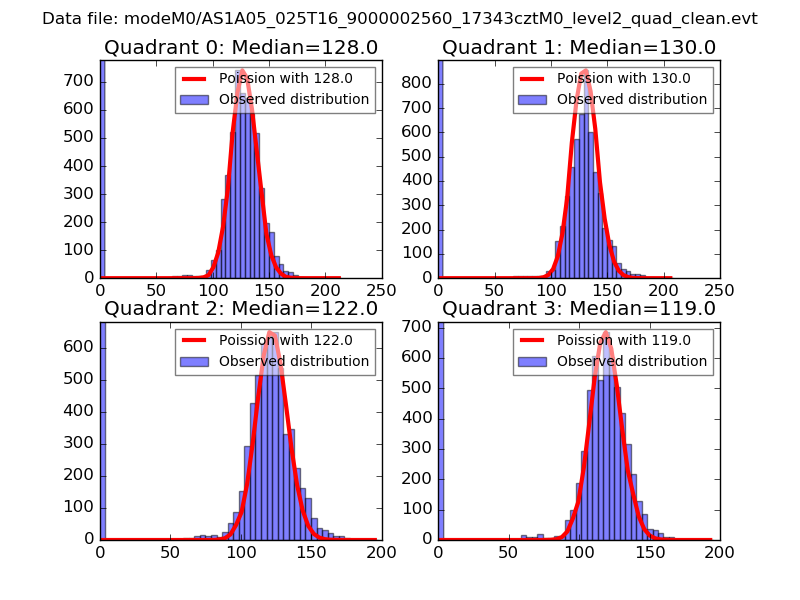 |
 |
| Quadrant-wise count rates Data is divided into 100 sec bins |
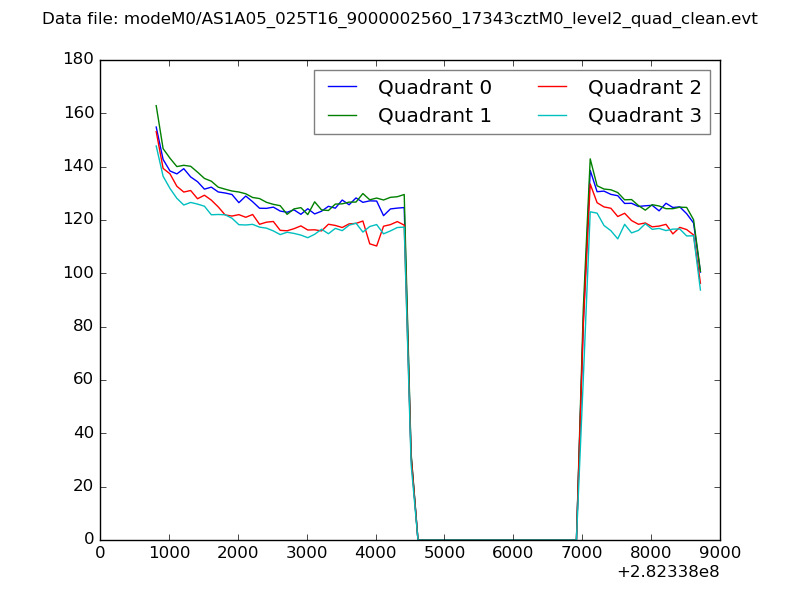 |
|
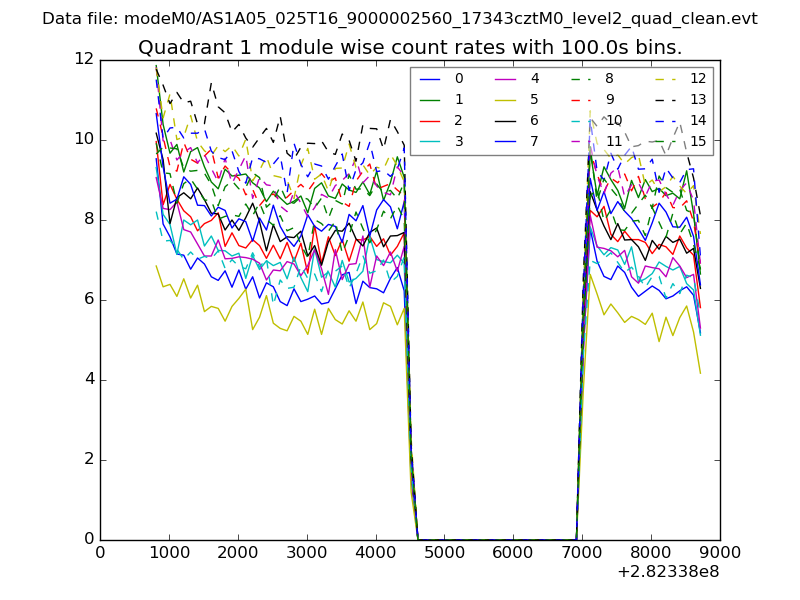
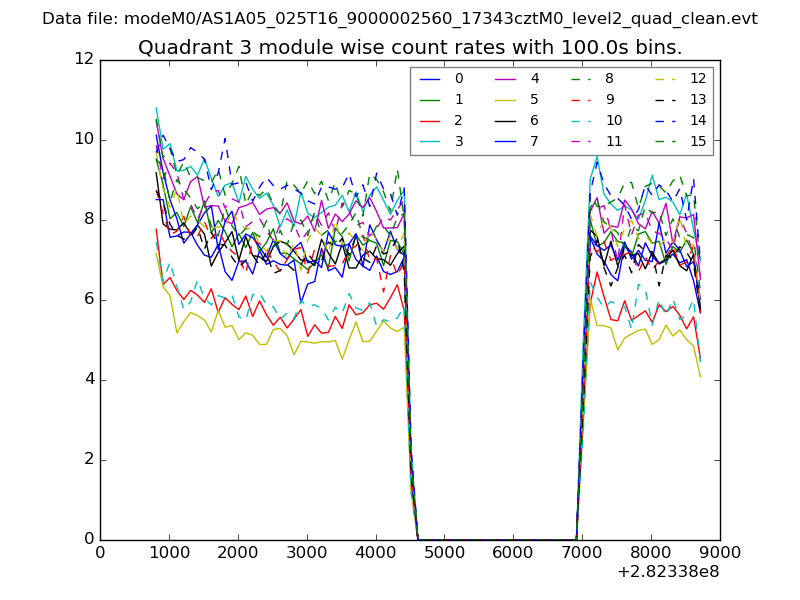
| Module-wise count rates for Quadrant A Data is divided into 100 sec bins |
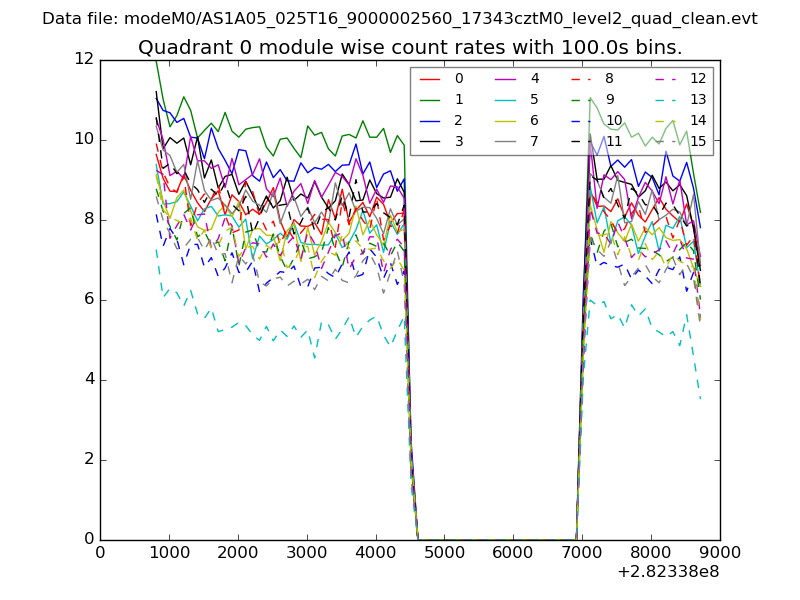 |
 |
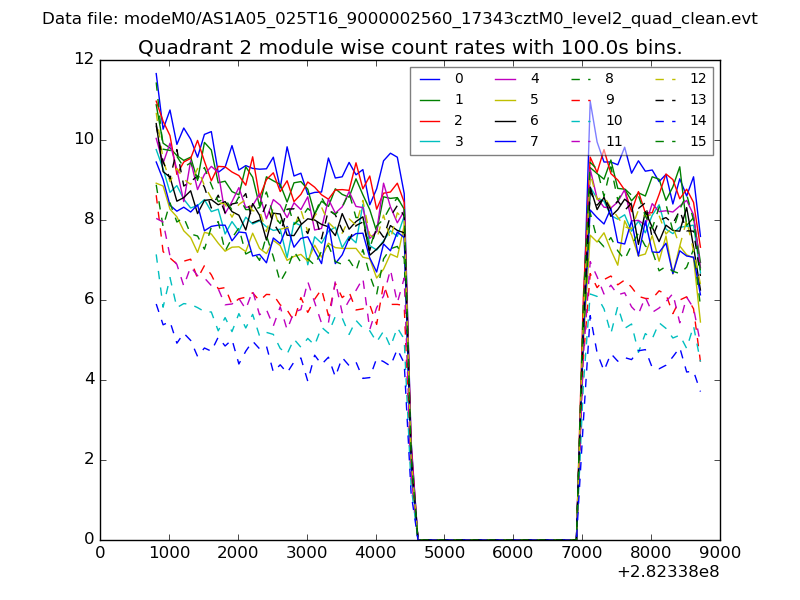
| Module-wise count rates for Quadrant B Data is divided into 100 sec bins |
 |
 |
| Module-wise count rates for Quadrant C Data is divided into 100 sec bins |
 |
 |
| Module-wise count rates for Quadrant D Data is divided into 100 sec bins |
 |
 |
| Parameter | Plot |
|---|---|
| CZT HV Monitor | 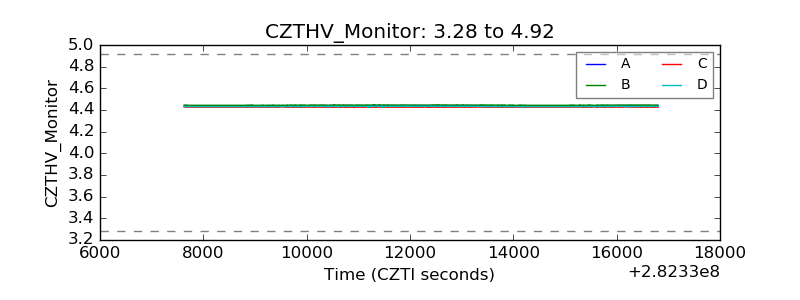 |
| D_VDD | 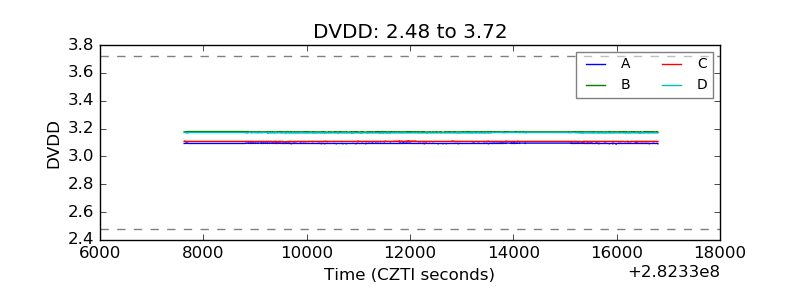 |
| Temperature 1 | 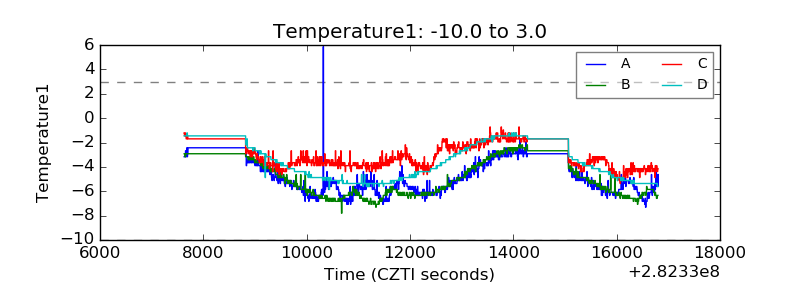 |
| Veto HV Monitor | 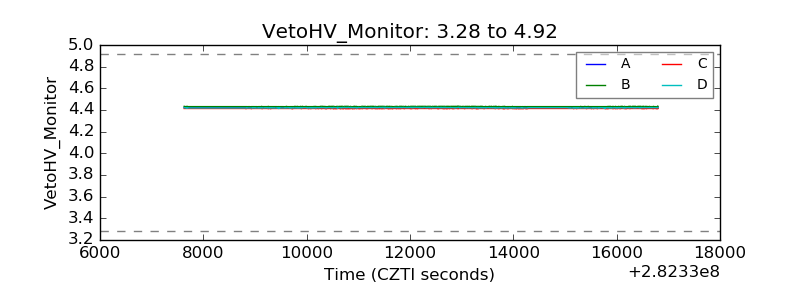 |
| Veto LLD | 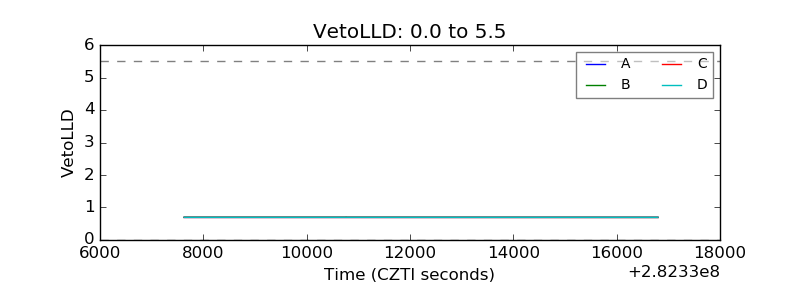 |
| Alpha Counter | 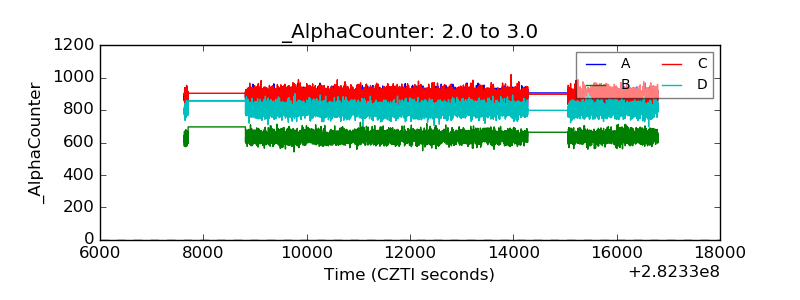 |
| _CPM_Rate | 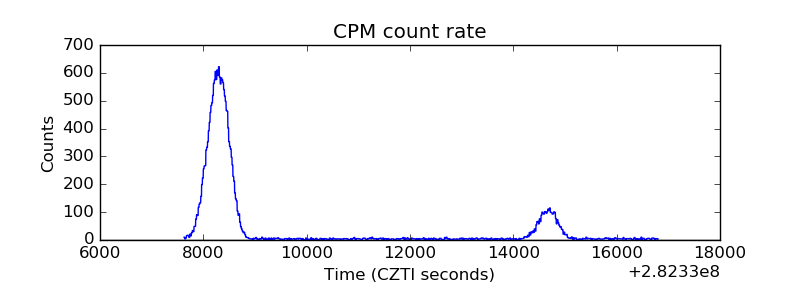 |
| CZT Counter | 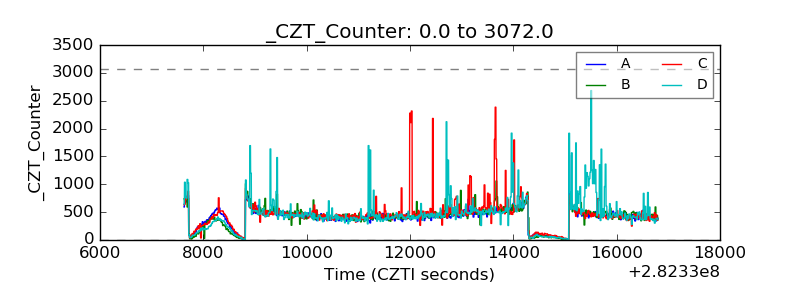 |
| +2.5 Volts monitor |  |
| +5 Volts monitor |  |
| _ROLL_ROT | 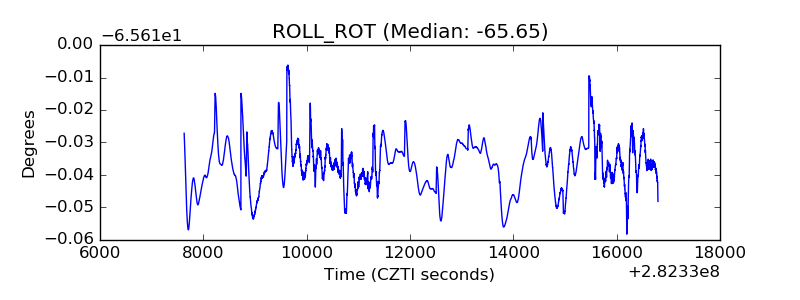 |
| _Roll_DEC | 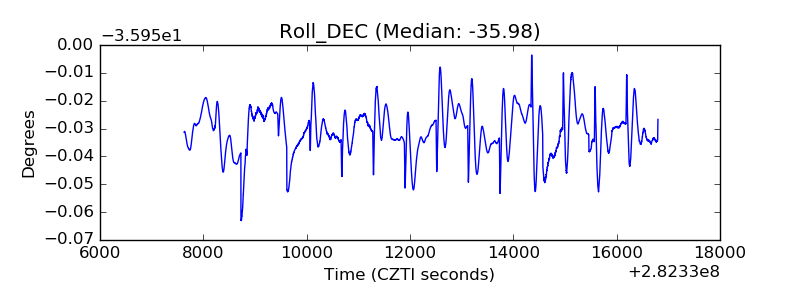 |
| _Roll_RA | 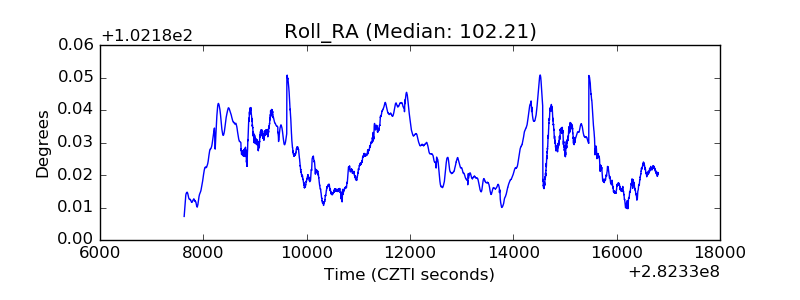 |
| Veto Counter | 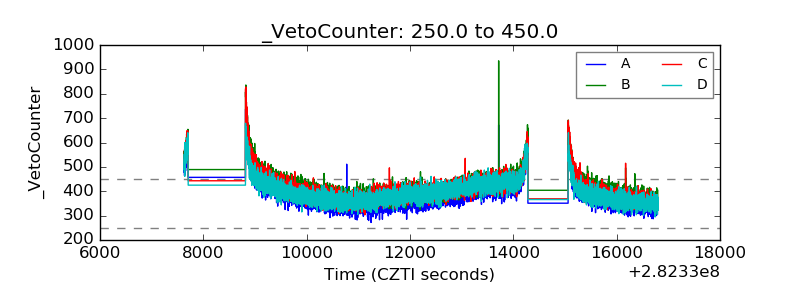 |