| Param | Original file | Final file |
|---|---|---|
| Filename | modeM0/AS1A05_025T16_9000002560_17345cztM0_level2.evt | modeM0/AS1A05_025T16_9000002560_17345cztM0_level2_quad_clean.evt |
| Size (bytes) | 509,235,840 | 107,147,520 |
| Size | 485.6 MB | 102.2 MB |
| Events in quadrant A | 3,524,724 | 697,586 |
| Events in quadrant B | 3,650,564 | 701,941 |
| Events in quadrant C | 3,681,649 | 661,635 |
| Events in quadrant D | 4,045,116 | 651,224 |
| Mode M9 | |||
|---|---|---|---|
| Quadrant | BADHDUFLAG | Total packets | Discarded packets |
| A | 0 | 5 | 0 |
| B | 0 | 5 | 0 |
| C | 0 | 5 | 0 |
| D | 0 | 5 | 0 |
| Mode M0 | |||
|---|---|---|---|
| Quadrant | BADHDUFLAG | Total packets | Discarded packets |
| A | 0 | 15773 | 2 |
| B | 0 | 15902 | 2 |
| C | 0 | 16036 | 2 |
| D | 0 | 17596 | 2 |
| Mode SS | |||
|---|---|---|---|
| Quadrant | BADHDUFLAG | Total packets | Discarded packets |
| A | 0 | 158 | 0 |
| B | 0 | 158 | 0 |
| C | 0 | 158 | 0 |
| D | 0 | 158 | 0 |
| Quadrant | Total seconds | Saturated seconds | Saturation percentage |
|---|---|---|---|
| A | 7653 | 30 | 0.392003% |
| B | 7653 | 91 | 1.189076% |
| C | 7653 | 120 | 1.568013% |
| D | 7654 | 122 | 1.593938% |
Noise dominated data is calculated using 1-second bins in cleaned event files. If a bin has >2000 counts, and if more than 50% of those come from <1% of pixels, then it is considered to be noise-dominated and hence unusable.
| Quadrant | # 1 sec bins | Bins with >0 counts | Bins with >2000 counts | High rate bins dominated by noise | Noise dominated (total time) | Noise dominated (detector-on time) | Marked lightcurve |
|---|---|---|---|---|---|---|---|
| A | 8248 | 7655 | 0 | 0 | 0.00% | 0.00% | 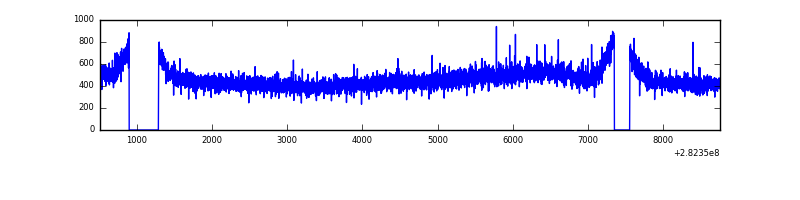 |
| B | 8248 | 7655 | 0 | 0 | 0.00% | 0.00% | 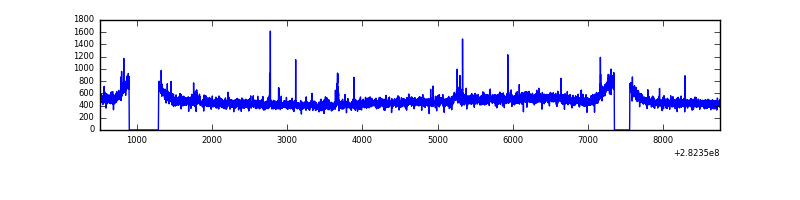 |
| C | 8248 | 7655 | 0 | 0 | 0.00% | 0.00% | 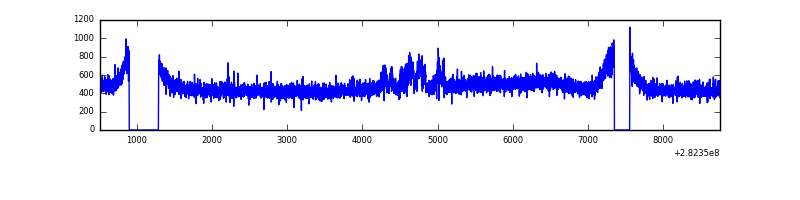 |
| D | 8249 | 7656 | 69 | 69 | 0.84% | 0.90% | 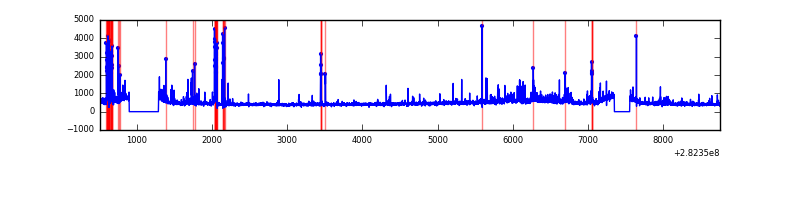 |
Top three noisy pixels from each quadrant. If the there are fewer than three noisy pixels in the level2.evt file, extra rows are filled as -1
| Pixel properties | Quadrant properties | ||||||
|---|---|---|---|---|---|---|---|
| Quadrant | DetID | PixID | Counts | Sigma | Mean | Median | Sigma |
| A | 0 | 226 | 7833 | 37.23 | 915 | 895 | 186.4 |
| A | 3 | 137 | 7354 | 34.66 | 915 | 895 | 186.4 |
| A | 12 | 194 | 6679 | 31.04 | 915 | 895 | 186.4 |
| B | 0 | 214 | 22337 | 119.78 | 918 | 892 | 179.0 |
| B | 12 | 111 | 21917 | 117.43 | 918 | 892 | 179.0 |
| B | 11 | 111 | 18952 | 100.87 | 918 | 892 | 179.0 |
| C | 14 | 238 | 134299 | 644.86 | 877 | 877 | 206.9 |
| C | 3 | 233 | 100262 | 480.35 | 877 | 877 | 206.9 |
| C | 8 | 128 | 13354 | 60.3 | 877 | 877 | 206.9 |
| D | 5 | 222 | 299460 | 1392.57 | 880 | 854 | 214.4 |
| D | 13 | 189 | 137629 | 637.86 | 880 | 854 | 214.4 |
| D | 1 | 52 | 106193 | 491.26 | 880 | 854 | 214.4 |
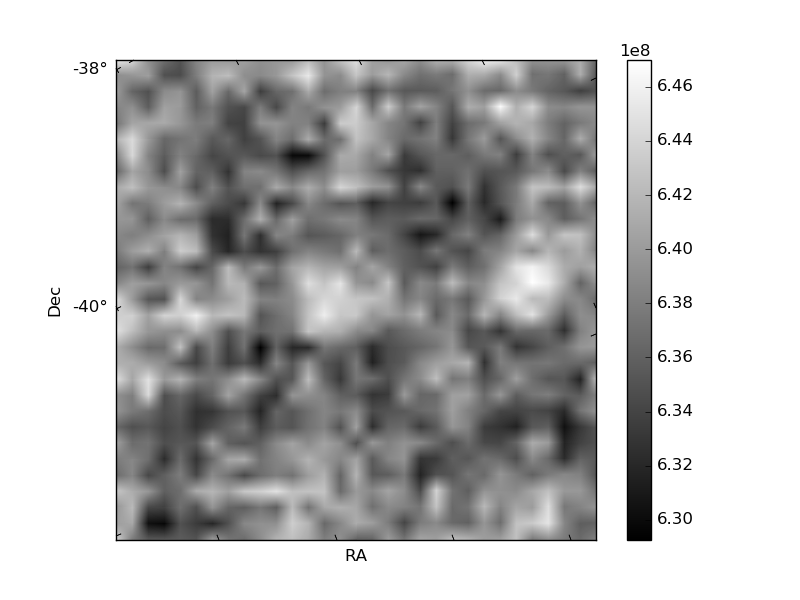
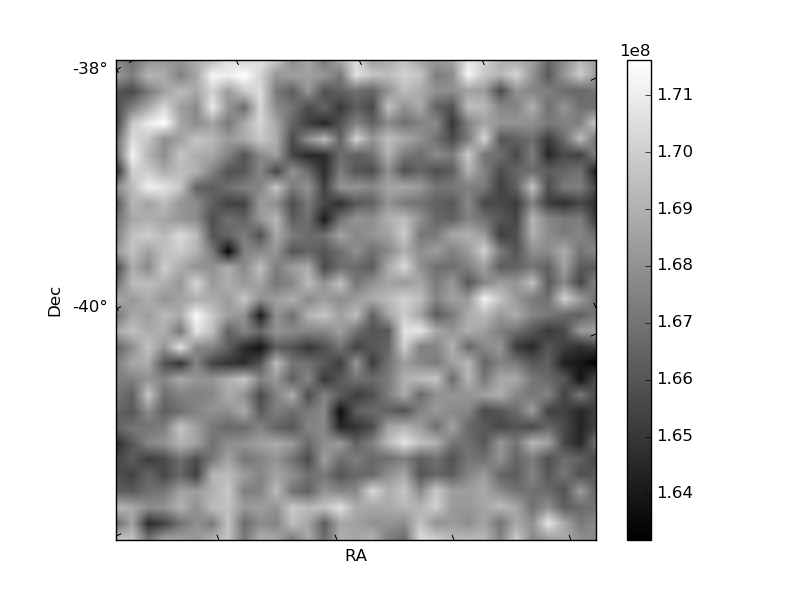
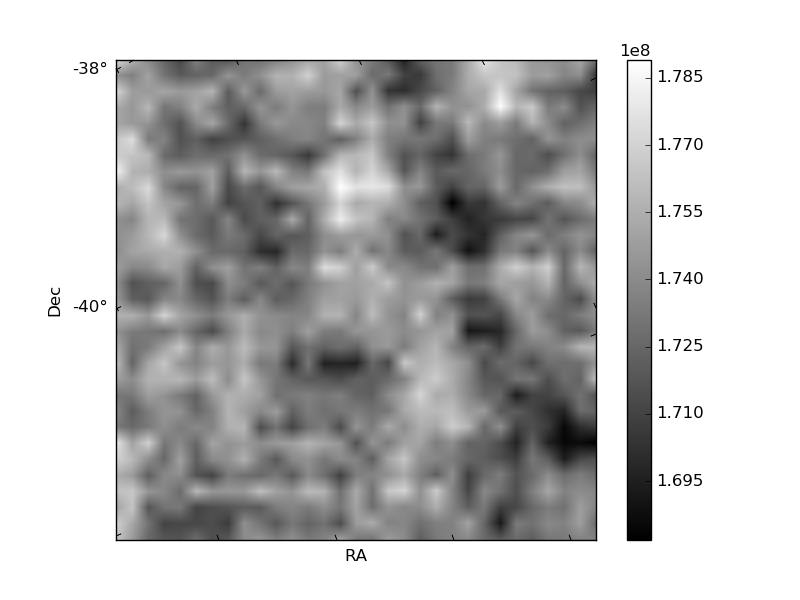
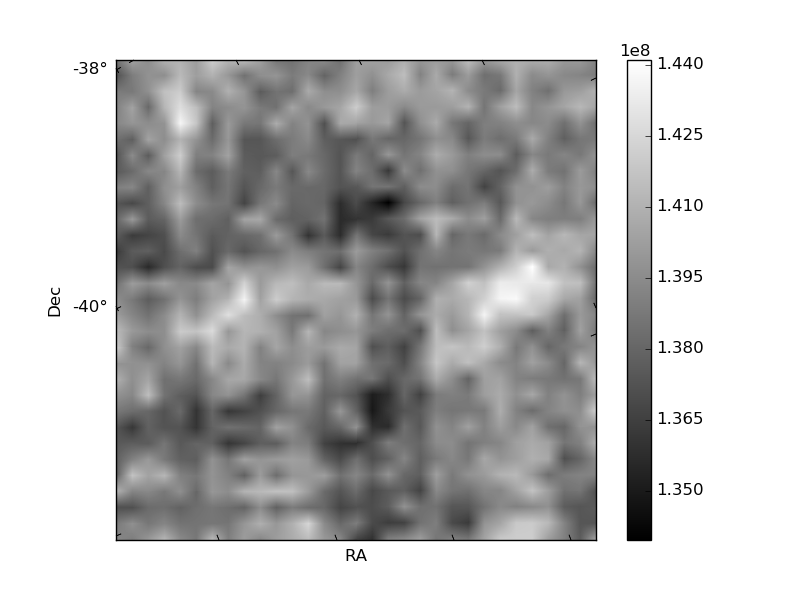
Histogram calculated using DETX and DETY for each event in the final _common_clean file
| Quadrant A | 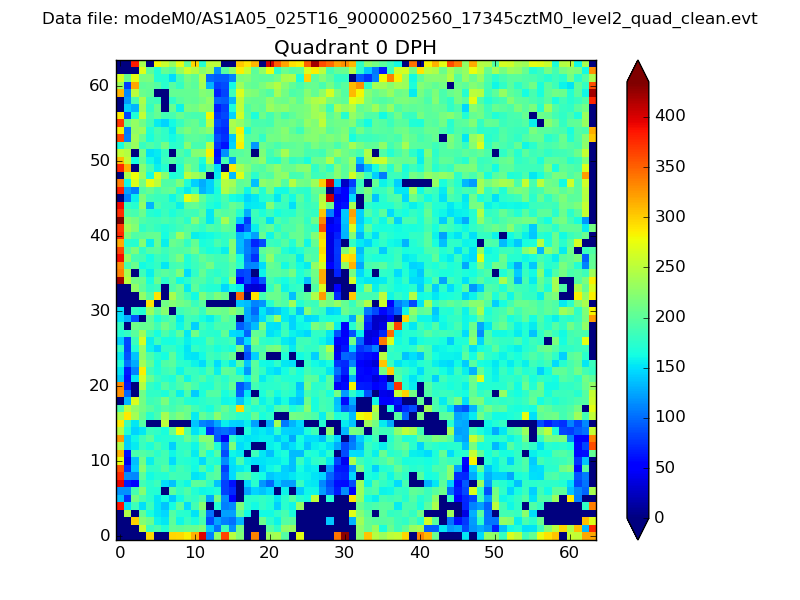 |
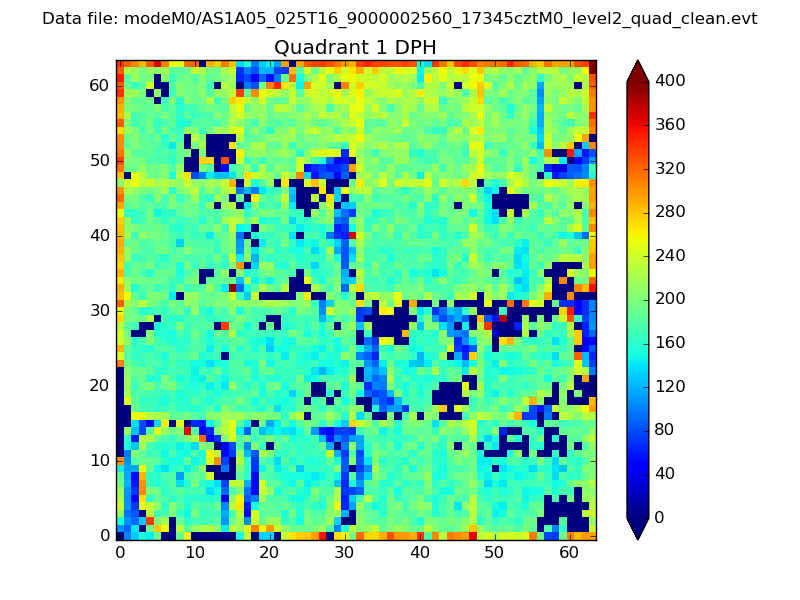 |
Quadrant B |
|---|---|---|---|
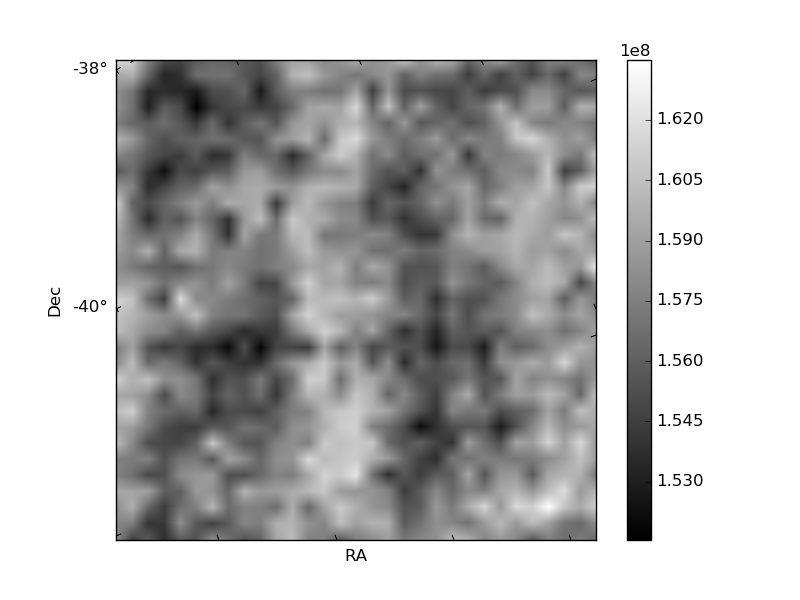
| Quadrant D | 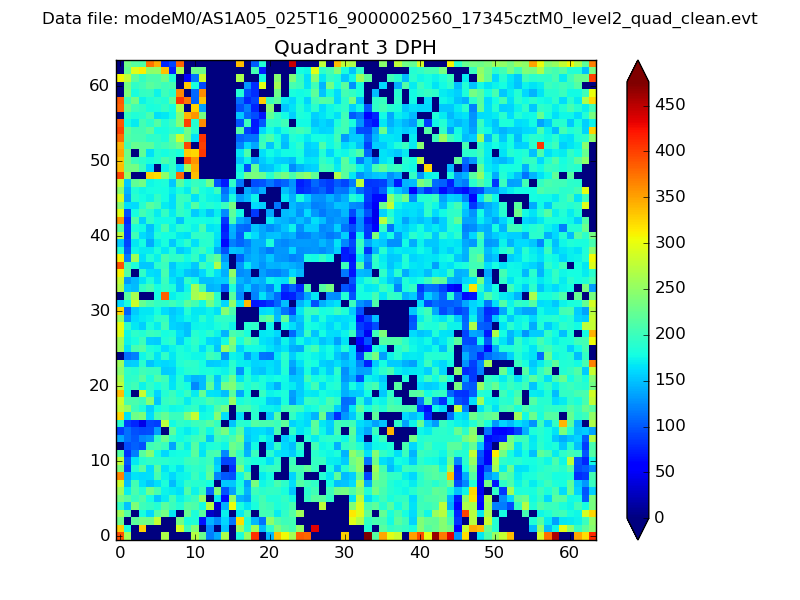 |
 |
Quadrant C |
| Plot type | Count rate plots | Images |
|---|---|---|
| Comparison with Poisson distribution Blue bars denote a histogram of data divided into 1 sec bins. Red curve is a Poisson curve with rate = median count rate of data. |
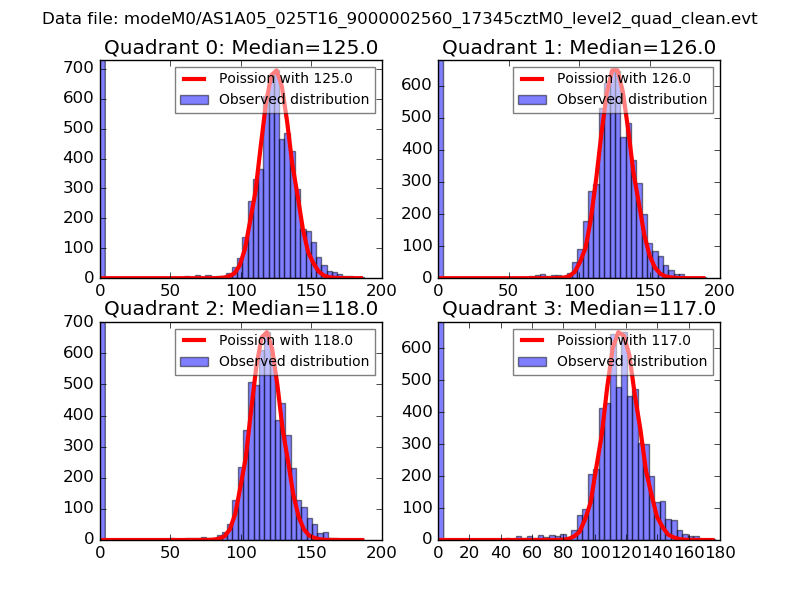 |
 |
| Quadrant-wise count rates Data is divided into 100 sec bins |
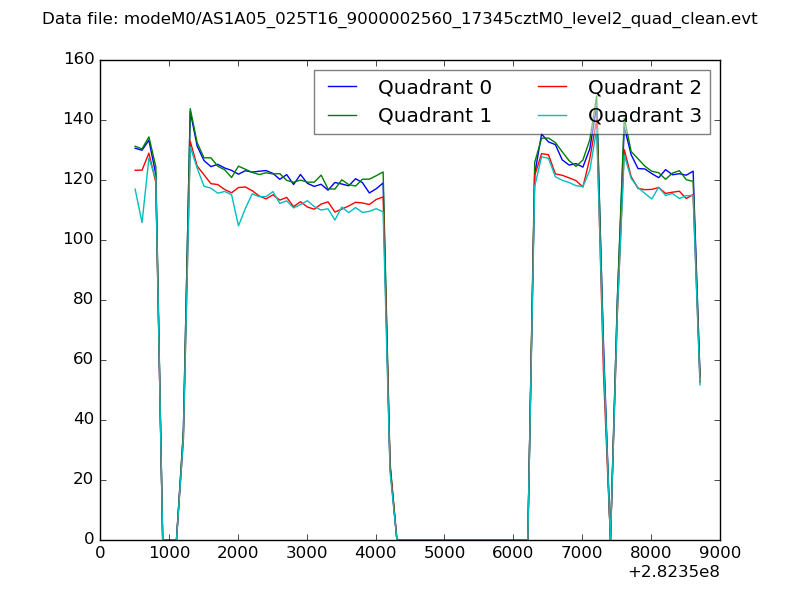 |
|
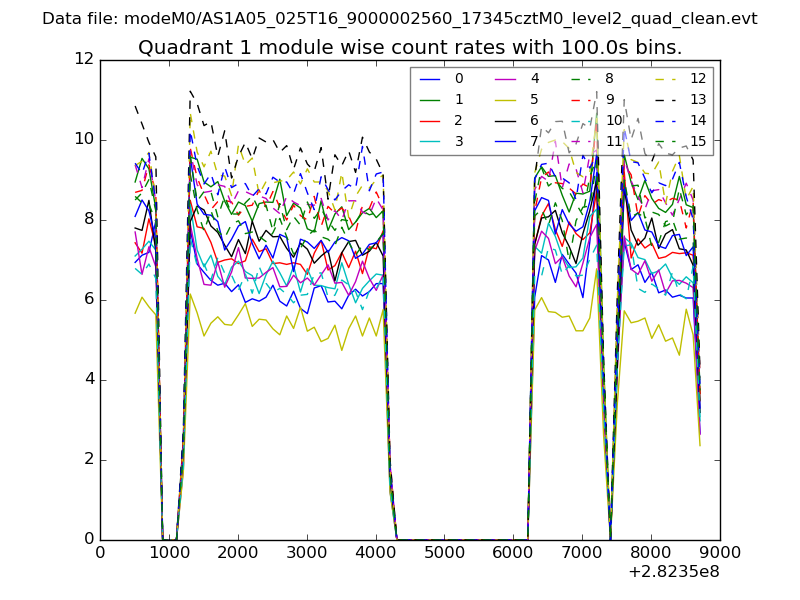
| Module-wise count rates for Quadrant A Data is divided into 100 sec bins |
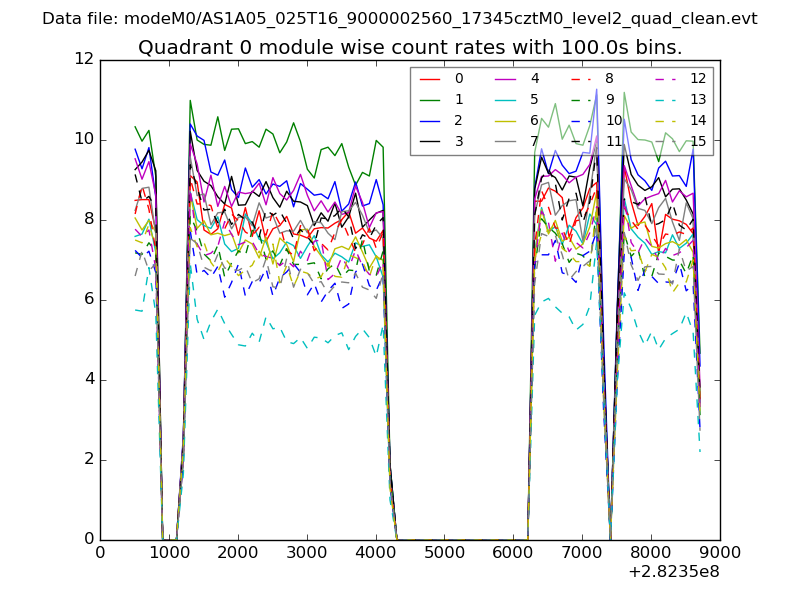 |
 |
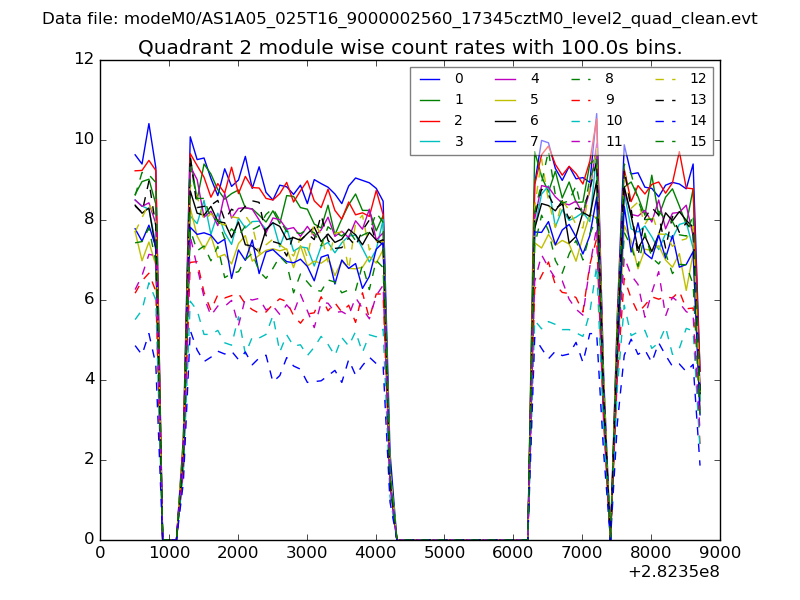
| Module-wise count rates for Quadrant B Data is divided into 100 sec bins |
 |
 |
| Module-wise count rates for Quadrant C Data is divided into 100 sec bins |
 |
 |
| Module-wise count rates for Quadrant D Data is divided into 100 sec bins |
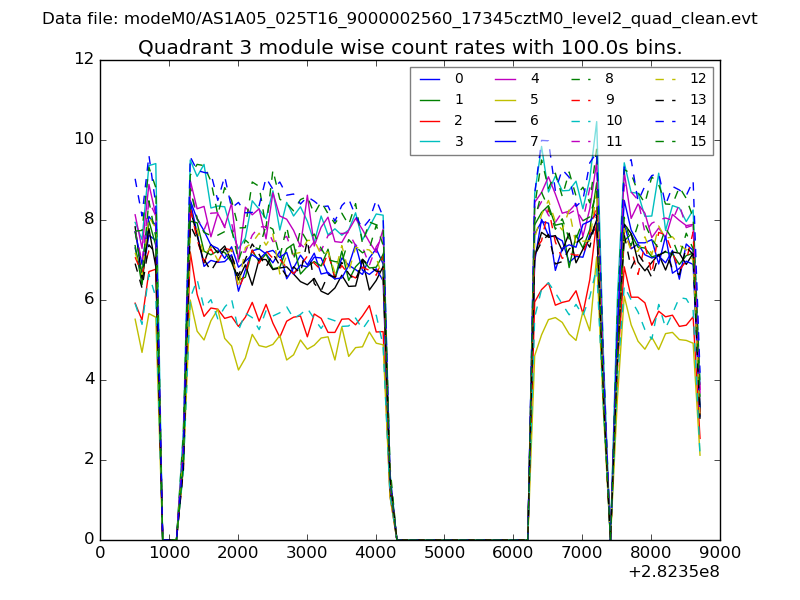 |
 |
| Parameter | Plot |
|---|---|
| CZT HV Monitor | 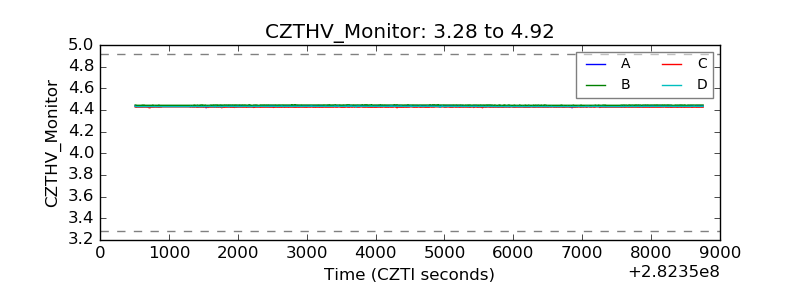 |
| D_VDD | 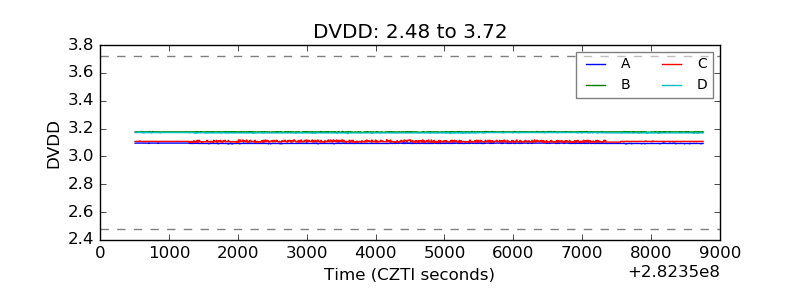 |
| Temperature 1 | 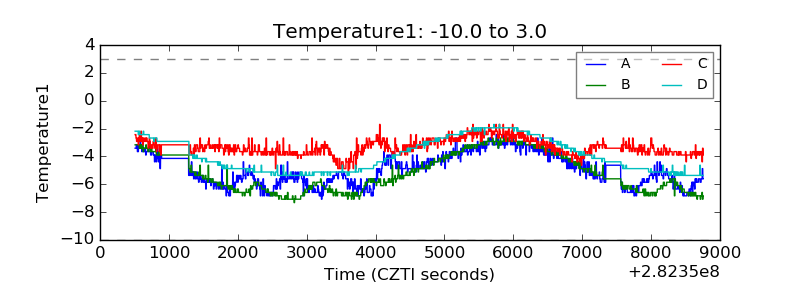 |
| Veto HV Monitor | 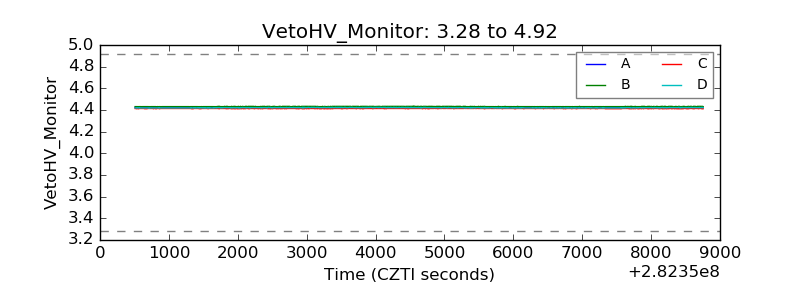 |
| Veto LLD | 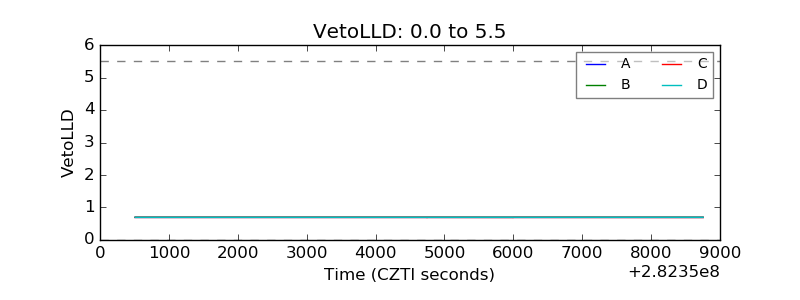 |
| Alpha Counter | 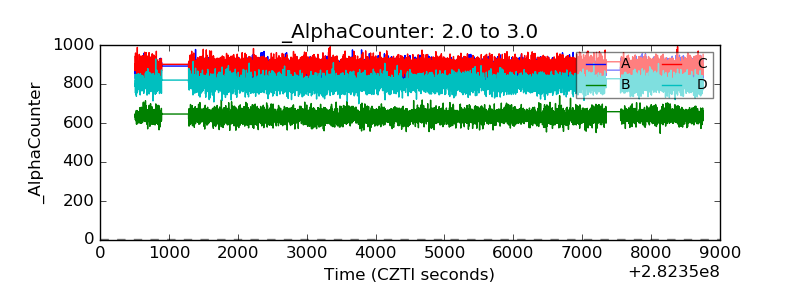 |
| _CPM_Rate | 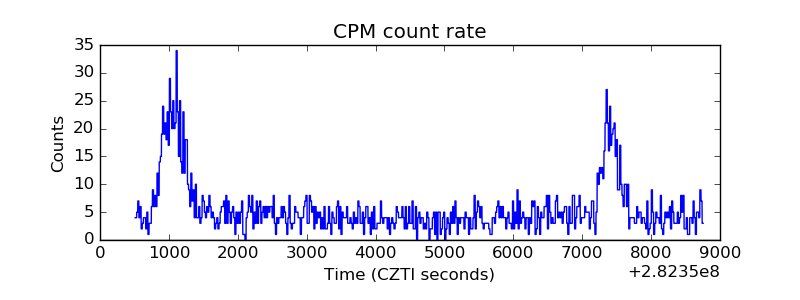 |
| CZT Counter |  |
| +2.5 Volts monitor |  |
| +5 Volts monitor |  |
| _ROLL_ROT | 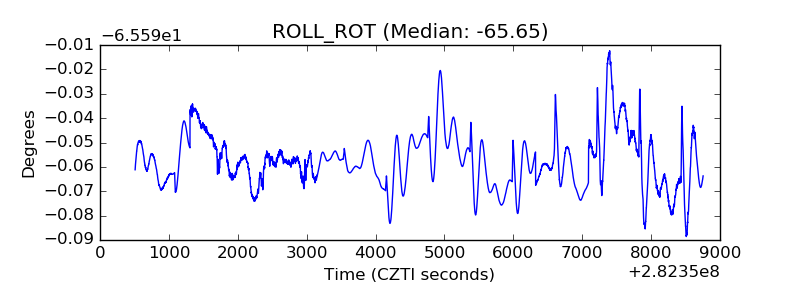 |
| _Roll_DEC | 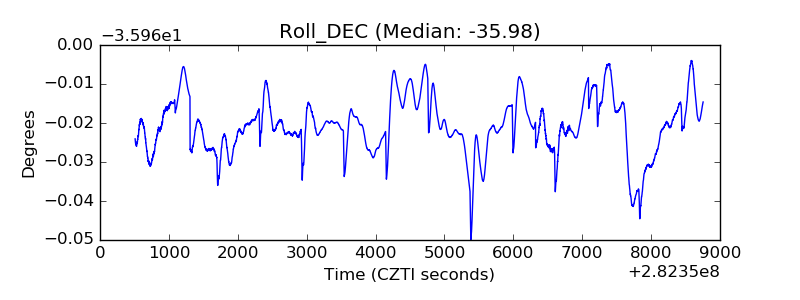 |
| _Roll_RA | 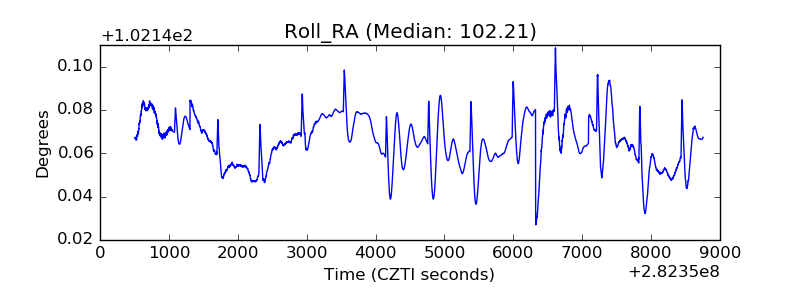 |
| Veto Counter | 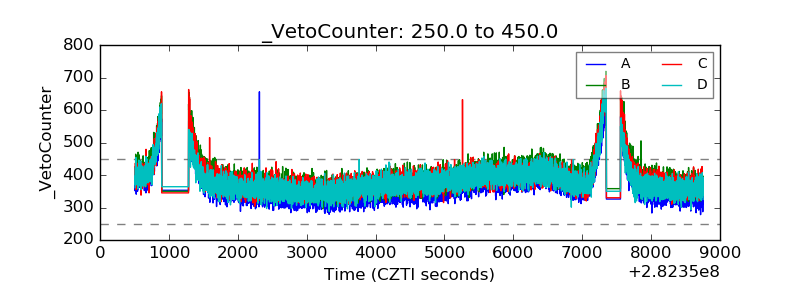 |