| Param | Original file | Final file |
|---|---|---|
| Filename | modeM0/AS1A05_025T16_9000002560_17346cztM0_level2.evt | modeM0/AS1A05_025T16_9000002560_17346cztM0_level2_quad_clean.evt |
| Size (bytes) | 69,802,560 | 21,121,920 |
| Size | 66.6 MB | 20.1 MB |
| Events in quadrant A | 500,625 | 141,445 |
| Events in quadrant B | 515,885 | 142,276 |
| Events in quadrant C | 507,881 | 134,620 |
| Events in quadrant D | 508,558 | 134,096 |
| Mode M0 | |||
|---|---|---|---|
| Quadrant | BADHDUFLAG | Total packets | Discarded packets |
| A | 0 | 2311 | 0 |
| B | 0 | 2322 | 0 |
| C | 0 | 2313 | 0 |
| D | 0 | 2365 | 0 |
| Mode SS | |||
|---|---|---|---|
| Quadrant | BADHDUFLAG | Total packets | Discarded packets |
| A | 0 | 22 | 0 |
| B | 0 | 22 | 0 |
| C | 0 | 22 | 0 |
| D | 0 | 22 | 0 |
| Quadrant | Total seconds | Saturated seconds | Saturation percentage |
|---|---|---|---|
| A | 1143 | 0 | 0.000000% |
| B | 1144 | 2 | 0.174825% |
| C | 1144 | 4 | 0.349650% |
| D | 1144 | 2 | 0.174825% |
Noise dominated data is calculated using 1-second bins in cleaned event files. If a bin has >2000 counts, and if more than 50% of those come from <1% of pixels, then it is considered to be noise-dominated and hence unusable.
| Quadrant | # 1 sec bins | Bins with >0 counts | Bins with >2000 counts | High rate bins dominated by noise | Noise dominated (total time) | Noise dominated (detector-on time) | Marked lightcurve |
|---|---|---|---|---|---|---|---|
| A | 1143 | 1143 | 0 | 0 | 0.00% | 0.00% | 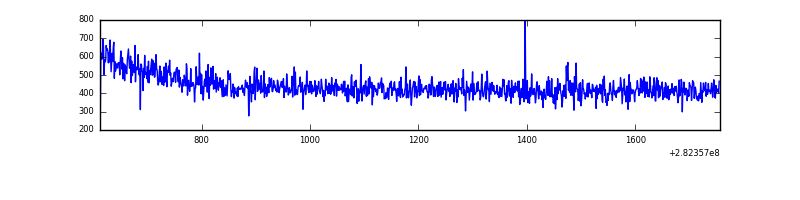 |
| B | 1144 | 1144 | 0 | 0 | 0.00% | 0.00% | 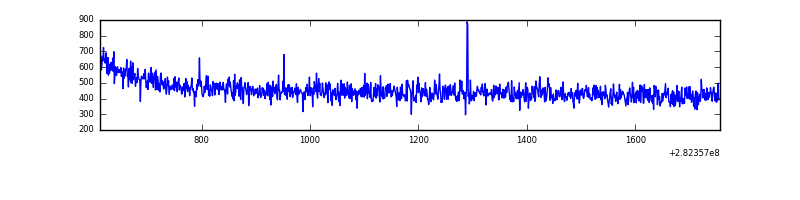 |
| C | 1144 | 1144 | 0 | 0 | 0.00% | 0.00% | 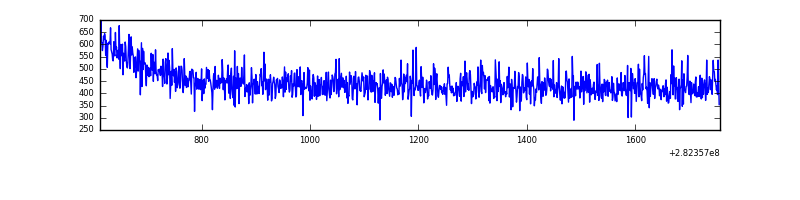 |
| D | 1144 | 1144 | 1 | 1 | 0.09% | 0.09% | 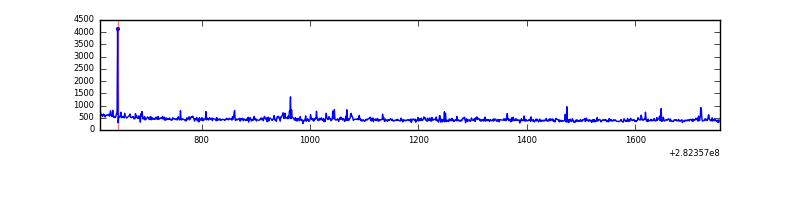 |
Top three noisy pixels from each quadrant. If the there are fewer than three noisy pixels in the level2.evt file, extra rows are filled as -1
| Pixel properties | Quadrant properties | ||||||
|---|---|---|---|---|---|---|---|
| Quadrant | DetID | PixID | Counts | Sigma | Mean | Median | Sigma |
| A | 0 | 226 | 1118 | 34.62 | 129 | 127 | 28.6 |
| A | 3 | 137 | 1058 | 32.52 | 129 | 127 | 28.6 |
| A | 15 | 174 | 930 | 28.05 | 129 | 127 | 28.6 |
| B | 12 | 111 | 3161 | 107.88 | 131 | 127 | 28.1 |
| B | 11 | 111 | 2757 | 93.52 | 131 | 127 | 28.1 |
| B | 14 | 111 | 2465 | 83.13 | 131 | 127 | 28.1 |
| C | 14 | 238 | 18855 | 598.76 | 124 | 124 | 31.3 |
| C | 3 | 233 | 3724 | 115.08 | 124 | 124 | 31.3 |
| C | 13 | 61 | 952 | 26.47 | 124 | 124 | 31.3 |
| D | 1 | 52 | 23676 | 740.31 | 123 | 119 | 31.8 |
| D | 13 | 189 | 5051 | 155.0 | 123 | 119 | 31.8 |
| D | 7 | 38 | 4759 | 145.82 | 123 | 119 | 31.8 |
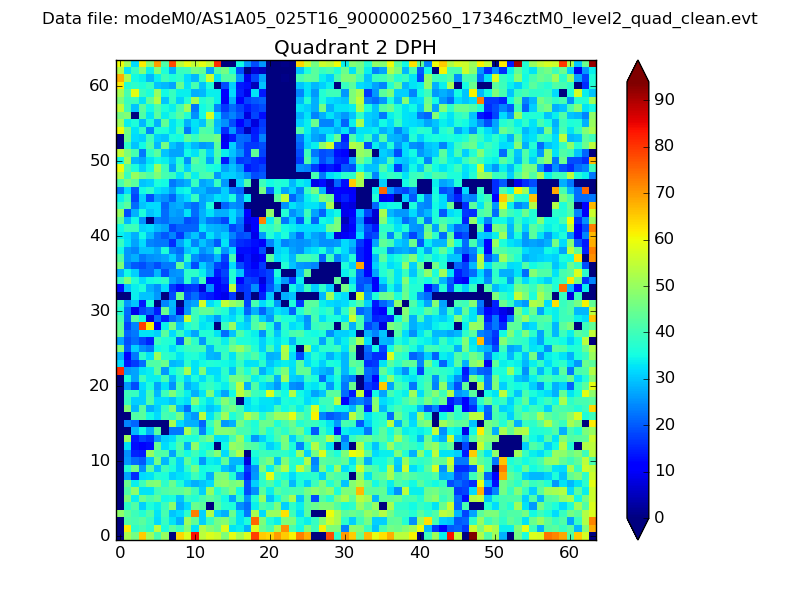
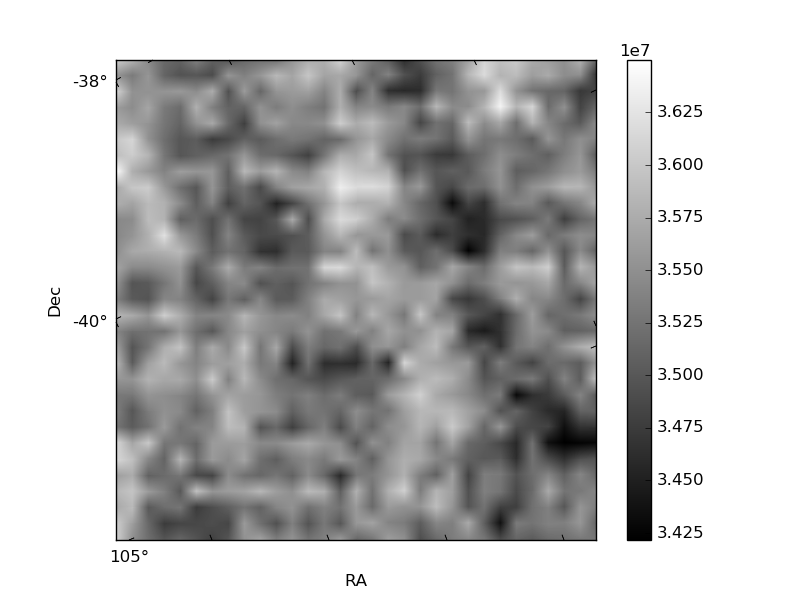
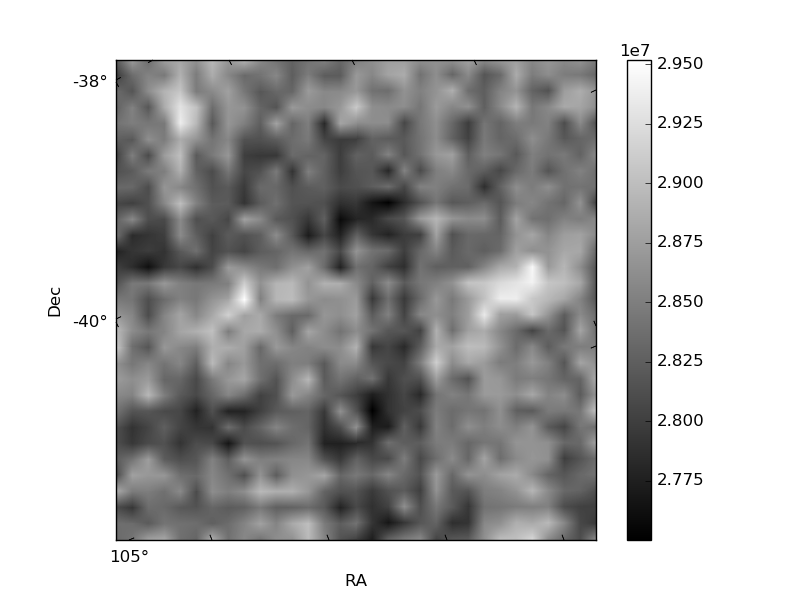
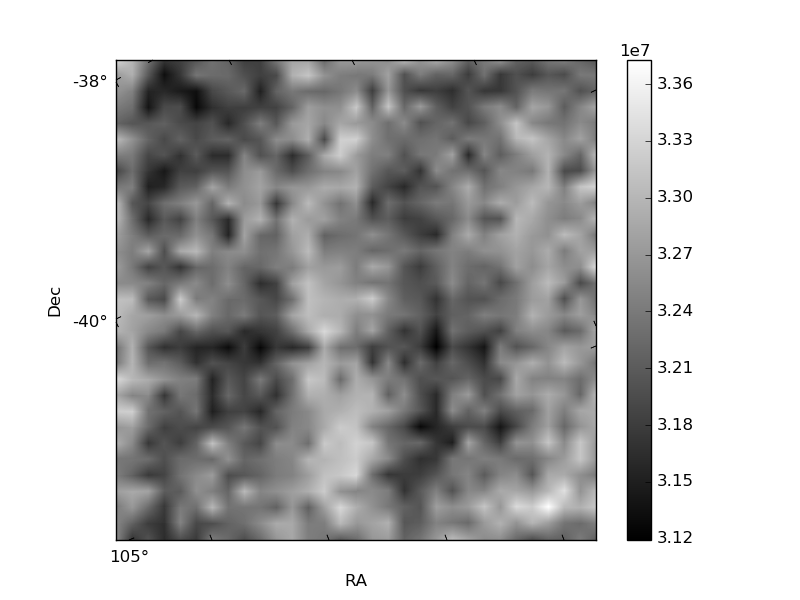
Histogram calculated using DETX and DETY for each event in the final _common_clean file
| Quadrant A | 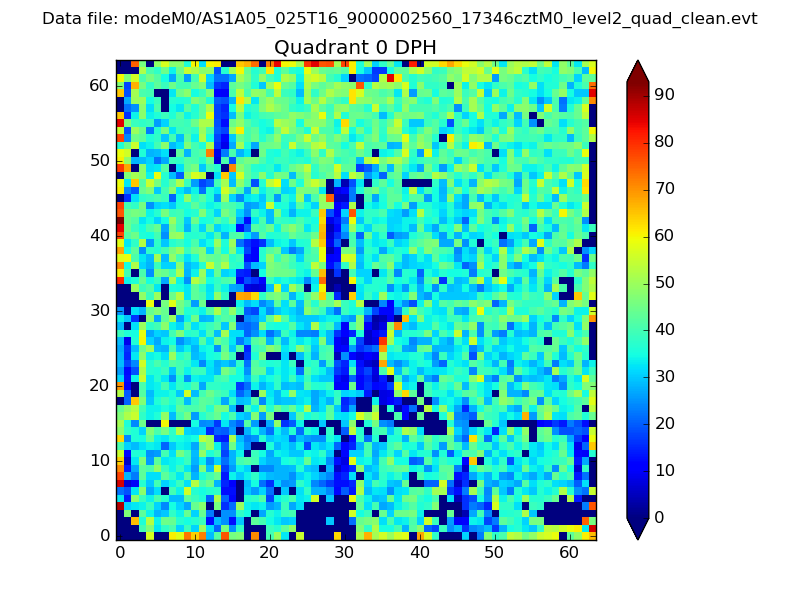 |
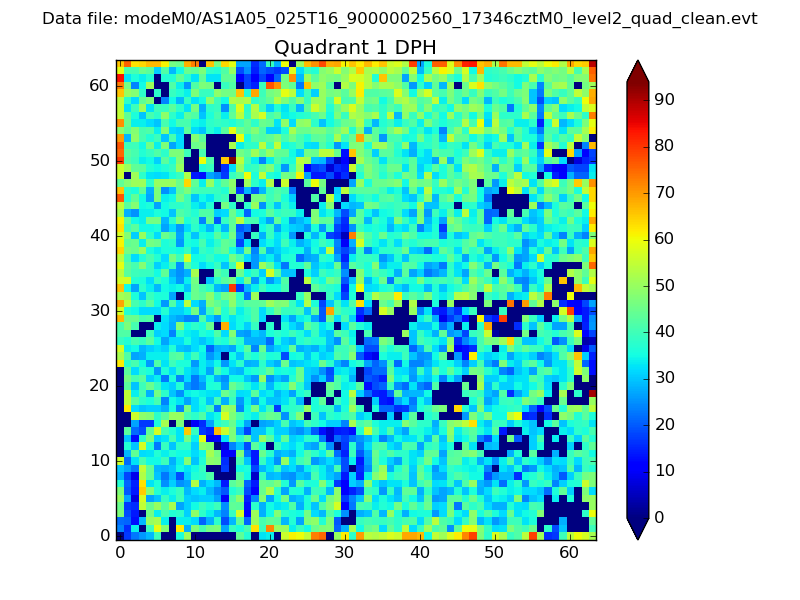 |
Quadrant B |
|---|---|---|---|
| Quadrant D | 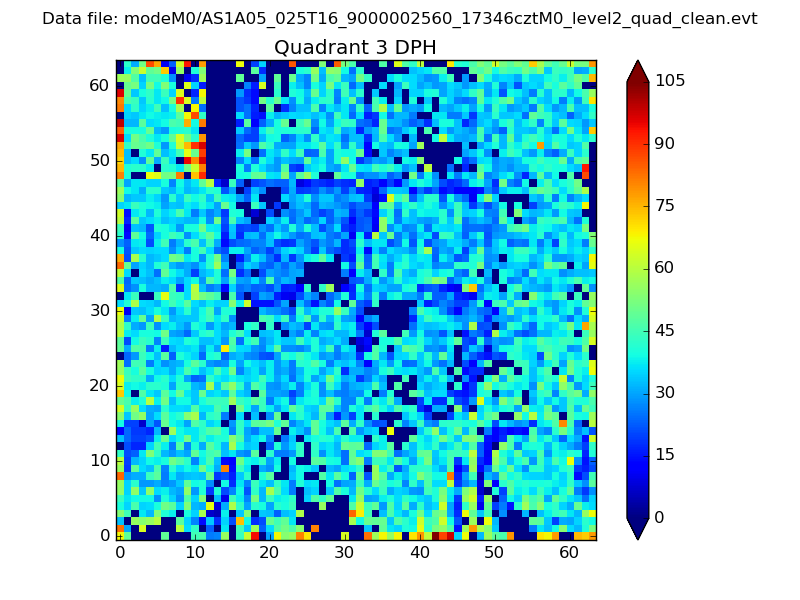 |
 |
Quadrant C |
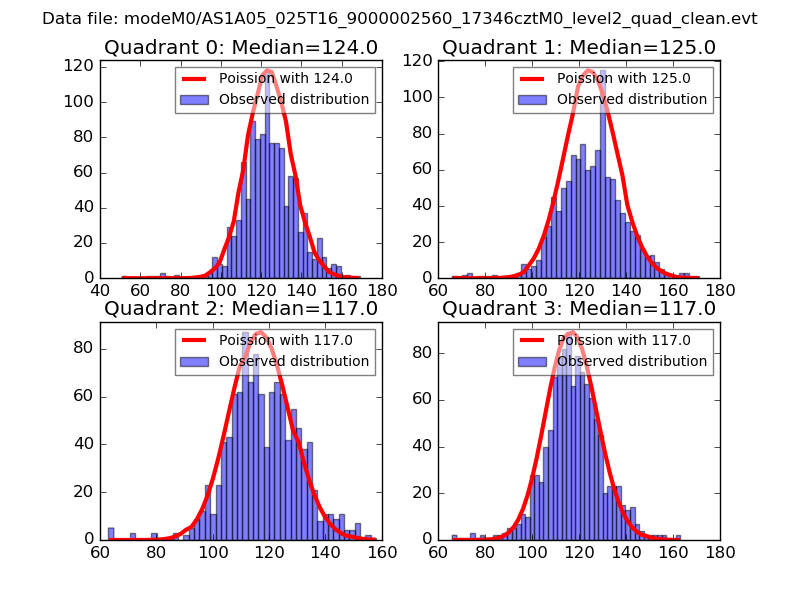
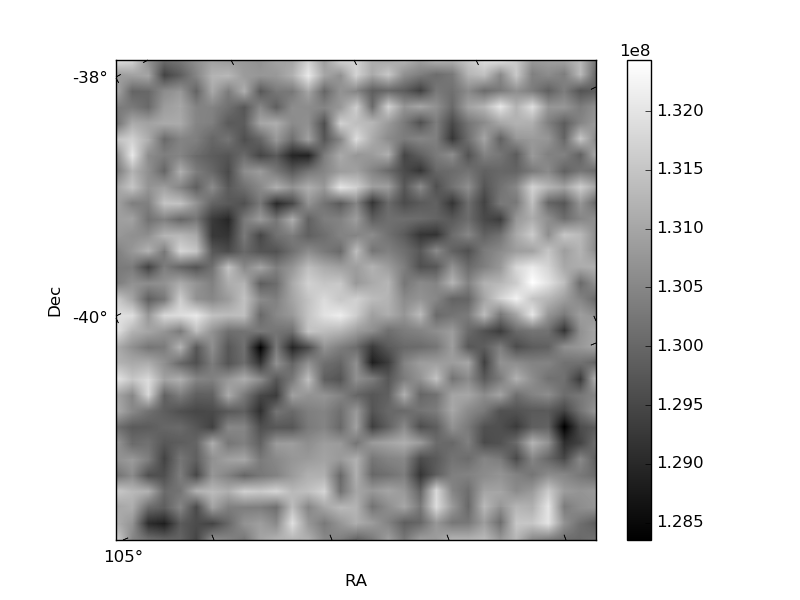
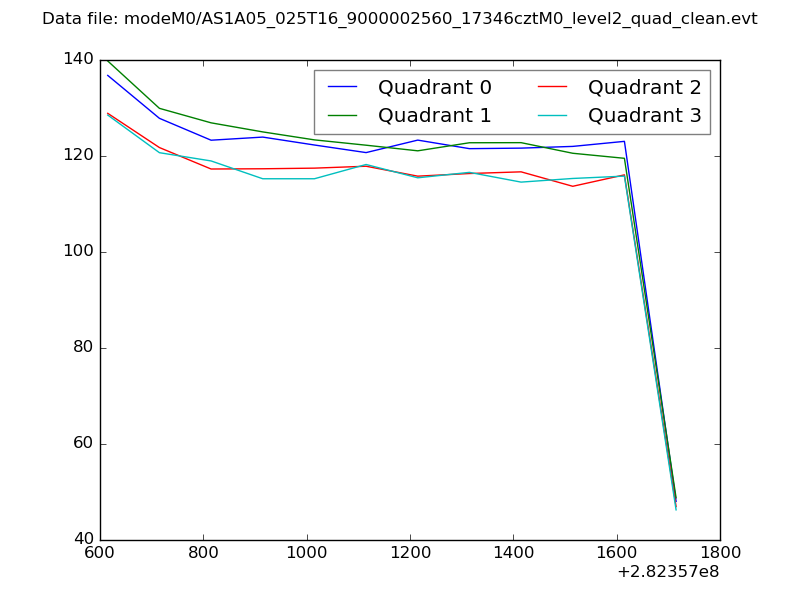
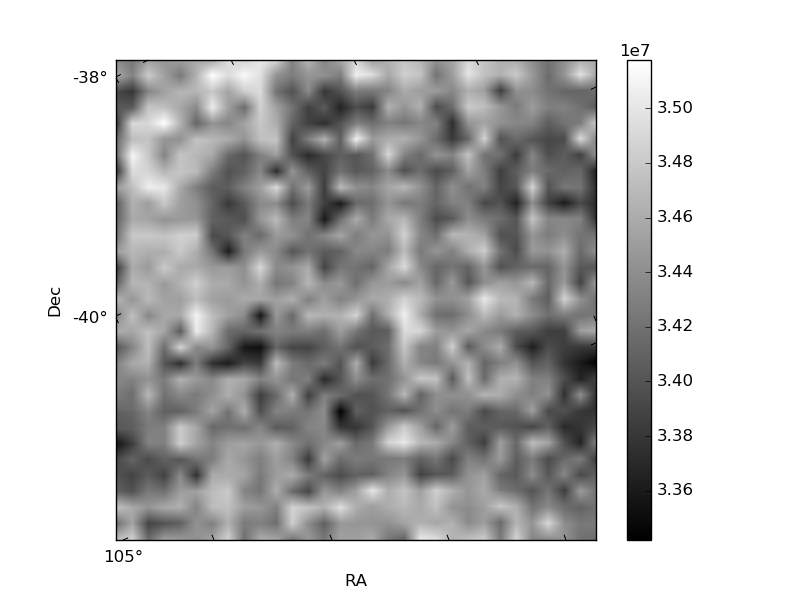
| Plot type | Count rate plots | Images |
|---|---|---|
| Comparison with Poisson distribution Blue bars denote a histogram of data divided into 1 sec bins. Red curve is a Poisson curve with rate = median count rate of data. |
 |
 |
| Quadrant-wise count rates Data is divided into 100 sec bins |
 |
|
| Module-wise count rates for Quadrant A Data is divided into 100 sec bins |
 |
 |
| Module-wise count rates for Quadrant B Data is divided into 100 sec bins |
 |
 |
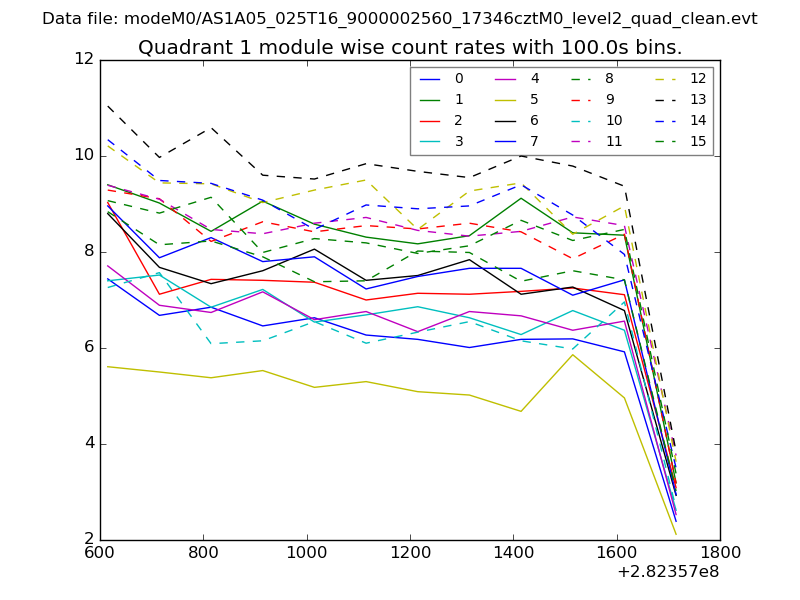
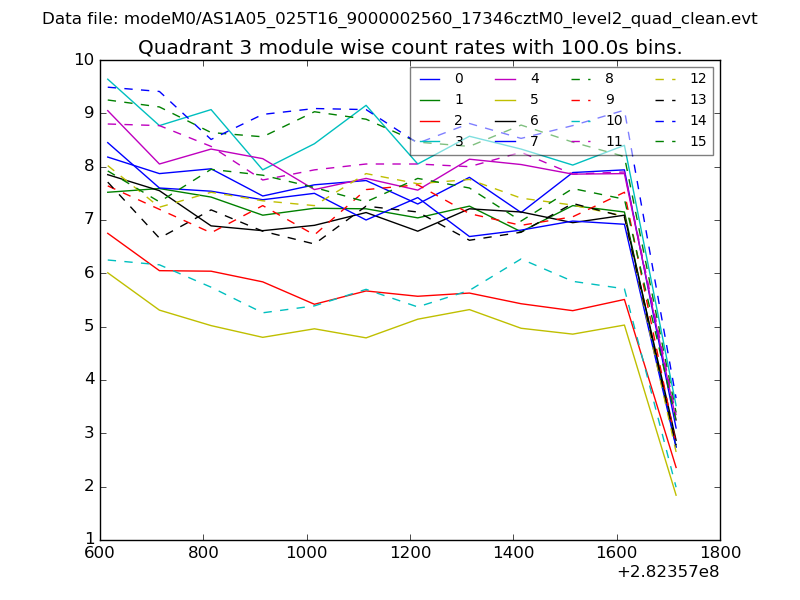
| Module-wise count rates for Quadrant C Data is divided into 100 sec bins |
 |
 |
| Module-wise count rates for Quadrant D Data is divided into 100 sec bins |
 |
 |
| Parameter | Plot |
|---|---|
| CZT HV Monitor | 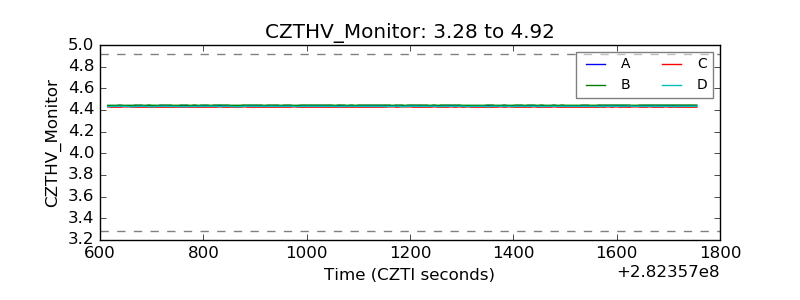 |
| D_VDD | 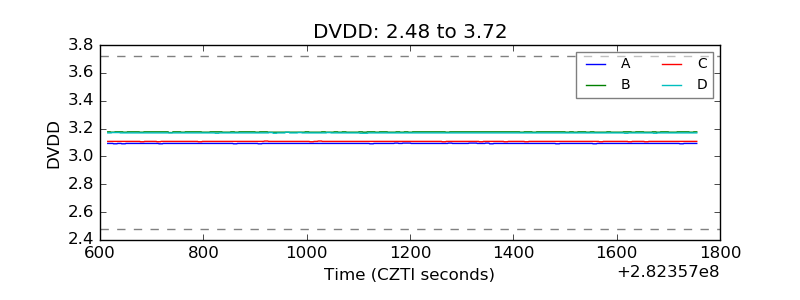 |
| Temperature 1 | 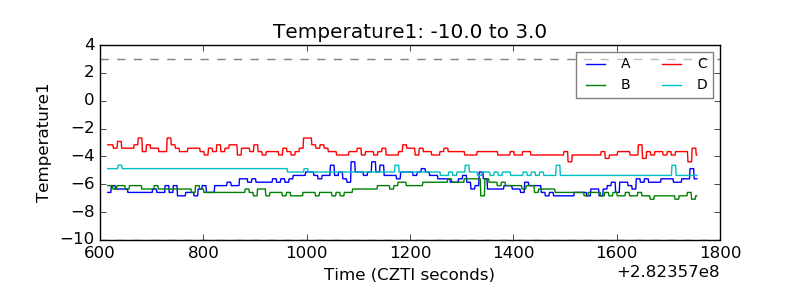 |
| Veto HV Monitor | 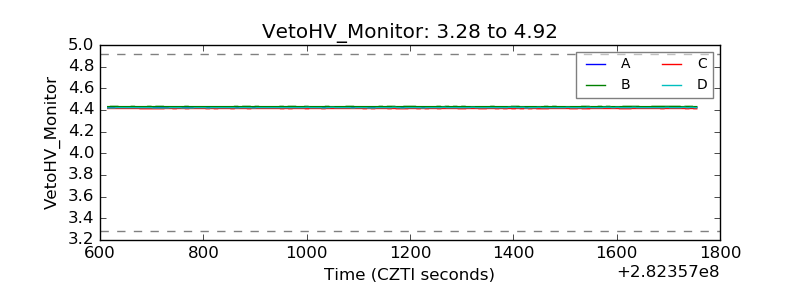 |
| Veto LLD | 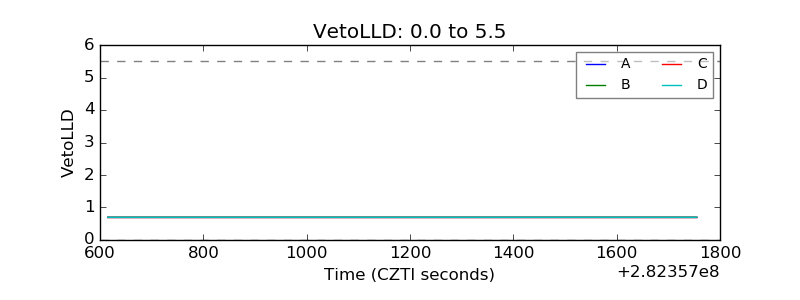 |
| Alpha Counter | 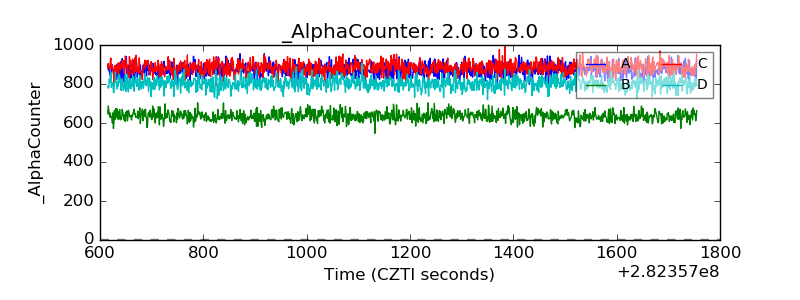 |
| _CPM_Rate | 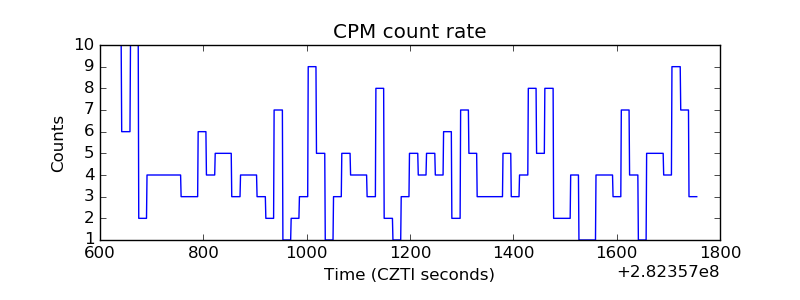 |
| CZT Counter | 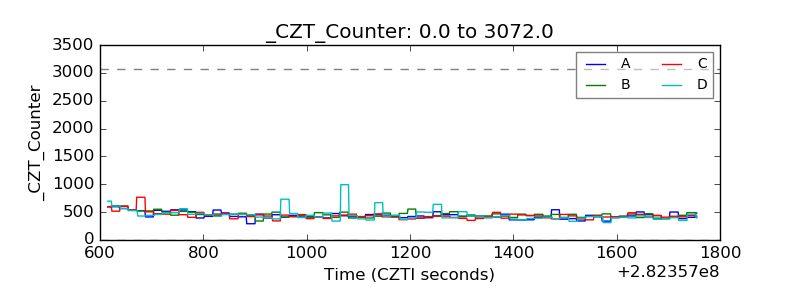 |
| +2.5 Volts monitor |  |
| +5 Volts monitor |  |
| _ROLL_ROT | 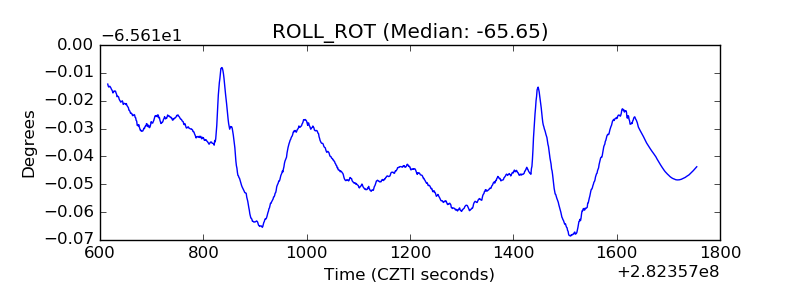 |
| _Roll_DEC | 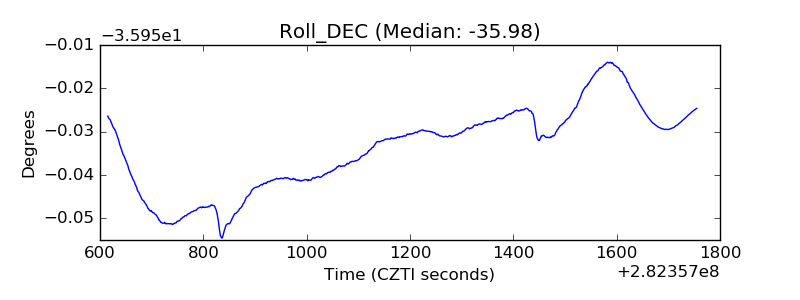 |
| _Roll_RA | 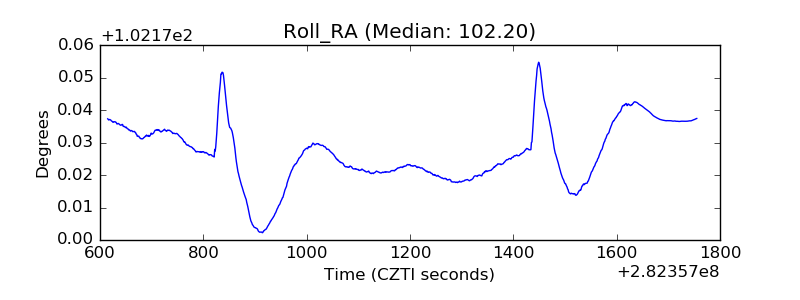 |
| Veto Counter | 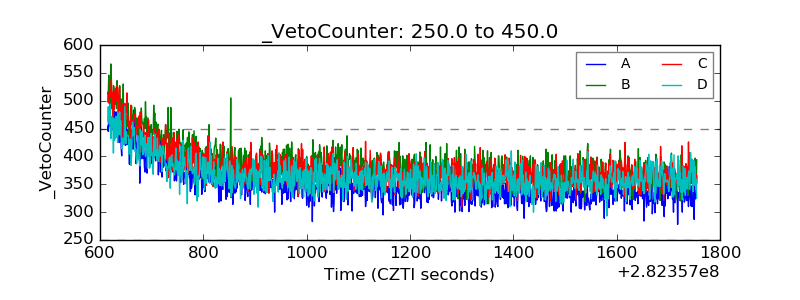 |