| Param | Original file | Final file |
|---|---|---|
| Filename | modeM0/AS1A05_165T12_9000002562cztM0_level2.fits | modeM0/AS1A05_165T12_9000002562cztM0_level2_quad_clean.evt |
| Size (bytes) | 694,137,600 | 684,432,000 |
| Size | 662.0 MB | 652.7 MB |
| Events in quadrant A | 4,292,484 | 4,181,831 |
| Events in quadrant B | 4,125,894 | 4,186,426 |
| Events in quadrant C | 4,121,828 | 3,895,869 |
| Events in quadrant D | 3,563,142 | 3,545,561 |
| Mode M9 | |||
|---|---|---|---|
| Quadrant | BADHDUFLAG | Total packets | Discarded packets |
| A | 0 | 149 | 0 |
| B | 0 | 149 | 0 |
| C | 0 | 149 | 0 |
| D | 0 | 149 | 0 |
| Mode M0 | |||
|---|---|---|---|
| Quadrant | BADHDUFLAG | Total packets | Discarded packets |
| A | 0 | 145646 | 0 |
| B | 0 | 147194 | 0 |
| C | 0 | 146000 | 0 |
| D | 0 | 177224 | 0 |
| Mode SS | |||
|---|---|---|---|
| Quadrant | BADHDUFLAG | Total packets | Discarded packets |
| A | 0 | 2064 | 0 |
| B | 0 | 2064 | 0 |
| C | 0 | 2064 | 0 |
| D | 0 | 1430 | 0 |
| Quadrant | Total seconds | Saturated seconds | Saturation percentage |
|---|---|---|---|
| A | 70206 | 667 | 0.950061% |
| B | 70205 | 800 | 1.139520% |
| C | 70206 | 985 | 1.403014% |
| D | 70206 | 2122 | 3.022534% |
Noise dominated data is calculated using 1-second bins in cleaned event files. If a bin has >2000 counts, and if more than 50% of those come from <1% of pixels, then it is considered to be noise-dominated and hence unusable.
| Quadrant | # 1 sec bins | Bins with >0 counts | Bins with >2000 counts | High rate bins dominated by noise | Noise dominated (total time) | Noise dominated (detector-on time) | Marked lightcurve |
|---|---|---|---|---|---|---|---|
| A | 81732 | 70180 | 0 | 0 | 0.00% | 0.00% |  |
| B | 81732 | 70174 | 0 | 0 | 0.00% | 0.00% |  |
| C | 81731 | 70179 | 0 | 0 | 0.00% | 0.00% |  |
| D | 81731 | 70156 | 0 | 0 | 0.00% | 0.00% | 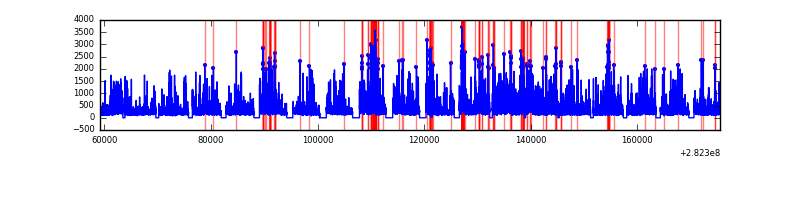 |
Top three noisy pixels from each quadrant. If the there are fewer than three noisy pixels in the level2.evt file, extra rows are filled as -1
| Pixel properties | Quadrant properties | ||||||
|---|---|---|---|---|---|---|---|
| Quadrant | DetID | PixID | Counts | Sigma | Mean | Median | Sigma |
| A | 0 | 29 | 4077 | 10.97 | 1117 | 1048 | 276.2 |
| A | 7 | 110 | 3457 | 8.72 | 1117 | 1048 | 276.2 |
| A | 0 | 30 | 3199 | 7.79 | 1117 | 1048 | 276.2 |
| B | 2 | 9 | 3236 | 10.51 | 1087 | 1043 | 208.8 |
| B | 3 | 17 | 2810 | 8.46 | 1087 | 1043 | 208.8 |
| B | 2 | 8 | 2802 | 8.43 | 1087 | 1043 | 208.8 |
| C | 12 | 241 | 2846 | 6.49 | 1090 | 1018 | 281.7 |
| C | 2 | 191 | 2782 | 6.26 | 1090 | 1018 | 281.7 |
| C | 7 | 111 | 2777 | 6.25 | 1090 | 1018 | 281.7 |
| D | 6 | 231 | 2600 | 6.19 | 1017 | 924 | 271.0 |
| D | 3 | 14 | 2574 | 6.09 | 1017 | 924 | 271.0 |
| D | 15 | 46 | 2470 | 5.71 | 1017 | 924 | 271.0 |
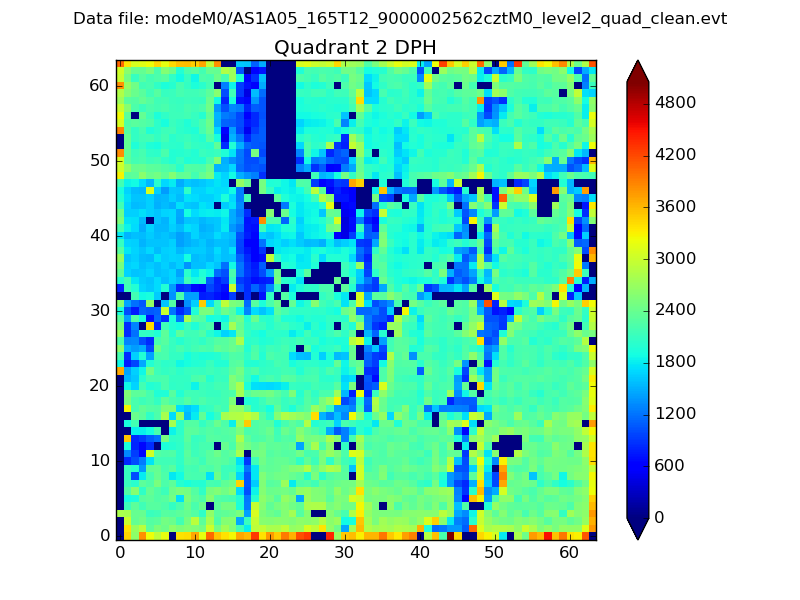
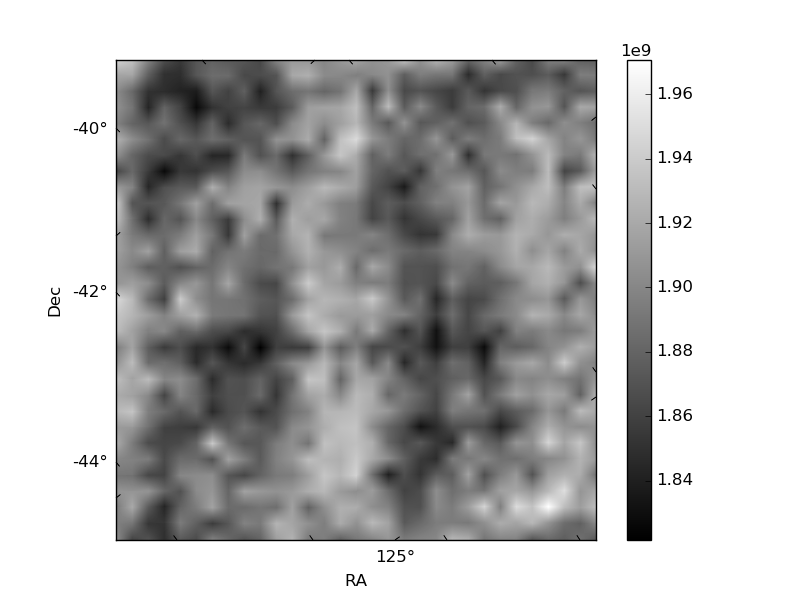
Histogram calculated using DETX and DETY for each event in the final _common_clean file
| Quadrant A | 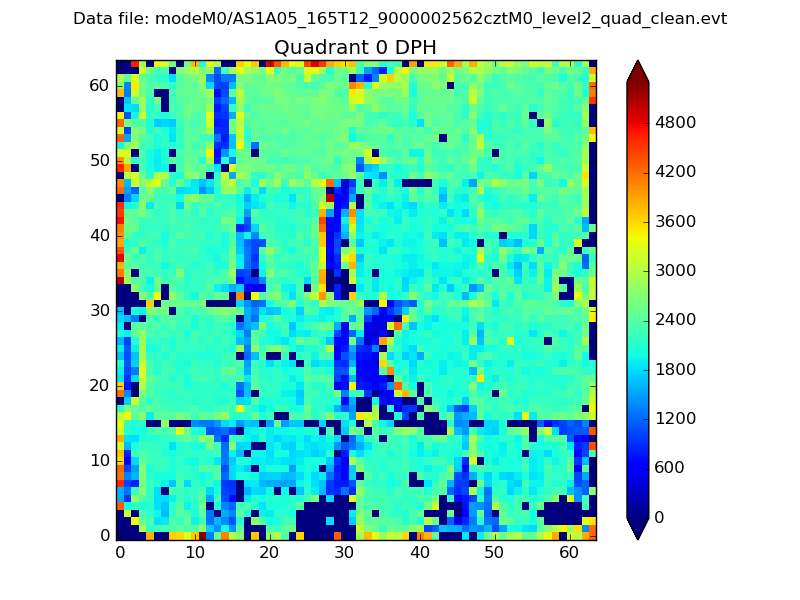 |
 |
Quadrant B |
|---|---|---|---|
| Quadrant D |  |
 |
Quadrant C |
| Plot type | Count rate plots | Images |
|---|---|---|
| Comparison with Poisson distribution Blue bars denote a histogram of data divided into 1 sec bins. Red curve is a Poisson curve with rate = median count rate of data. |
 |
 |
| Quadrant-wise count rates Data is divided into 100 sec bins |
 |
|
| Module-wise count rates for Quadrant A Data is divided into 100 sec bins |
 |
 |
| Module-wise count rates for Quadrant B Data is divided into 100 sec bins |
 |
 |
| Module-wise count rates for Quadrant C Data is divided into 100 sec bins |
 |
 |
| Module-wise count rates for Quadrant D Data is divided into 100 sec bins |
 |
 |
| Parameter | Plot |
|---|---|
| CZT HV Monitor |  |
| D_VDD |  |
| Temperature 1 |  |
| Veto HV Monitor |  |
| Veto LLD |  |
| Alpha Counter | 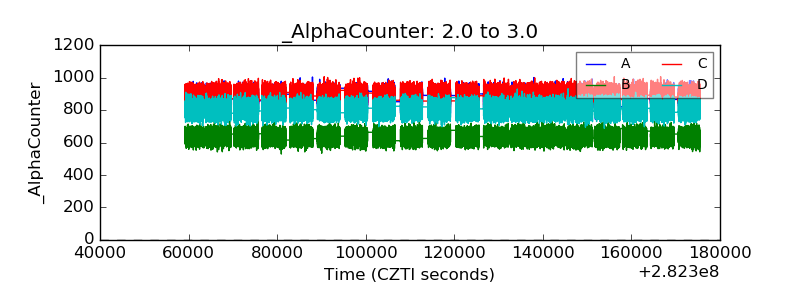 |
| _CPM_Rate |  |
| CZT Counter |  |
| +2.5 Volts monitor |  |
| +5 Volts monitor |  |
| _ROLL_ROT | 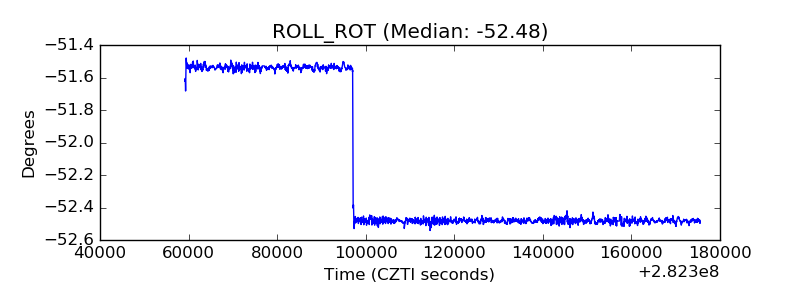 |
| _Roll_DEC | 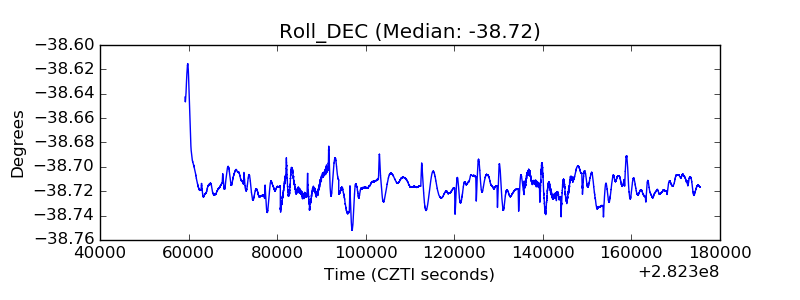 |
| _Roll_RA |  |
| Veto Counter |  |