| Param | Original file | Final file |
|---|---|---|
| Filename | modeM0/AS1A05_165T12_9000002562_17345cztM0_level2.evt | modeM0/AS1A05_165T12_9000002562_17345cztM0_level2_quad_clean.evt |
| Size (bytes) | 6,750,720 | 2,329,920 |
| Size | 6.4 MB | 2.2 MB |
| Events in quadrant A | 47,249 | 13,637 |
| Events in quadrant B | 47,925 | 13,656 |
| Events in quadrant C | 49,501 | 13,134 |
| Events in quadrant D | 47,892 | 12,797 |
| Mode M0 | |||
|---|---|---|---|
| Quadrant | BADHDUFLAG | Total packets | Discarded packets |
| A | 0 | 236 | 0 |
| B | 0 | 235 | 0 |
| C | 0 | 236 | 0 |
| D | 0 | 239 | 0 |
| Mode SS | |||
|---|---|---|---|
| Quadrant | BADHDUFLAG | Total packets | Discarded packets |
| A | 0 | 2 | 0 |
| B | 0 | 2 | 0 |
| C | 0 | 2 | 0 |
| D | 0 | 2 | 0 |
| Quadrant | Total seconds | Saturated seconds | Saturation percentage |
|---|---|---|---|
| A | 118 | 0 | 0.000000% |
| B | 118 | 0 | 0.000000% |
| C | 118 | 0 | 0.000000% |
| D | 118 | 0 | 0.000000% |
Noise dominated data is calculated using 1-second bins in cleaned event files. If a bin has >2000 counts, and if more than 50% of those come from <1% of pixels, then it is considered to be noise-dominated and hence unusable.
| Quadrant | # 1 sec bins | Bins with >0 counts | Bins with >2000 counts | High rate bins dominated by noise | Noise dominated (total time) | Noise dominated (detector-on time) | Marked lightcurve |
|---|---|---|---|---|---|---|---|
| A | 118 | 118 | 0 | 0 | 0.00% | 0.00% | 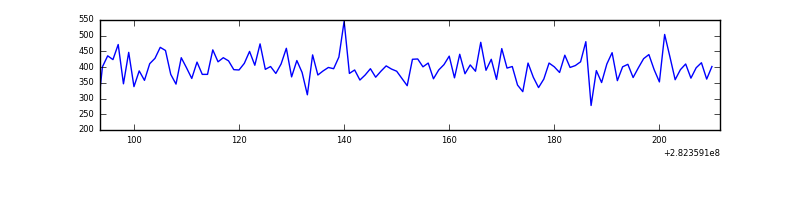 |
| B | 118 | 118 | 0 | 0 | 0.00% | 0.00% | 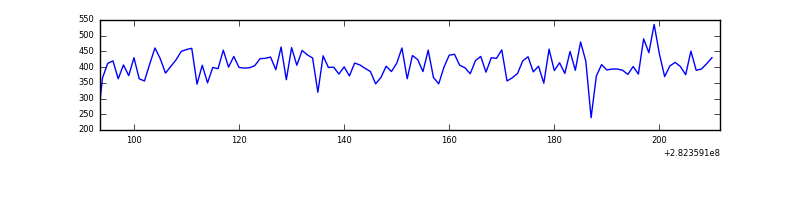 |
| C | 118 | 118 | 0 | 0 | 0.00% | 0.00% | 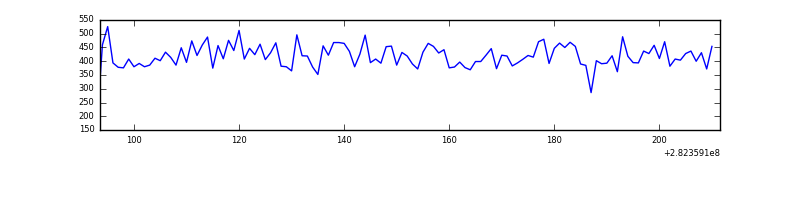 |
| D | 118 | 118 | 0 | 0 | 0.00% | 0.00% |  |
Top three noisy pixels from each quadrant. If the there are fewer than three noisy pixels in the level2.evt file, extra rows are filled as -1
| Pixel properties | Quadrant properties | ||||||
|---|---|---|---|---|---|---|---|
| Quadrant | DetID | PixID | Counts | Sigma | Mean | Median | Sigma |
| A | 0 | 226 | 108 | 22.05 | 12 | 12 | 4.4 |
| A | 3 | 137 | 99 | 19.99 | 12 | 12 | 4.4 |
| A | 12 | 194 | 84 | 16.54 | 12 | 12 | 4.4 |
| B | 12 | 111 | 309 | 71.24 | 12 | 11 | 4.2 |
| B | 14 | 111 | 243 | 55.46 | 12 | 11 | 4.2 |
| B | 11 | 111 | 213 | 48.29 | 12 | 11 | 4.2 |
| C | 14 | 238 | 1742 | 385.13 | 12 | 12 | 4.5 |
| C | 3 | 233 | 356 | 76.58 | 12 | 12 | 4.5 |
| C | 13 | 61 | 78 | 14.69 | 12 | 12 | 4.5 |
| D | 13 | 168 | 1217 | 265.61 | 11 | 11 | 4.5 |
| D | 1 | 52 | 1068 | 232.8 | 11 | 11 | 4.5 |
| D | 2 | 152 | 481 | 103.51 | 11 | 11 | 4.5 |
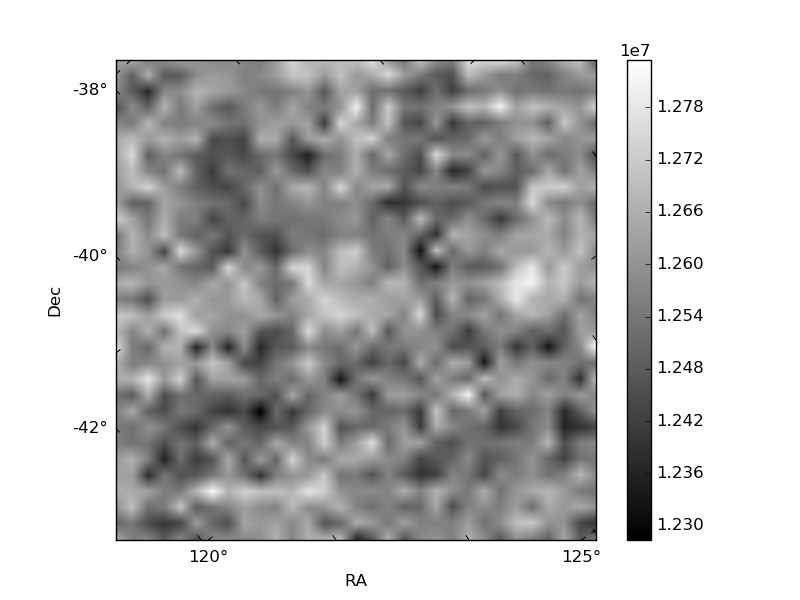
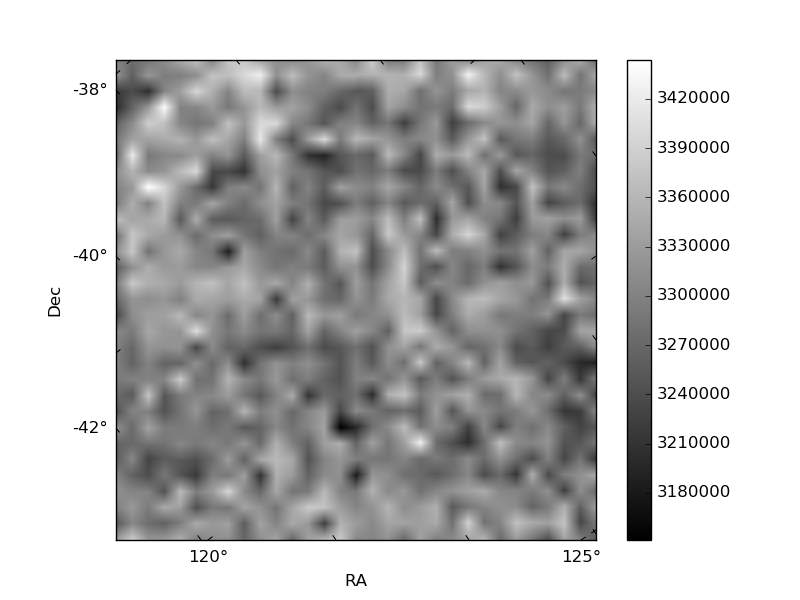
Histogram calculated using DETX and DETY for each event in the final _common_clean file
| Quadrant A |  |
 |
Quadrant B |
|---|---|---|---|
| Quadrant D |  |
 |
Quadrant C |
| Plot type | Count rate plots | Images |
|---|---|---|
| Comparison with Poisson distribution Blue bars denote a histogram of data divided into 1 sec bins. Red curve is a Poisson curve with rate = median count rate of data. |
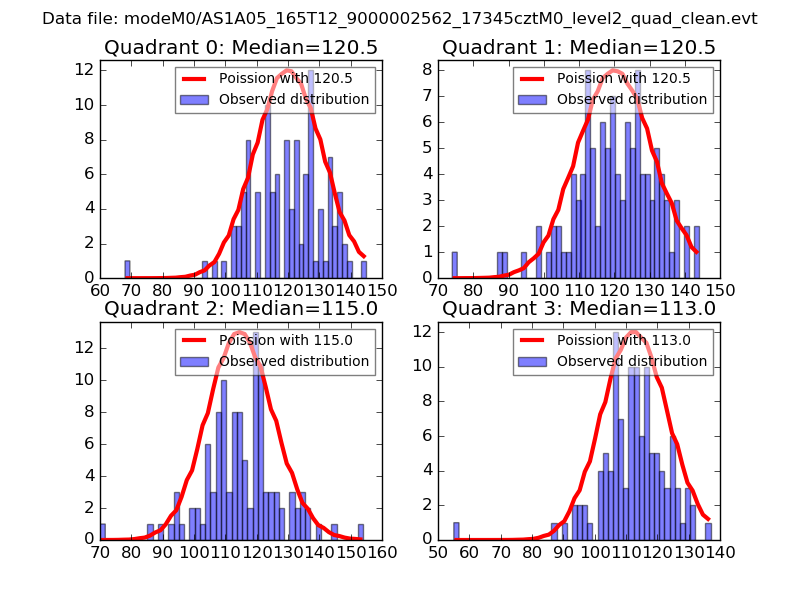 |
 |
| Quadrant-wise count rates Data is divided into 100 sec bins |
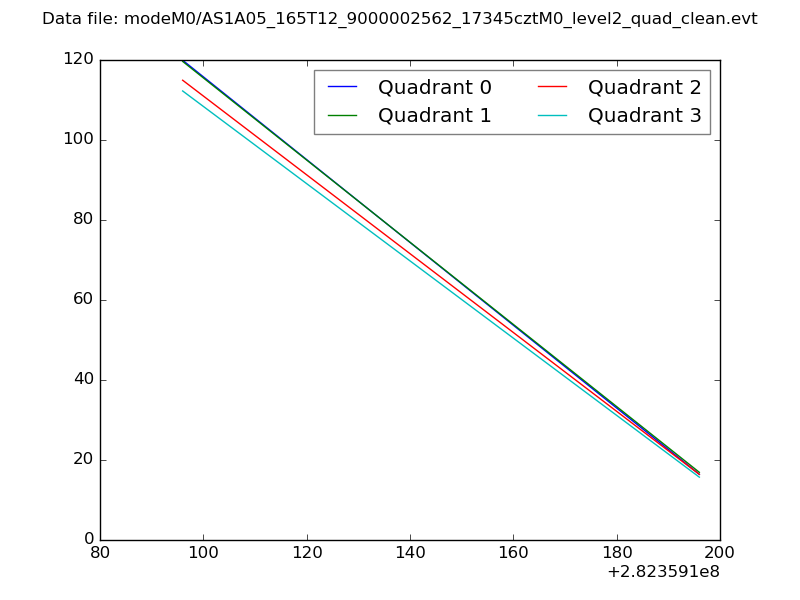 |
|
| Module-wise count rates for Quadrant A Data is divided into 100 sec bins |
 |
 |
| Module-wise count rates for Quadrant B Data is divided into 100 sec bins |
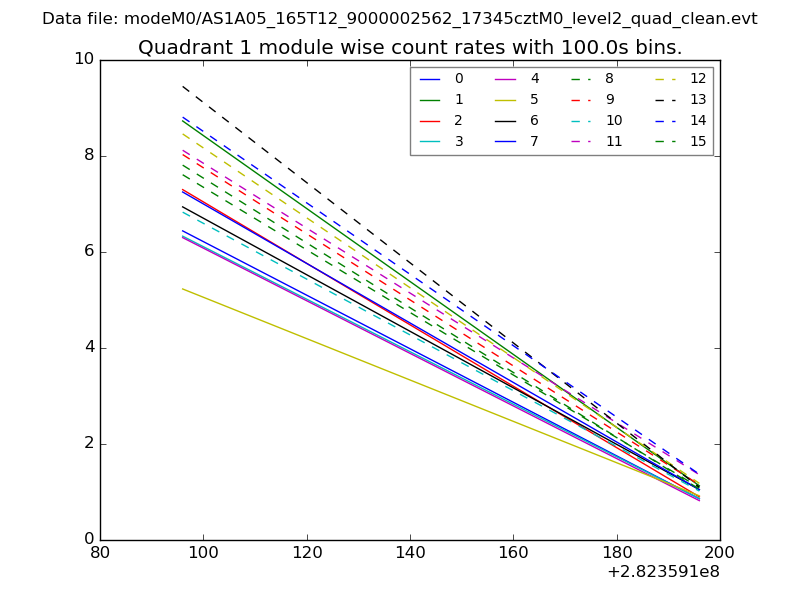 |
 |
| Module-wise count rates for Quadrant C Data is divided into 100 sec bins |
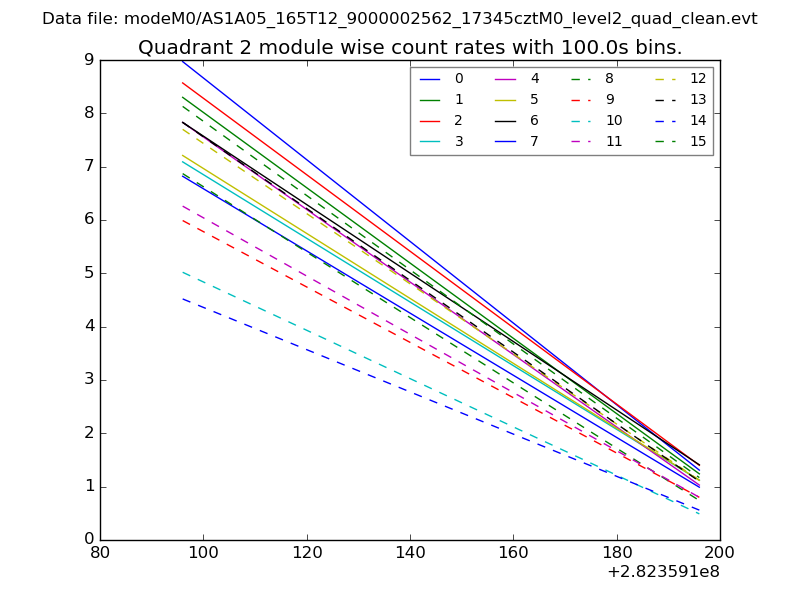 |
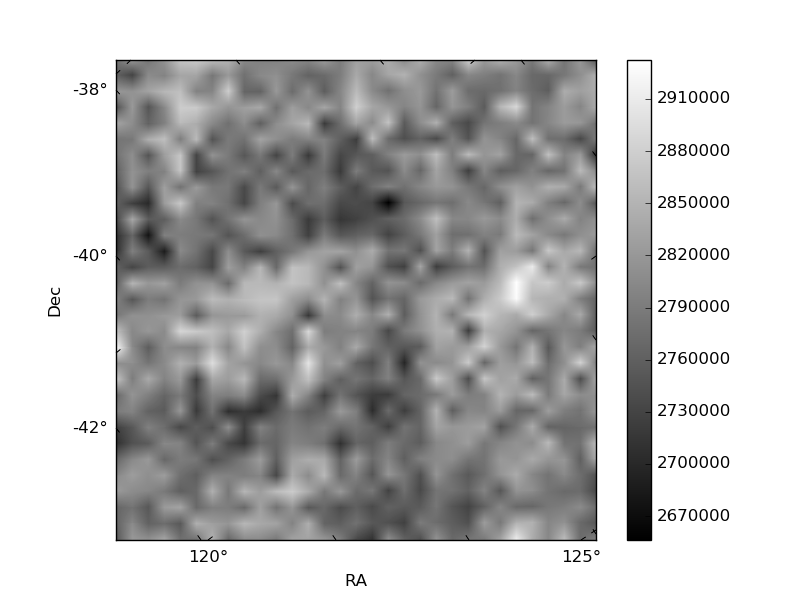 |
| Module-wise count rates for Quadrant D Data is divided into 100 sec bins |
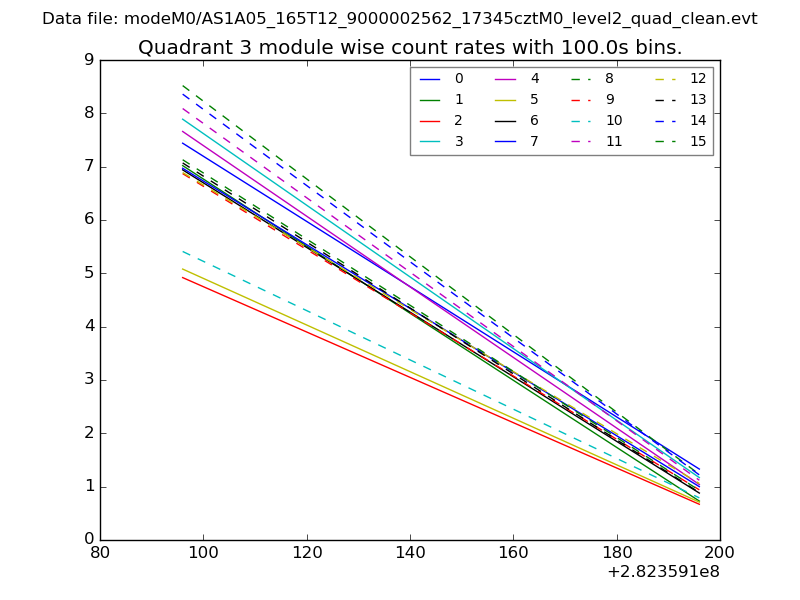 |
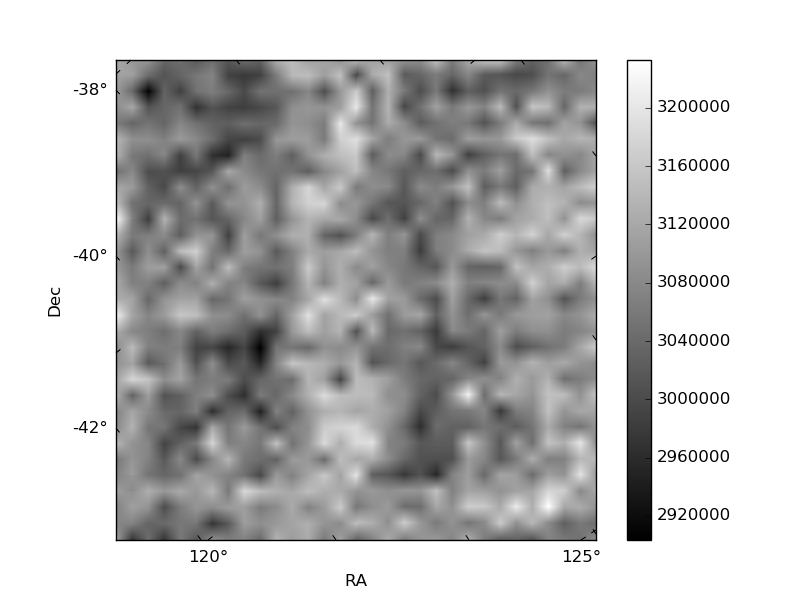 |
| Parameter | Plot |
|---|---|
| CZT HV Monitor | 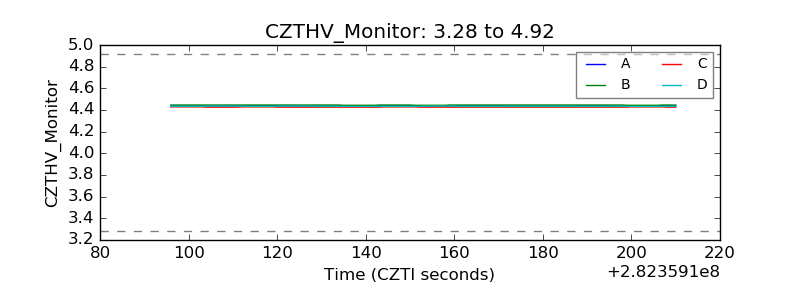 |
| D_VDD | 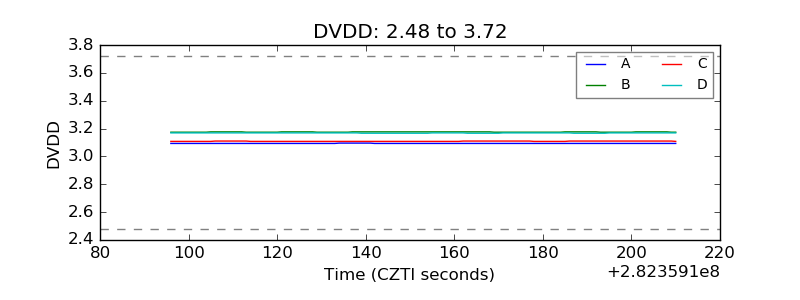 |
| Temperature 1 | 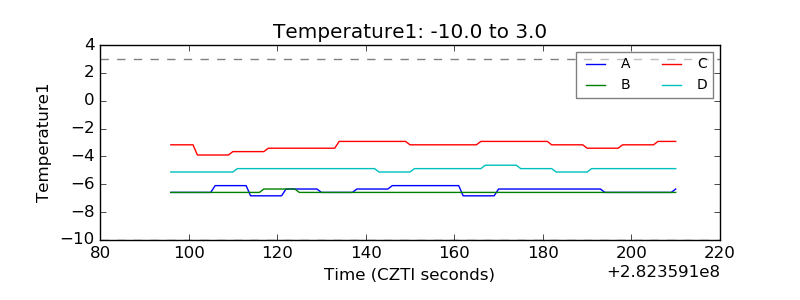 |
| Veto HV Monitor | 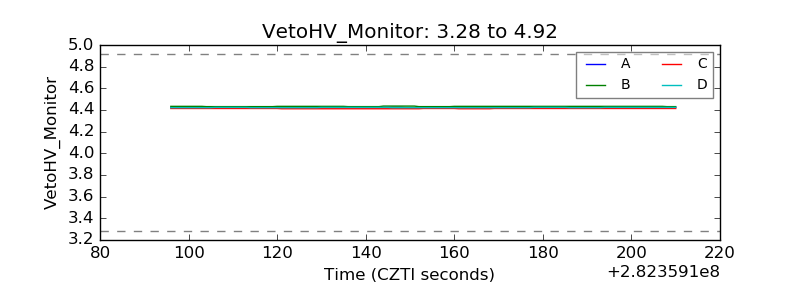 |
| Veto LLD | 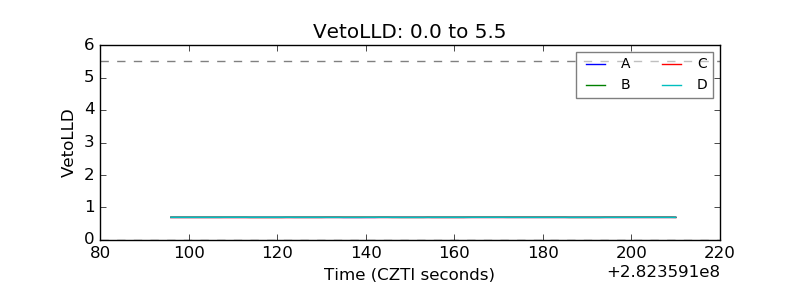 |
| Alpha Counter | 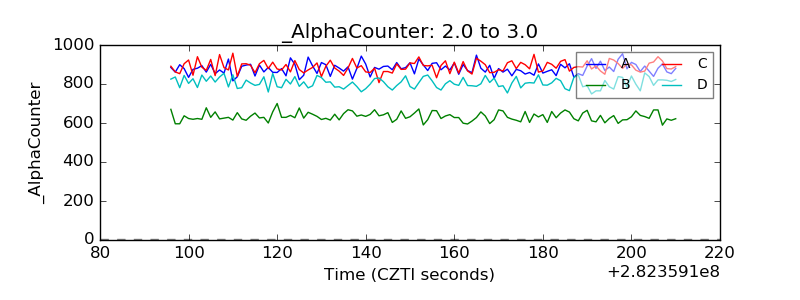 |
| _CPM_Rate | 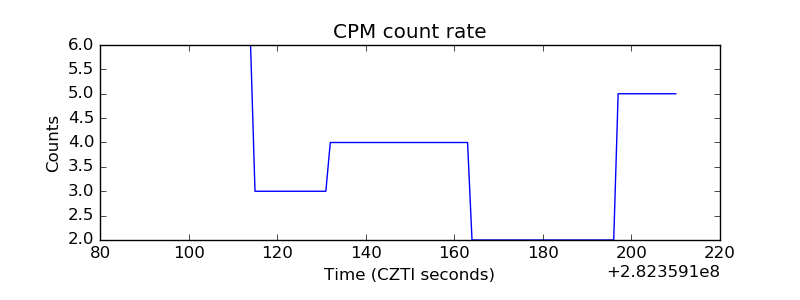 |
| CZT Counter |  |
| +2.5 Volts monitor |  |
| +5 Volts monitor |  |
| _ROLL_ROT | 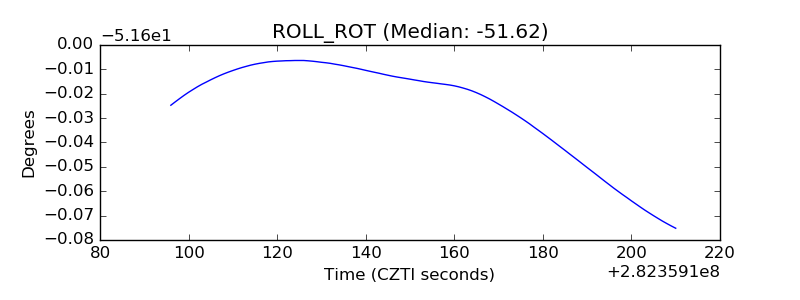 |
| _Roll_DEC | 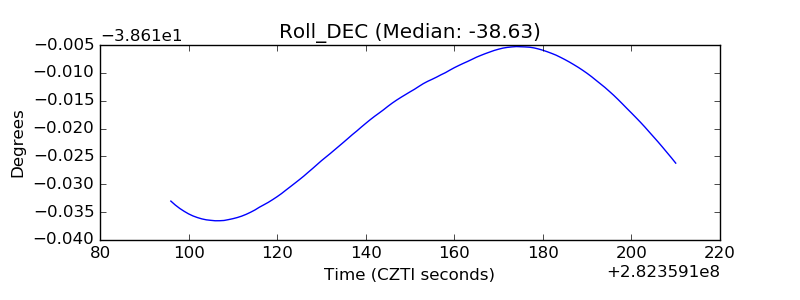 |
| _Roll_RA | 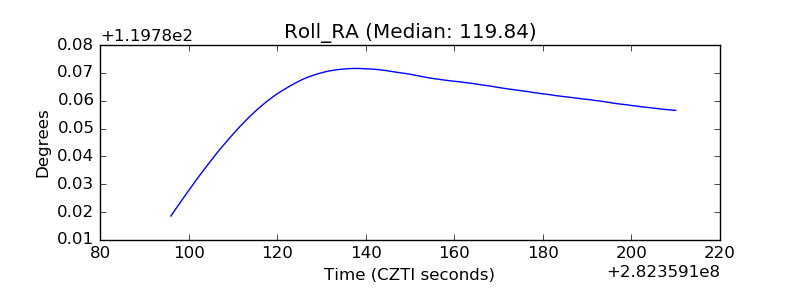 |
| Veto Counter | 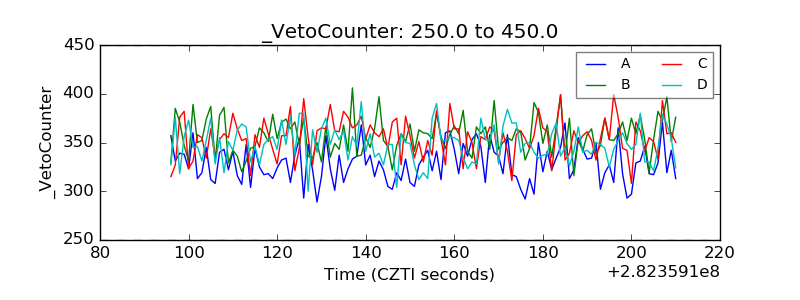 |