| Param | Original file | Final file |
|---|---|---|
| Filename | modeM0/AS1A05_165T12_9000002562_17346cztM0_level2.evt | modeM0/AS1A05_165T12_9000002562_17346cztM0_level2_quad_clean.evt |
| Size (bytes) | 390,646,080 | 74,903,040 |
| Size | 372.5 MB | 71.4 MB |
| Events in quadrant A | 2,675,875 | 473,427 |
| Events in quadrant B | 2,760,706 | 479,697 |
| Events in quadrant C | 2,732,695 | 454,777 |
| Events in quadrant D | 3,256,985 | 445,155 |
| Mode M9 | |||
|---|---|---|---|
| Quadrant | BADHDUFLAG | Total packets | Discarded packets |
| A | 0 | 4 | 0 |
| B | 0 | 4 | 0 |
| C | 0 | 4 | 0 |
| D | 0 | 4 | 0 |
| Mode M0 | |||
|---|---|---|---|
| Quadrant | BADHDUFLAG | Total packets | Discarded packets |
| A | 0 | 12045 | 1 |
| B | 0 | 12198 | 1 |
| C | 0 | 12059 | 1 |
| D | 0 | 13953 | 1 |
| Mode SS | |||
|---|---|---|---|
| Quadrant | BADHDUFLAG | Total packets | Discarded packets |
| A | 0 | 120 | 0 |
| B | 0 | 120 | 0 |
| C | 0 | 120 | 0 |
| D | 0 | 120 | 0 |
| Quadrant | Total seconds | Saturated seconds | Saturation percentage |
|---|---|---|---|
| A | 5944 | 16 | 0.269179% |
| B | 5944 | 35 | 0.588829% |
| C | 5944 | 47 | 0.790713% |
| D | 5944 | 44 | 0.740242% |
Noise dominated data is calculated using 1-second bins in cleaned event files. If a bin has >2000 counts, and if more than 50% of those come from <1% of pixels, then it is considered to be noise-dominated and hence unusable.
| Quadrant | # 1 sec bins | Bins with >0 counts | Bins with >2000 counts | High rate bins dominated by noise | Noise dominated (total time) | Noise dominated (detector-on time) | Marked lightcurve |
|---|---|---|---|---|---|---|---|
| A | 6344 | 5945 | 1 | 1 | 0.02% | 0.02% |  |
| B | 6344 | 5945 | 1 | 1 | 0.02% | 0.02% | 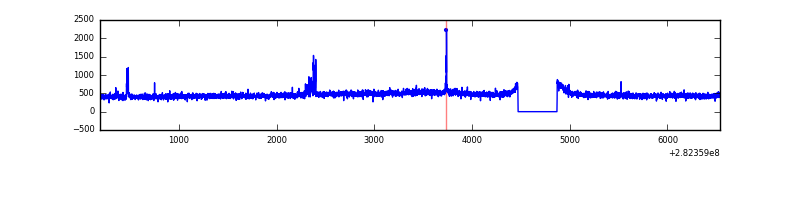 |
| C | 6344 | 5945 | 0 | 0 | 0.00% | 0.00% | 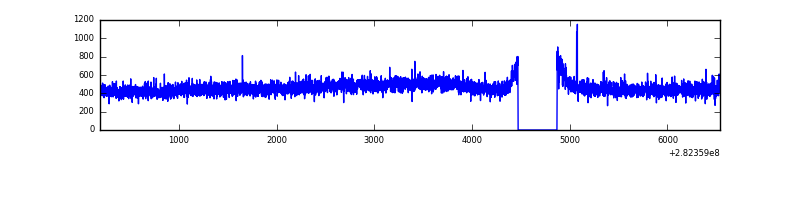 |
| D | 6344 | 5945 | 28 | 28 | 0.44% | 0.47% |  |
Top three noisy pixels from each quadrant. If the there are fewer than three noisy pixels in the level2.evt file, extra rows are filled as -1
| Pixel properties | Quadrant properties | ||||||
|---|---|---|---|---|---|---|---|
| Quadrant | DetID | PixID | Counts | Sigma | Mean | Median | Sigma |
| A | 0 | 226 | 6187 | 38.81 | 695 | 679 | 141.9 |
| A | 3 | 137 | 5406 | 33.31 | 695 | 679 | 141.9 |
| A | 12 | 194 | 5033 | 30.68 | 695 | 679 | 141.9 |
| B | 0 | 230 | 27491 | 202.07 | 693 | 675 | 132.7 |
| B | 12 | 111 | 16394 | 118.45 | 693 | 675 | 132.7 |
| B | 11 | 111 | 14148 | 101.53 | 693 | 675 | 132.7 |
| C | 14 | 238 | 103777 | 654.68 | 669 | 673 | 157.5 |
| C | 3 | 233 | 18861 | 115.49 | 669 | 673 | 157.5 |
| C | 13 | 61 | 4612 | 25.01 | 669 | 673 | 157.5 |
| D | 5 | 222 | 264251 | 1607.55 | 673 | 654 | 164.0 |
| D | 13 | 189 | 193644 | 1176.95 | 673 | 654 | 164.0 |
| D | 1 | 52 | 117390 | 711.92 | 673 | 654 | 164.0 |
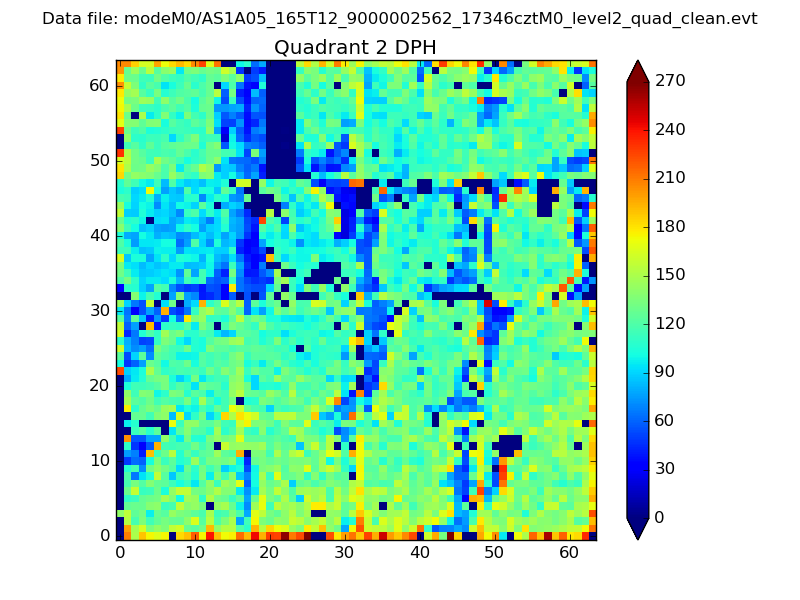
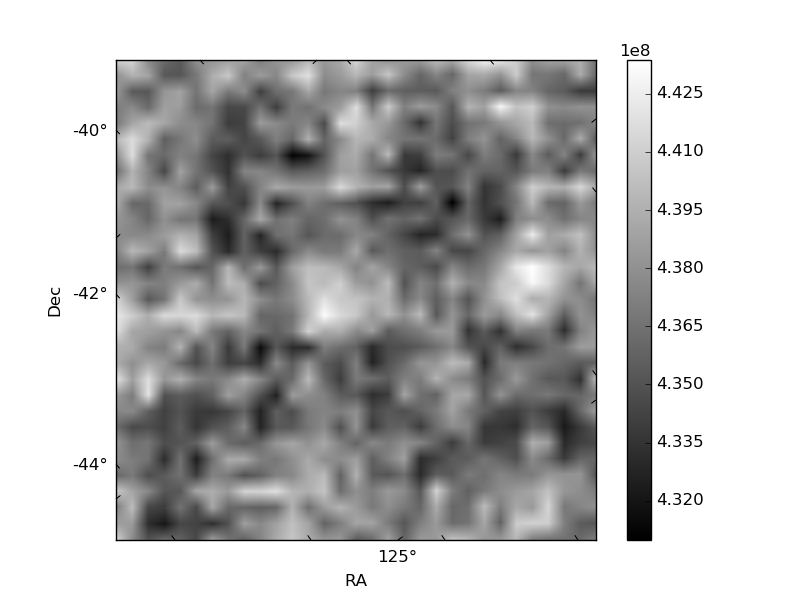
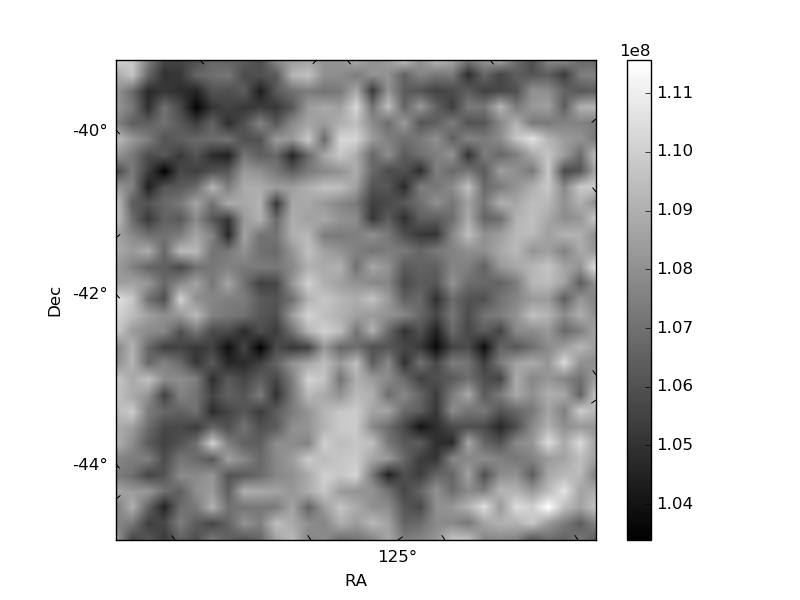
Histogram calculated using DETX and DETY for each event in the final _common_clean file
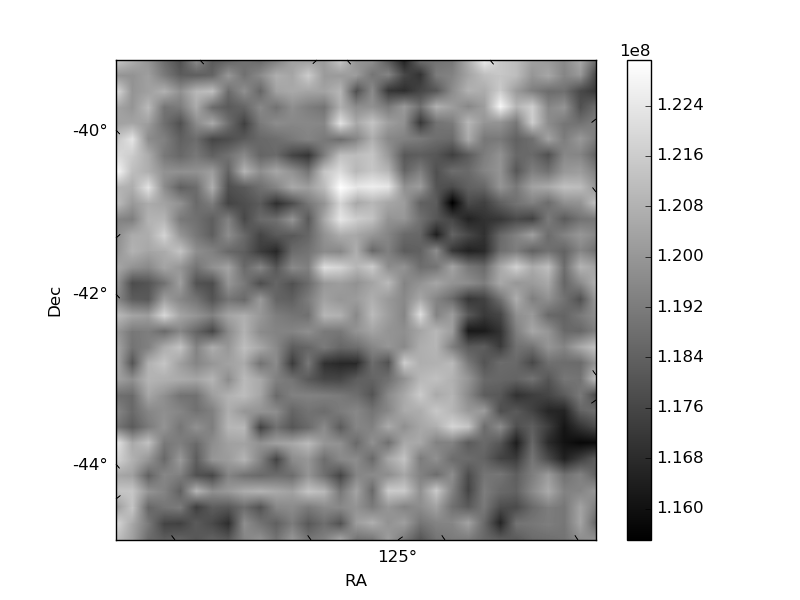
| Quadrant A |  |
 |
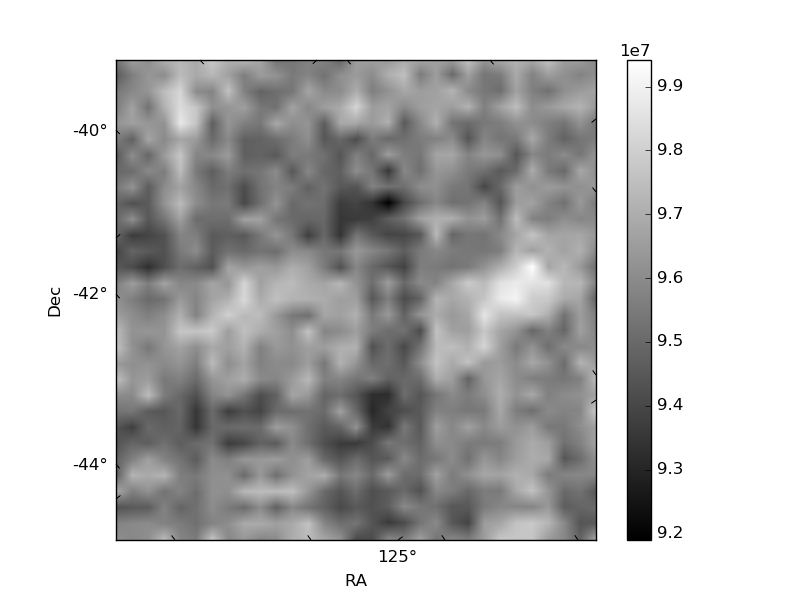
Quadrant B |
|---|---|---|---|
| Quadrant D | 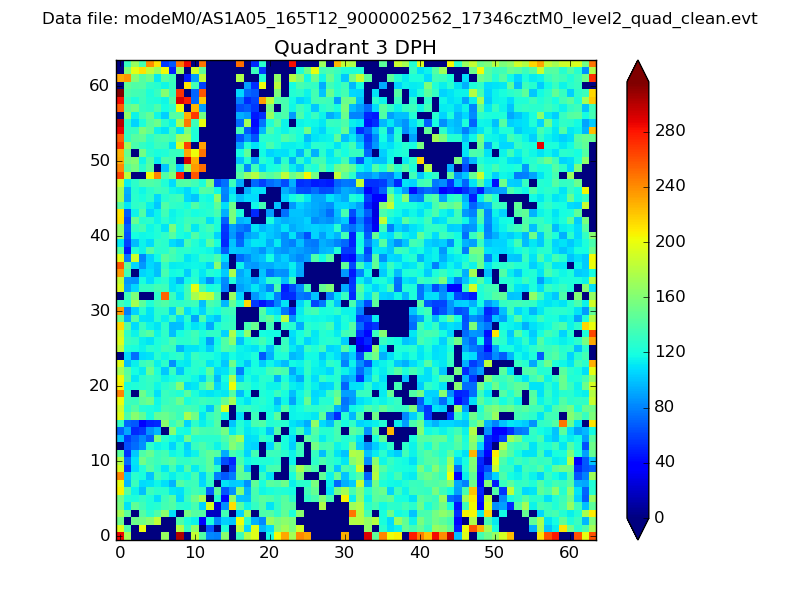 |
 |
Quadrant C |
| Plot type | Count rate plots | Images |
|---|---|---|
| Comparison with Poisson distribution Blue bars denote a histogram of data divided into 1 sec bins. Red curve is a Poisson curve with rate = median count rate of data. |
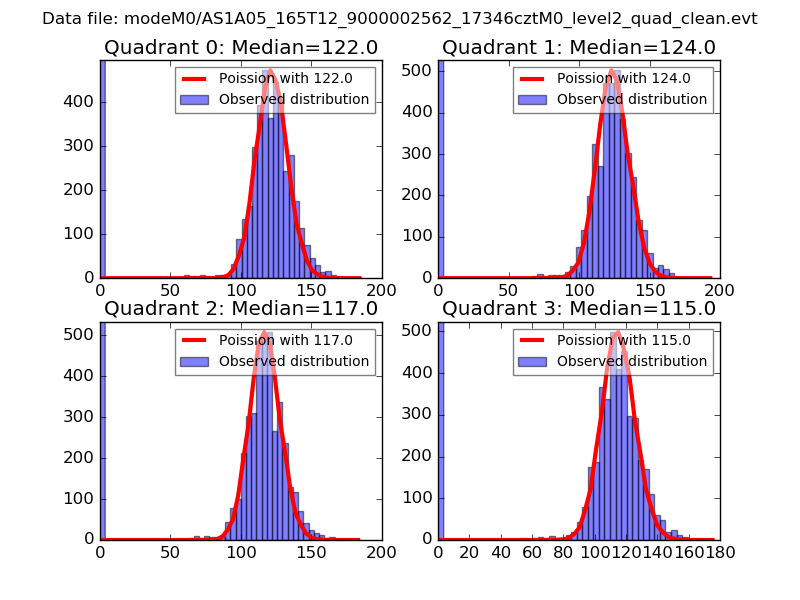 |
 |
| Quadrant-wise count rates Data is divided into 100 sec bins |
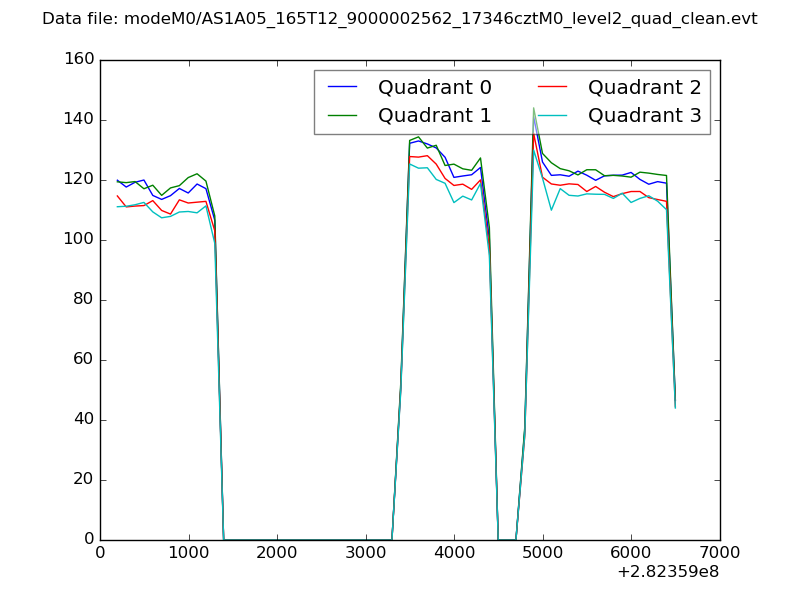 |
|
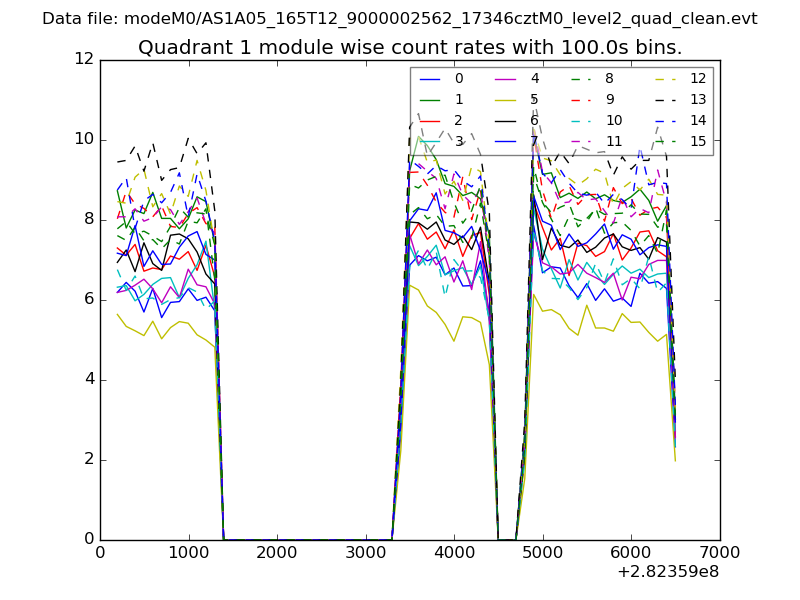
| Module-wise count rates for Quadrant A Data is divided into 100 sec bins |
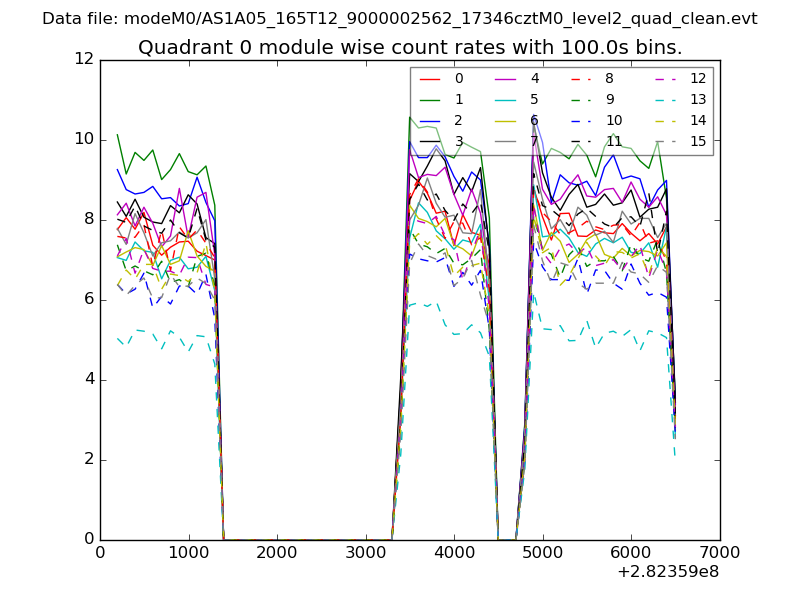 |
 |
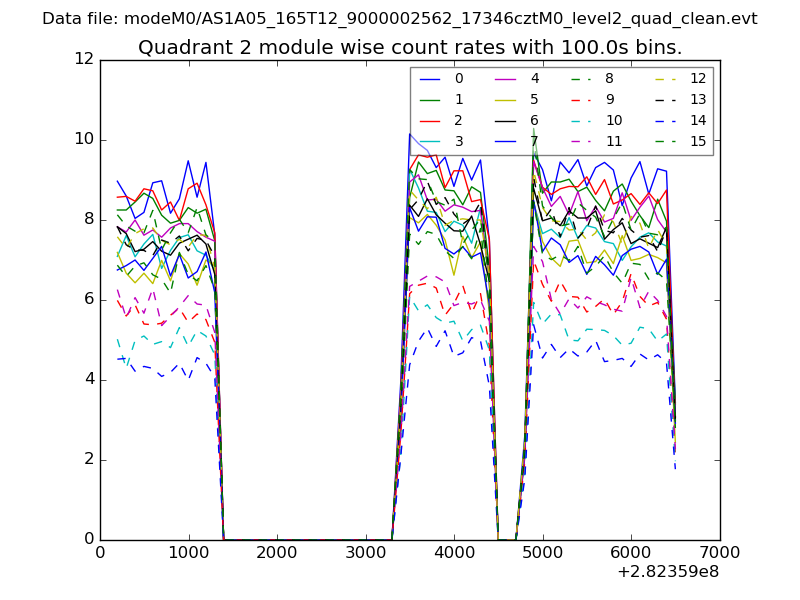
| Module-wise count rates for Quadrant B Data is divided into 100 sec bins |
 |
 |
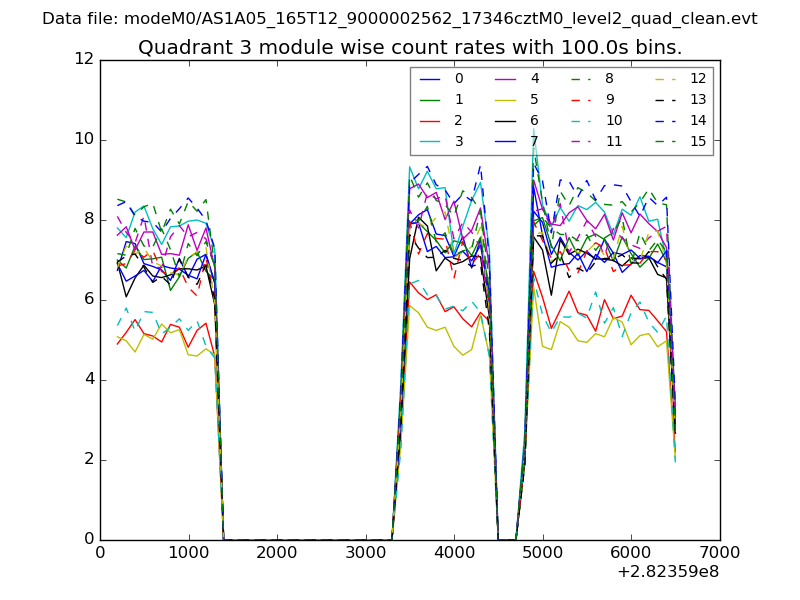
| Module-wise count rates for Quadrant C Data is divided into 100 sec bins |
 |
 |
| Module-wise count rates for Quadrant D Data is divided into 100 sec bins |
 |
 |
| Parameter | Plot |
|---|---|
| CZT HV Monitor | 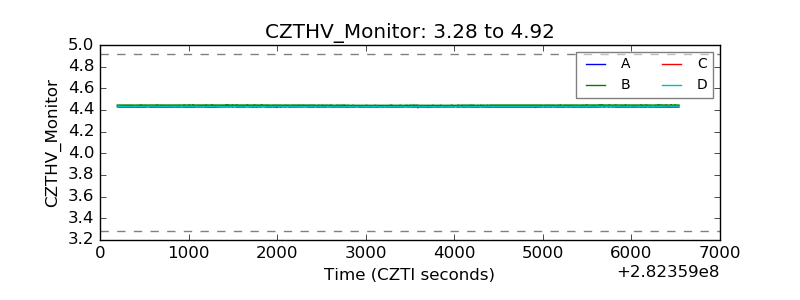 |
| D_VDD | 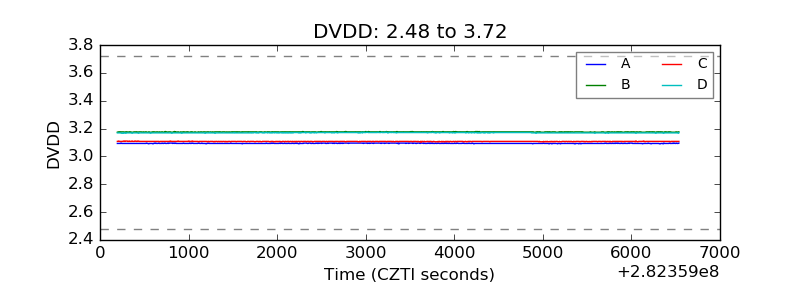 |
| Temperature 1 | 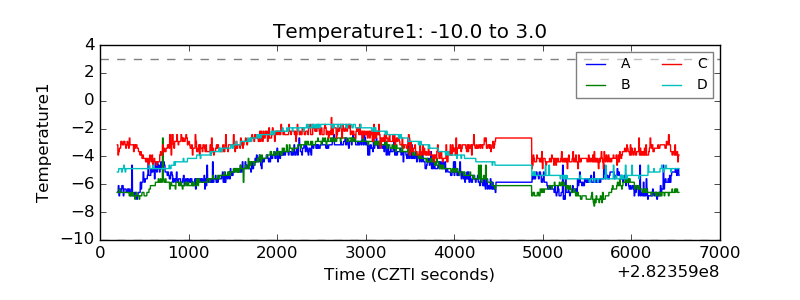 |
| Veto HV Monitor | 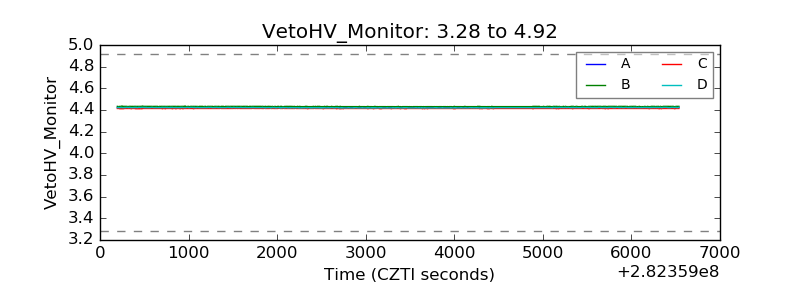 |
| Veto LLD |  |
| Alpha Counter | 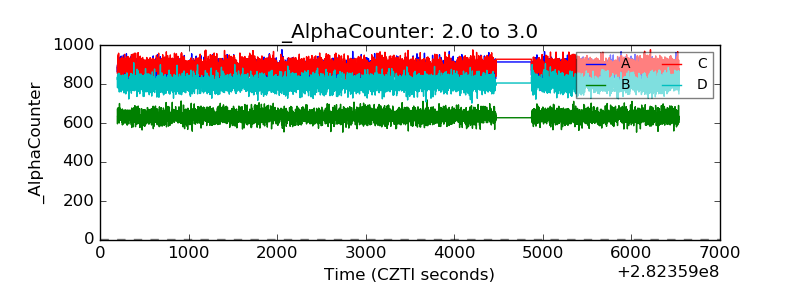 |
| _CPM_Rate | 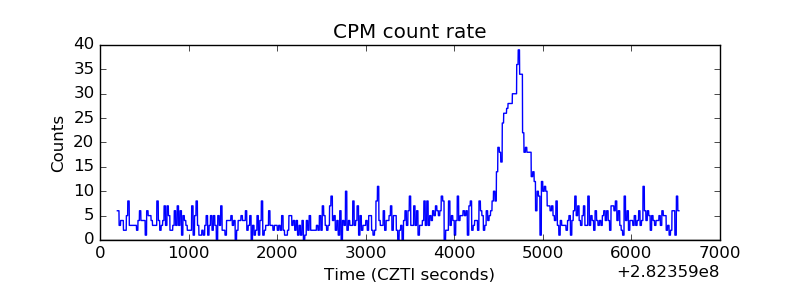 |
| CZT Counter | 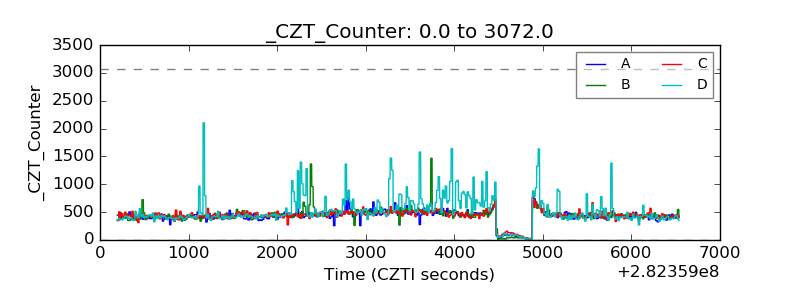 |
| +2.5 Volts monitor |  |
| +5 Volts monitor |  |
| _ROLL_ROT | 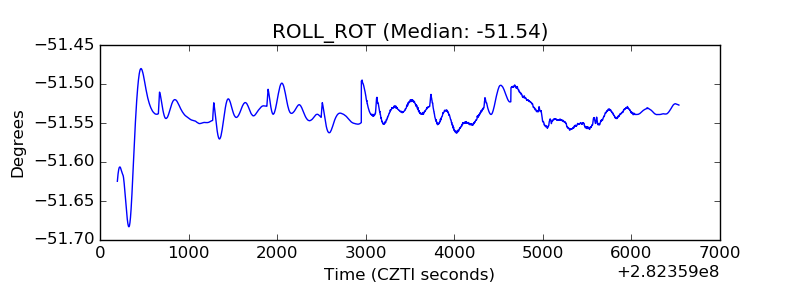 |
| _Roll_DEC | 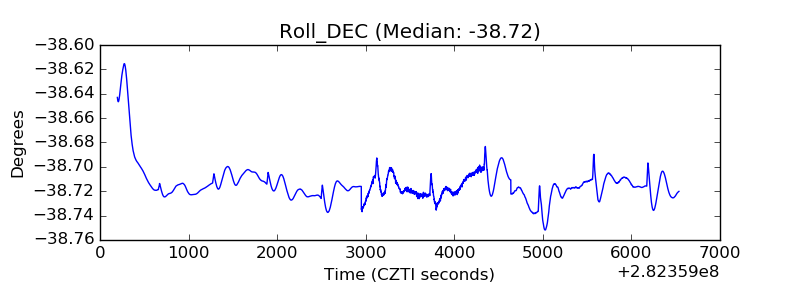 |
| _Roll_RA | 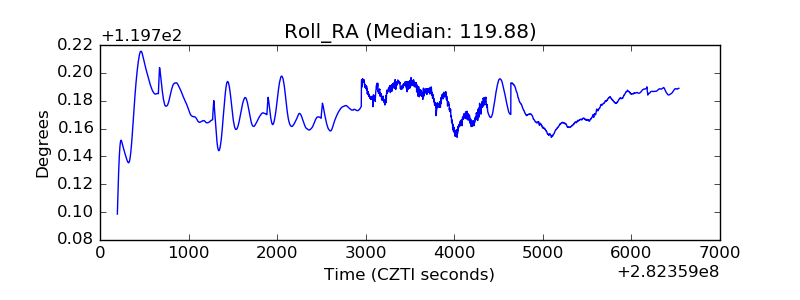 |
| Veto Counter | 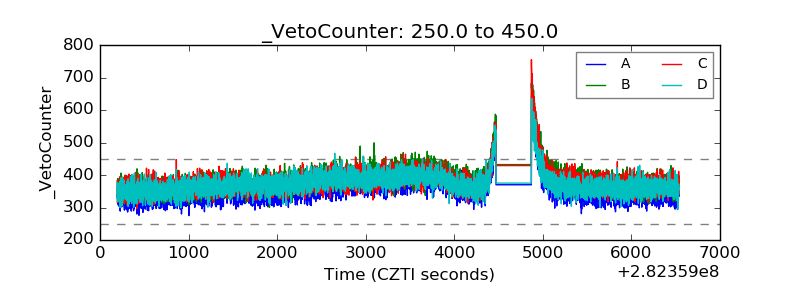 |