| Param | Original file | Final file |
|---|---|---|
| Filename | modeM0/AS1A05_165T12_9000002562_17348cztM0_level2.evt | modeM0/AS1A05_165T12_9000002562_17348cztM0_level2_quad_clean.evt |
| Size (bytes) | 790,649,280 | 159,626,880 |
| Size | 754.0 MB | 152.2 MB |
| Events in quadrant A | 5,563,608 | 1,014,126 |
| Events in quadrant B | 5,711,429 | 1,028,567 |
| Events in quadrant C | 5,741,345 | 974,748 |
| Events in quadrant D | 6,087,586 | 959,574 |
| Mode M9 | |||
|---|---|---|---|
| Quadrant | BADHDUFLAG | Total packets | Discarded packets |
| A | 0 | 14 | 0 |
| B | 0 | 14 | 0 |
| C | 0 | 14 | 0 |
| D | 0 | 14 | 0 |
| Mode M0 | |||
|---|---|---|---|
| Quadrant | BADHDUFLAG | Total packets | Discarded packets |
| A | 0 | 25071 | 2 |
| B | 0 | 25184 | 2 |
| C | 0 | 25109 | 2 |
| D | 0 | 26618 | 3 |
| Mode SS | |||
|---|---|---|---|
| Quadrant | BADHDUFLAG | Total packets | Discarded packets |
| A | 0 | 250 | 0 |
| B | 0 | 250 | 0 |
| C | 0 | 250 | 0 |
| D | 0 | 250 | 0 |
| Quadrant | Total seconds | Saturated seconds | Saturation percentage |
|---|---|---|---|
| A | 12412 | 66 | 0.531743% |
| B | 12413 | 70 | 0.563925% |
| C | 12413 | 140 | 1.127850% |
| D | 12412 | 86 | 0.692878% |
Noise dominated data is calculated using 1-second bins in cleaned event files. If a bin has >2000 counts, and if more than 50% of those come from <1% of pixels, then it is considered to be noise-dominated and hence unusable.
| Quadrant | # 1 sec bins | Bins with >0 counts | Bins with >2000 counts | High rate bins dominated by noise | Noise dominated (total time) | Noise dominated (detector-on time) | Marked lightcurve |
|---|---|---|---|---|---|---|---|
| A | 13692 | 12414 | 0 | 0 | 0.00% | 0.00% | 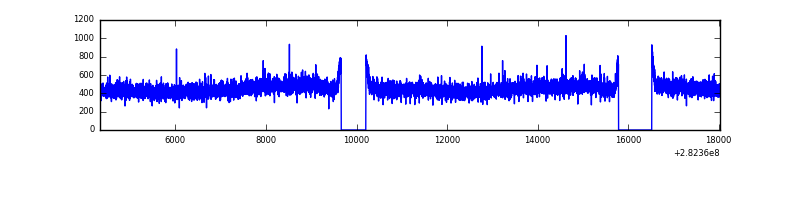 |
| B | 13693 | 12415 | 2 | 2 | 0.01% | 0.02% | 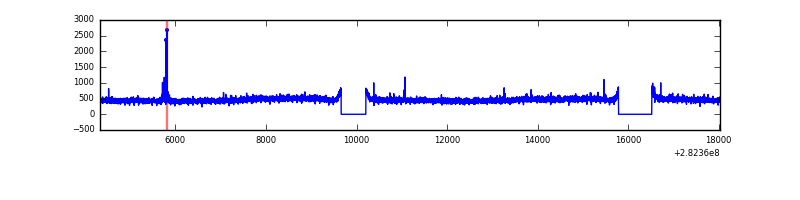 |
| C | 13693 | 12414 | 0 | 0 | 0.00% | 0.00% | 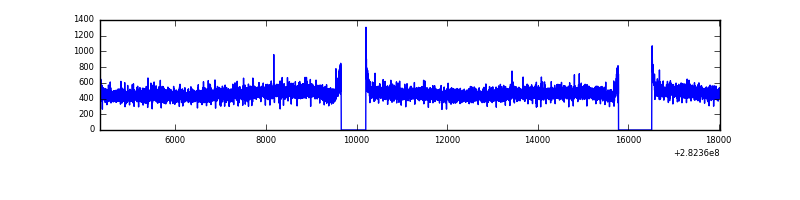 |
| D | 13692 | 12414 | 26 | 26 | 0.19% | 0.21% |  |
Top three noisy pixels from each quadrant. If the there are fewer than three noisy pixels in the level2.evt file, extra rows are filled as -1
| Pixel properties | Quadrant properties | ||||||
|---|---|---|---|---|---|---|---|
| Quadrant | DetID | PixID | Counts | Sigma | Mean | Median | Sigma |
| A | 0 | 226 | 12541 | 38.05 | 1448 | 1417 | 292.4 |
| A | 3 | 137 | 11145 | 33.27 | 1448 | 1417 | 292.4 |
| A | 12 | 194 | 10247 | 30.2 | 1448 | 1417 | 292.4 |
| B | 4 | 173 | 35626 | 125.04 | 1447 | 1409 | 273.6 |
| B | 12 | 111 | 33957 | 118.94 | 1447 | 1409 | 273.6 |
| B | 11 | 111 | 30434 | 106.07 | 1447 | 1409 | 273.6 |
| C | 14 | 238 | 214690 | 652.44 | 1400 | 1406 | 326.9 |
| C | 3 | 233 | 72872 | 218.62 | 1400 | 1406 | 326.9 |
| C | 13 | 61 | 9706 | 25.39 | 1400 | 1406 | 326.9 |
| D | 5 | 222 | 295162 | 855.88 | 1410 | 1368 | 343.3 |
| D | 13 | 189 | 175847 | 508.29 | 1410 | 1368 | 343.3 |
| D | 1 | 52 | 146601 | 423.09 | 1410 | 1368 | 343.3 |
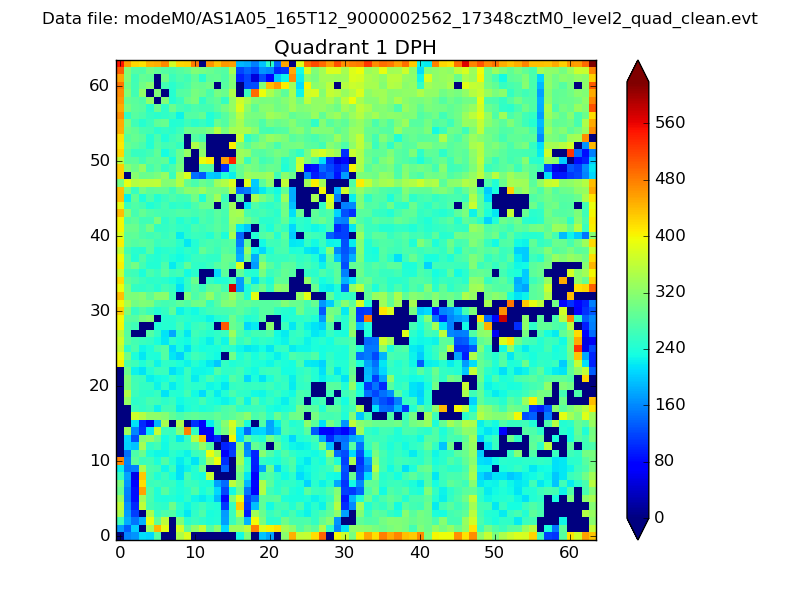
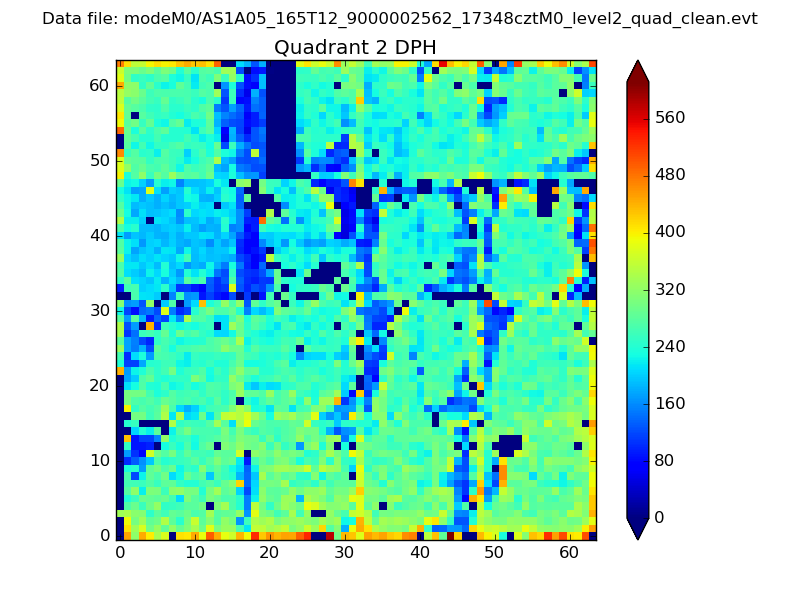
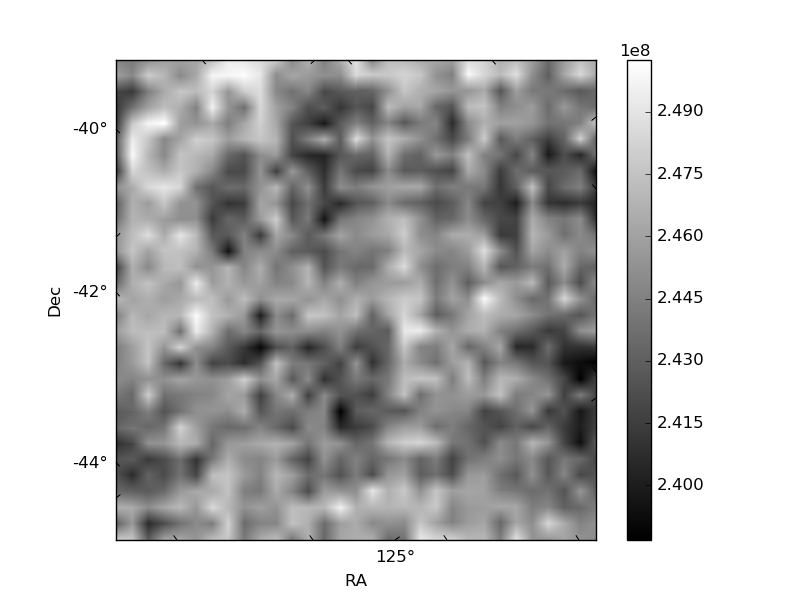
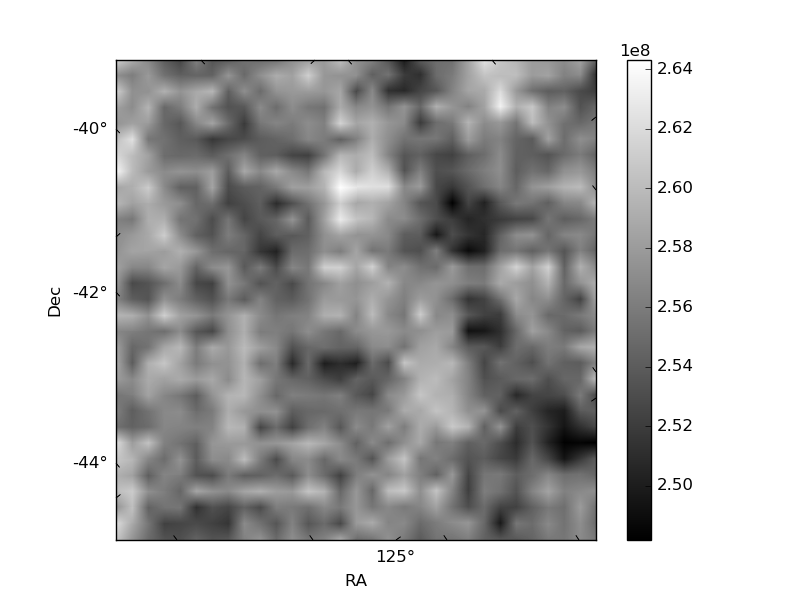
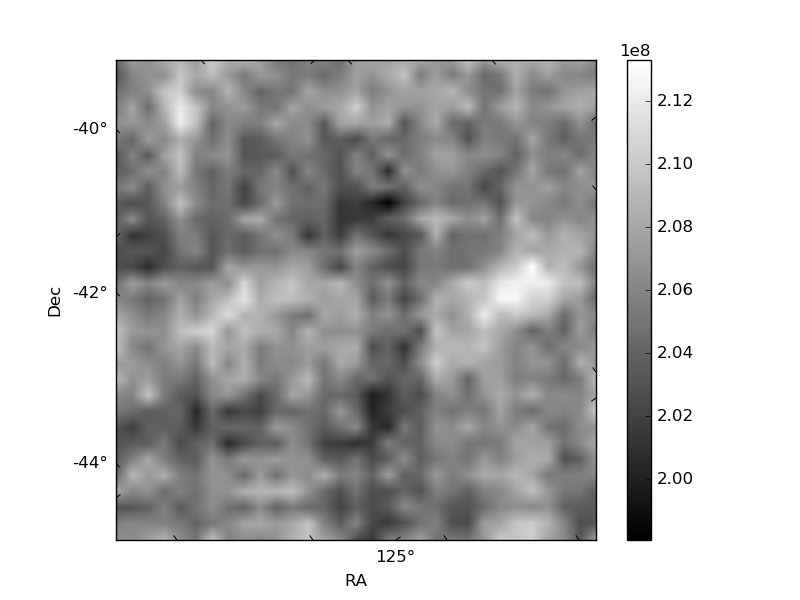
Histogram calculated using DETX and DETY for each event in the final _common_clean file
| Quadrant A | 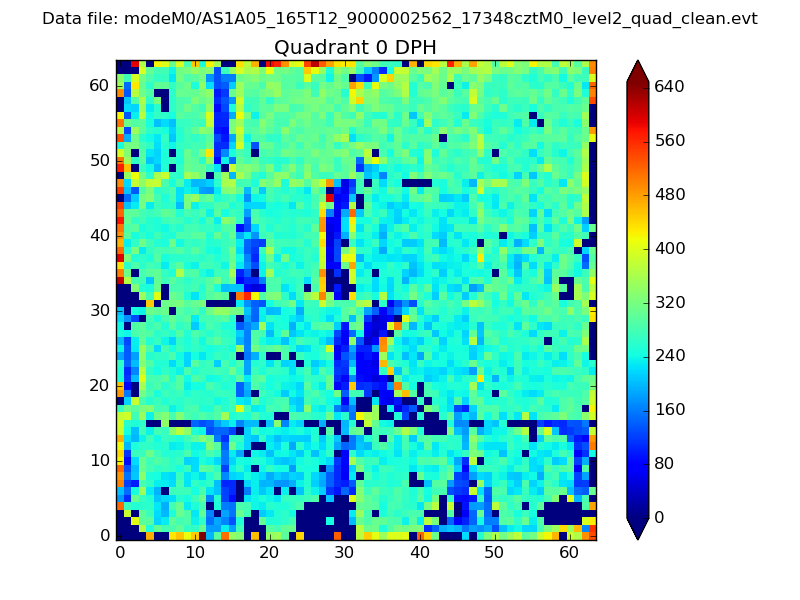 |
 |
Quadrant B |
|---|---|---|---|
| Quadrant D |  |
 |
Quadrant C |
| Plot type | Count rate plots | Images |
|---|---|---|
| Comparison with Poisson distribution Blue bars denote a histogram of data divided into 1 sec bins. Red curve is a Poisson curve with rate = median count rate of data. |
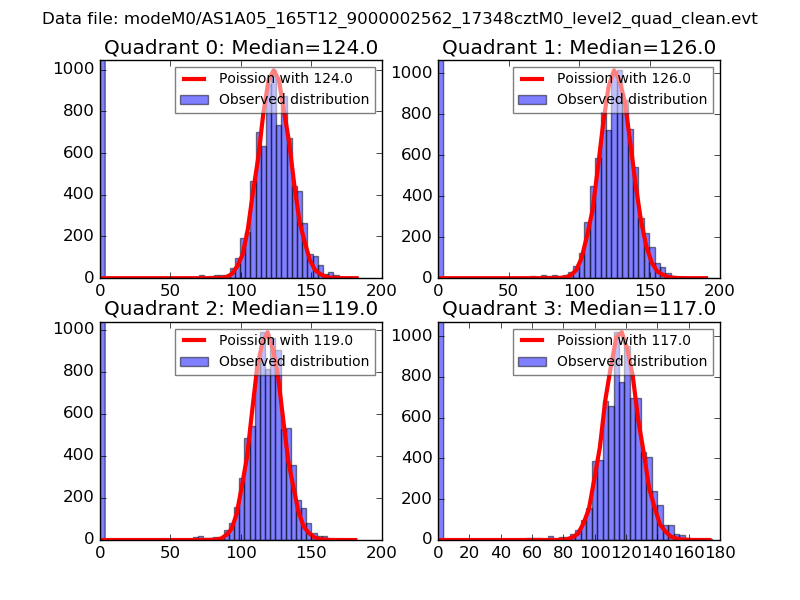 |
 |
| Quadrant-wise count rates Data is divided into 100 sec bins |
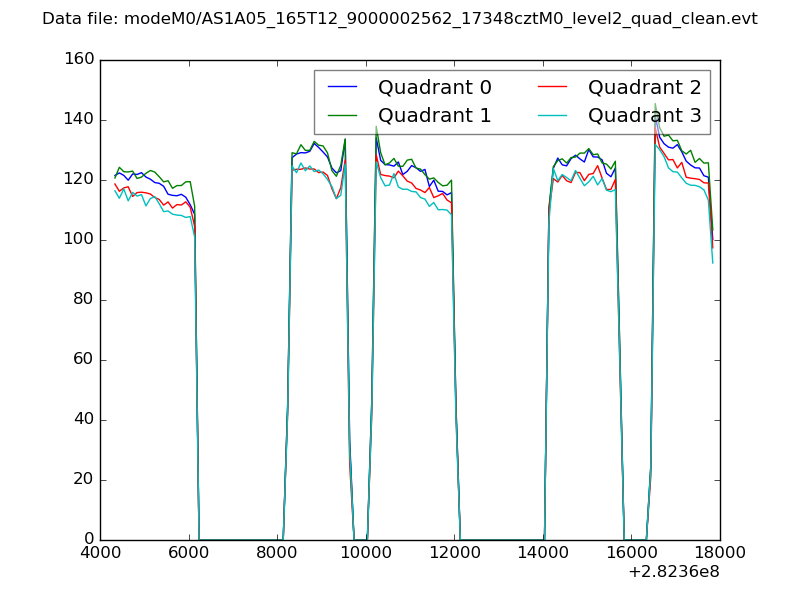 |
|
| Module-wise count rates for Quadrant A Data is divided into 100 sec bins |
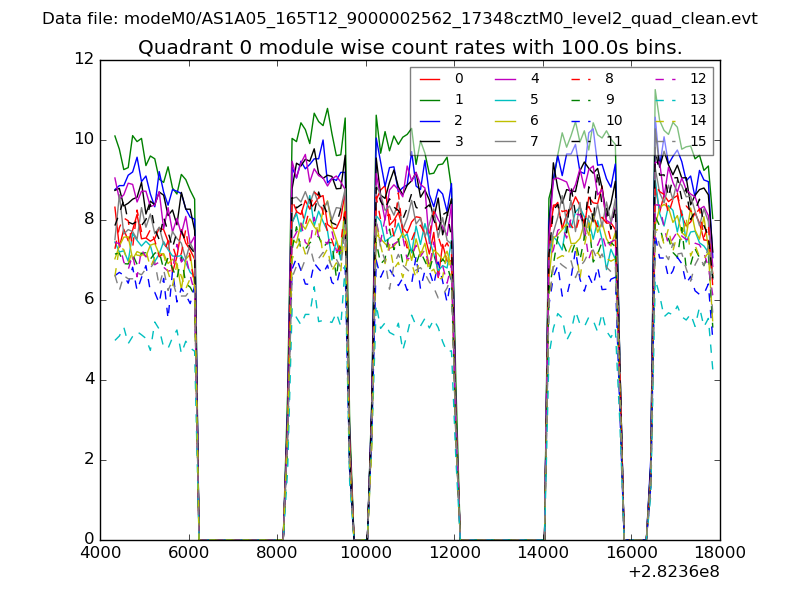 |
 |
| Module-wise count rates for Quadrant B Data is divided into 100 sec bins |
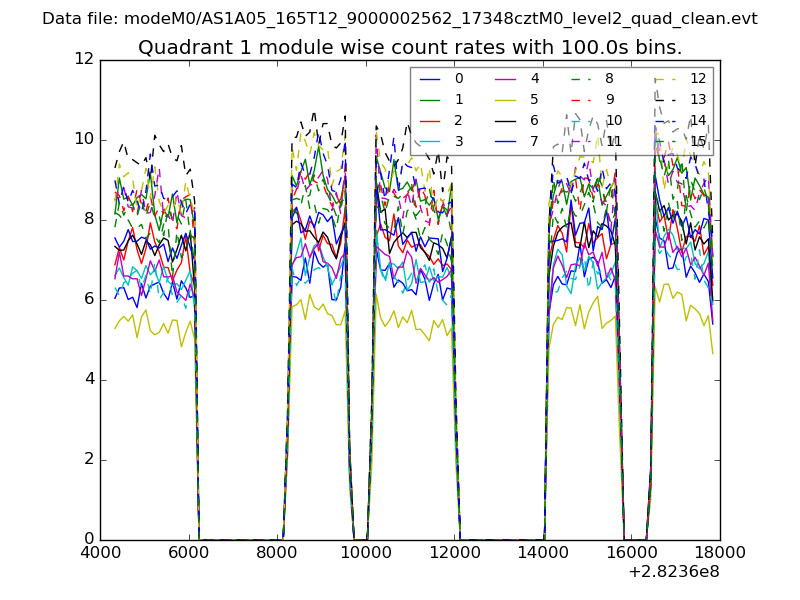 |
 |
| Module-wise count rates for Quadrant C Data is divided into 100 sec bins |
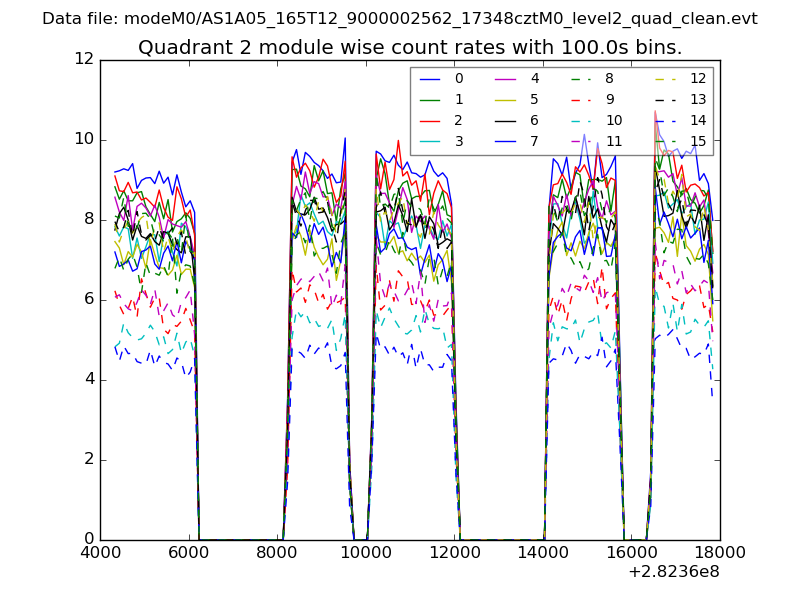 |
 |
| Module-wise count rates for Quadrant D Data is divided into 100 sec bins |
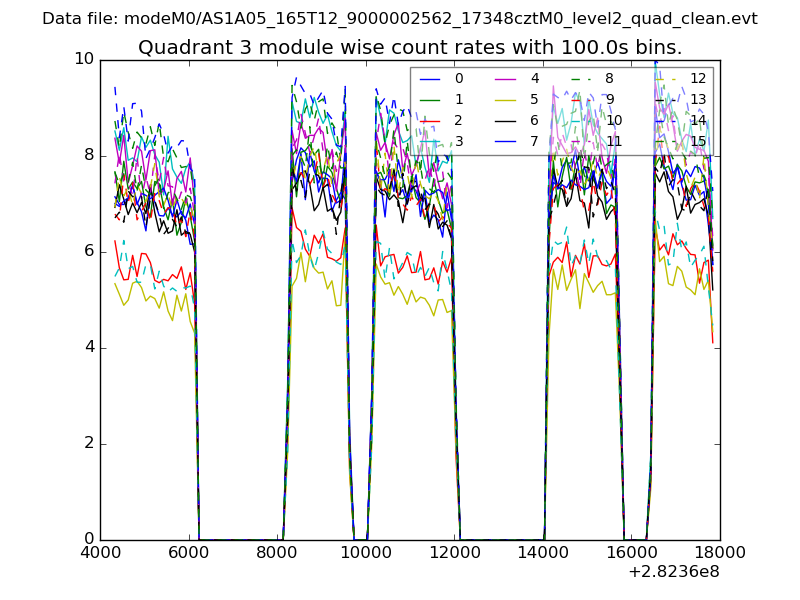 |
 |
| Parameter | Plot |
|---|---|
| CZT HV Monitor | 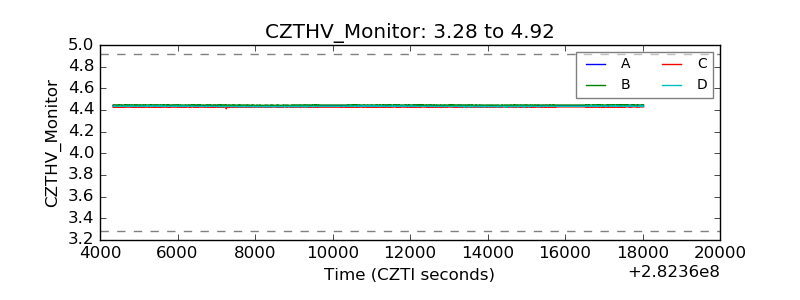 |
| D_VDD | 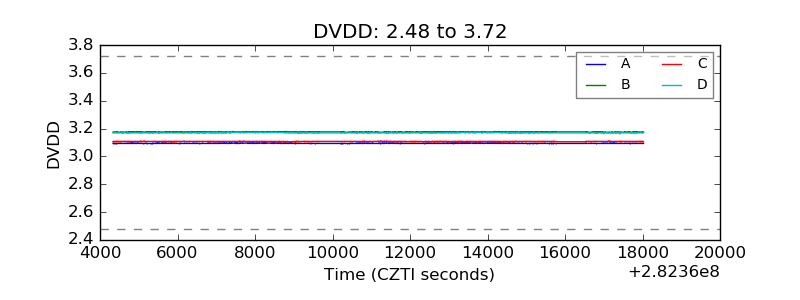 |
| Temperature 1 |  |
| Veto HV Monitor | 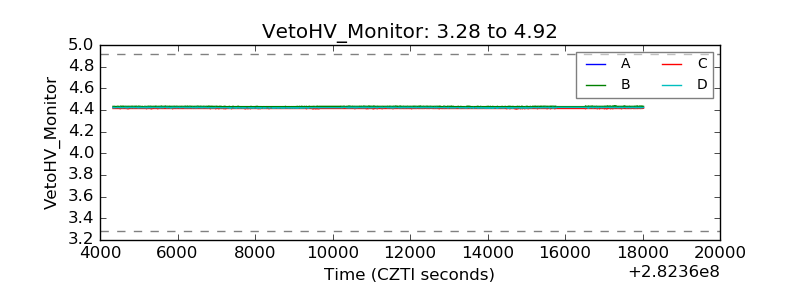 |
| Veto LLD | 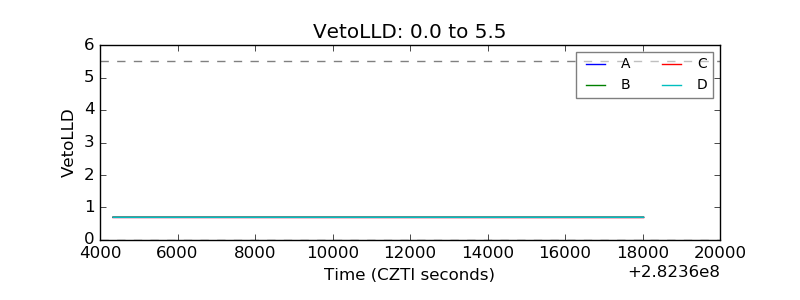 |
| Alpha Counter | 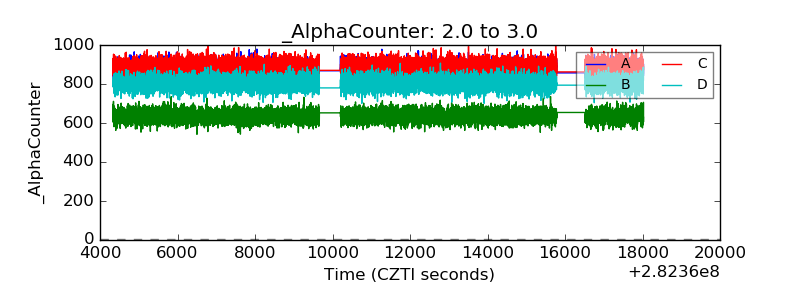 |
| _CPM_Rate | 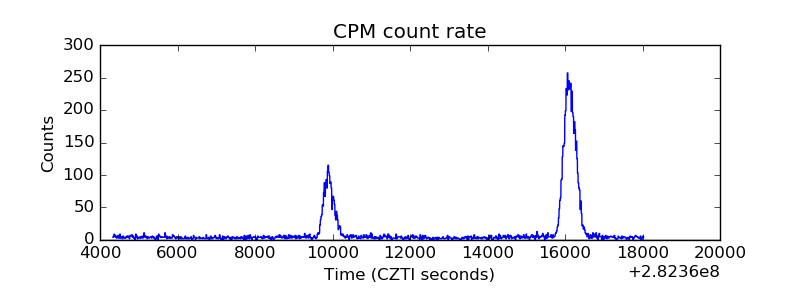 |
| CZT Counter | 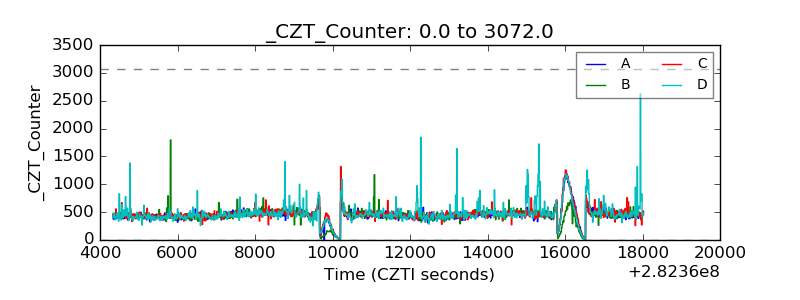 |
| +2.5 Volts monitor |  |
| +5 Volts monitor |  |
| _ROLL_ROT | 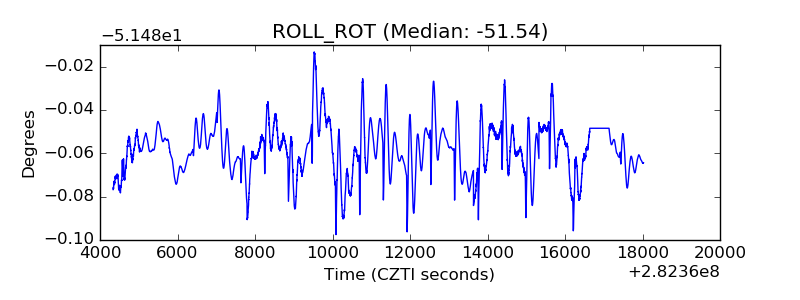 |
| _Roll_DEC | 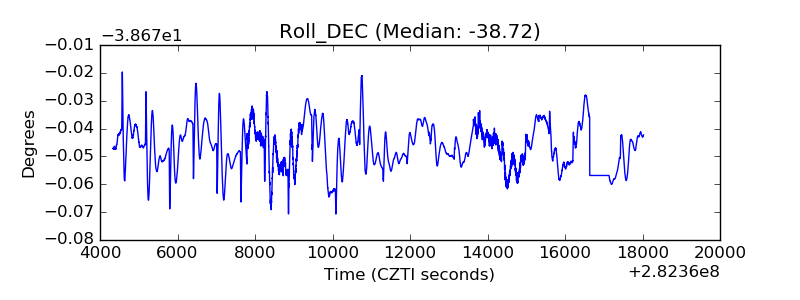 |
| _Roll_RA | 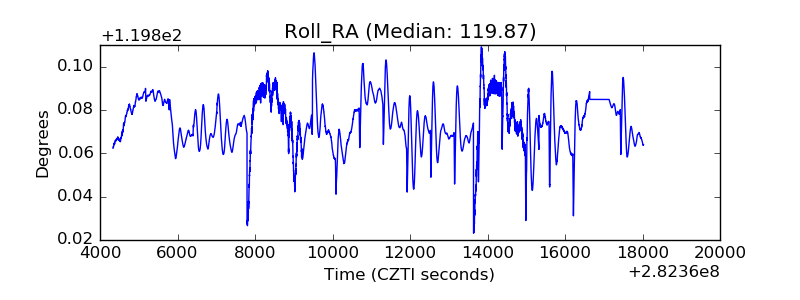 |
| Veto Counter | 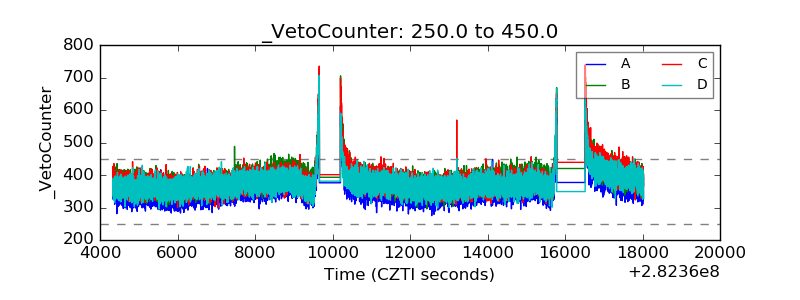 |