| Param | Original file | Final file |
|---|---|---|
| Filename | modeM0/AS1A05_165T12_9000002562_17349cztM0_level2.evt | modeM0/AS1A05_165T12_9000002562_17349cztM0_level2_quad_clean.evt |
| Size (bytes) | 396,624,960 | 73,540,800 |
| Size | 378.3 MB | 70.1 MB |
| Events in quadrant A | 2,739,558 | 460,488 |
| Events in quadrant B | 2,827,841 | 467,841 |
| Events in quadrant C | 2,865,970 | 444,100 |
| Events in quadrant D | 3,169,902 | 435,123 |
| Mode M9 | |||
|---|---|---|---|
| Quadrant | BADHDUFLAG | Total packets | Discarded packets |
| A | 0 | 9 | 0 |
| B | 0 | 9 | 0 |
| C | 0 | 9 | 0 |
| D | 0 | 9 | 0 |
| Mode M0 | |||
|---|---|---|---|
| Quadrant | BADHDUFLAG | Total packets | Discarded packets |
| A | 0 | 12166 | 1 |
| B | 0 | 12277 | 1 |
| C | 0 | 12296 | 1 |
| D | 0 | 13350 | 1 |
| Mode SS | |||
|---|---|---|---|
| Quadrant | BADHDUFLAG | Total packets | Discarded packets |
| A | 0 | 122 | 0 |
| B | 0 | 122 | 0 |
| C | 0 | 122 | 0 |
| D | 0 | 122 | 0 |
| Quadrant | Total seconds | Saturated seconds | Saturation percentage |
|---|---|---|---|
| A | 6002 | 50 | 0.833056% |
| B | 6003 | 60 | 0.999500% |
| C | 6003 | 75 | 1.249375% |
| D | 6003 | 79 | 1.316009% |
Noise dominated data is calculated using 1-second bins in cleaned event files. If a bin has >2000 counts, and if more than 50% of those come from <1% of pixels, then it is considered to be noise-dominated and hence unusable.
| Quadrant | # 1 sec bins | Bins with >0 counts | Bins with >2000 counts | High rate bins dominated by noise | Noise dominated (total time) | Noise dominated (detector-on time) | Marked lightcurve |
|---|---|---|---|---|---|---|---|
| A | 6897 | 6002 | 0 | 0 | 0.00% | 0.00% | 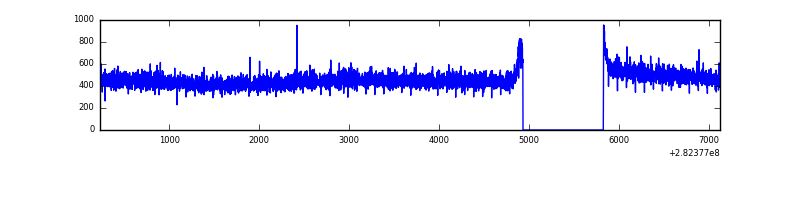 |
| B | 6898 | 6003 | 2 | 2 | 0.03% | 0.03% | 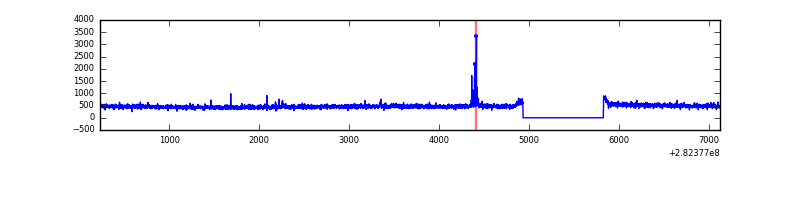 |
| C | 6898 | 6003 | 0 | 0 | 0.00% | 0.00% | 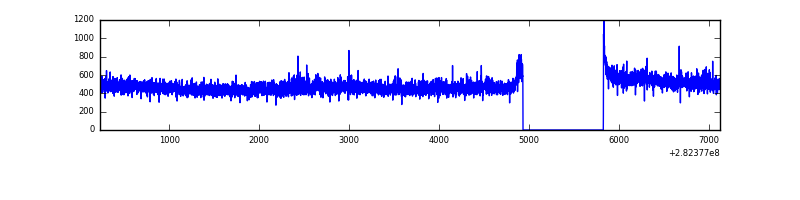 |
| D | 6898 | 6003 | 25 | 25 | 0.36% | 0.42% | 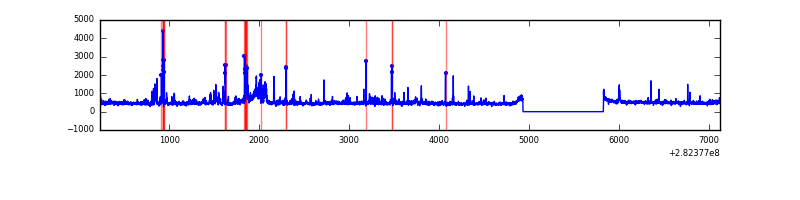 |
Top three noisy pixels from each quadrant. If the there are fewer than three noisy pixels in the level2.evt file, extra rows are filled as -1
| Pixel properties | Quadrant properties | ||||||
|---|---|---|---|---|---|---|---|
| Quadrant | DetID | PixID | Counts | Sigma | Mean | Median | Sigma |
| A | 0 | 226 | 6173 | 38.07 | 712 | 697 | 143.8 |
| A | 3 | 137 | 5430 | 32.9 | 712 | 697 | 143.8 |
| A | 12 | 194 | 5198 | 31.29 | 712 | 697 | 143.8 |
| B | 4 | 173 | 32628 | 234.3 | 711 | 692 | 136.3 |
| B | 12 | 111 | 16711 | 117.52 | 711 | 692 | 136.3 |
| B | 0 | 229 | 16380 | 115.1 | 711 | 692 | 136.3 |
| C | 14 | 238 | 105436 | 647.35 | 688 | 692 | 161.8 |
| C | 3 | 233 | 77201 | 472.85 | 688 | 692 | 161.8 |
| C | 13 | 61 | 4692 | 24.72 | 688 | 692 | 161.8 |
| D | 5 | 222 | 377040 | 2217.98 | 695 | 673 | 169.7 |
| D | 13 | 189 | 85246 | 498.4 | 695 | 673 | 169.7 |
| D | 1 | 52 | 45827 | 266.1 | 695 | 673 | 169.7 |
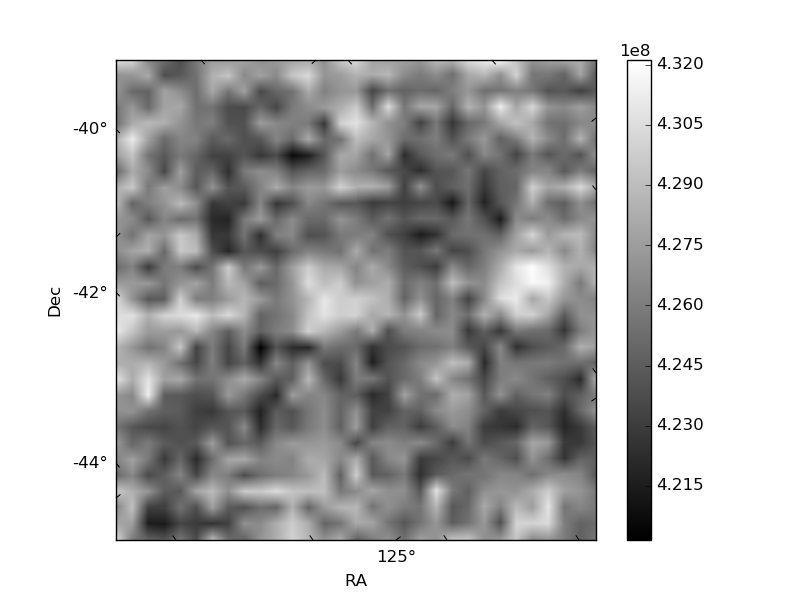
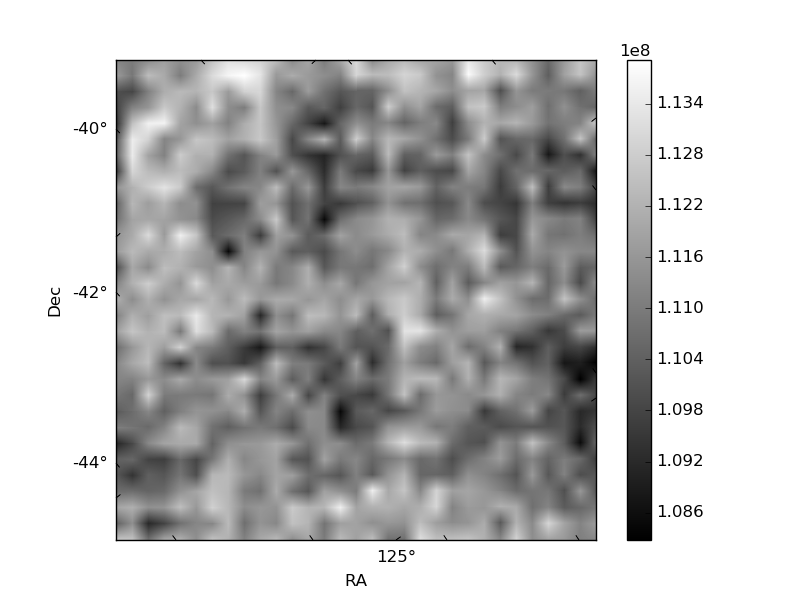
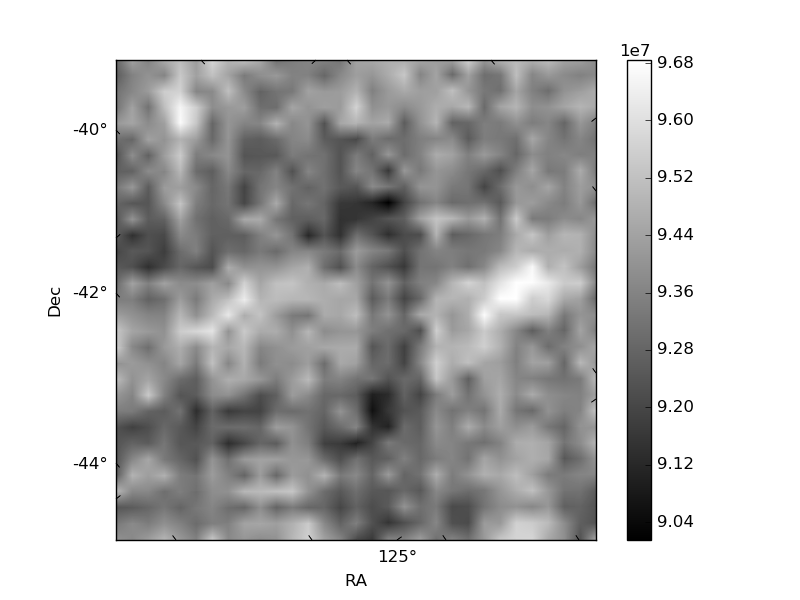
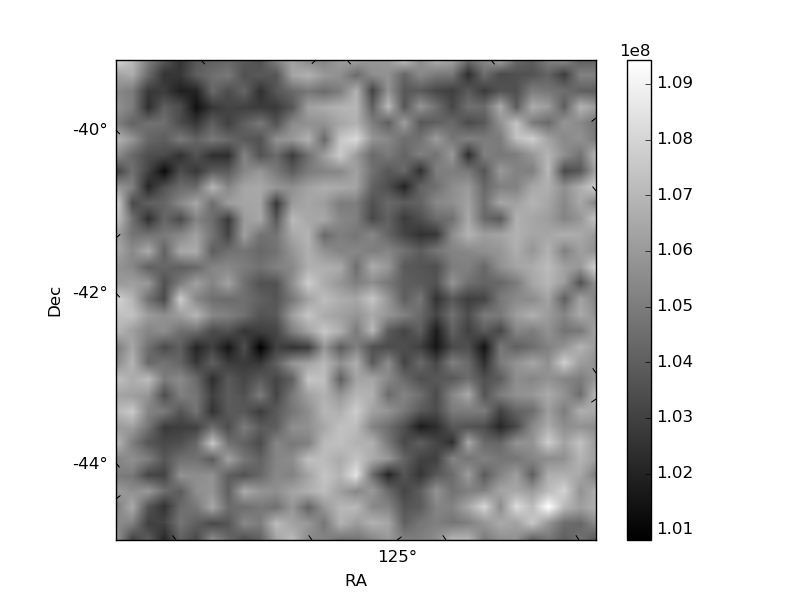
Histogram calculated using DETX and DETY for each event in the final _common_clean file
| Quadrant A | 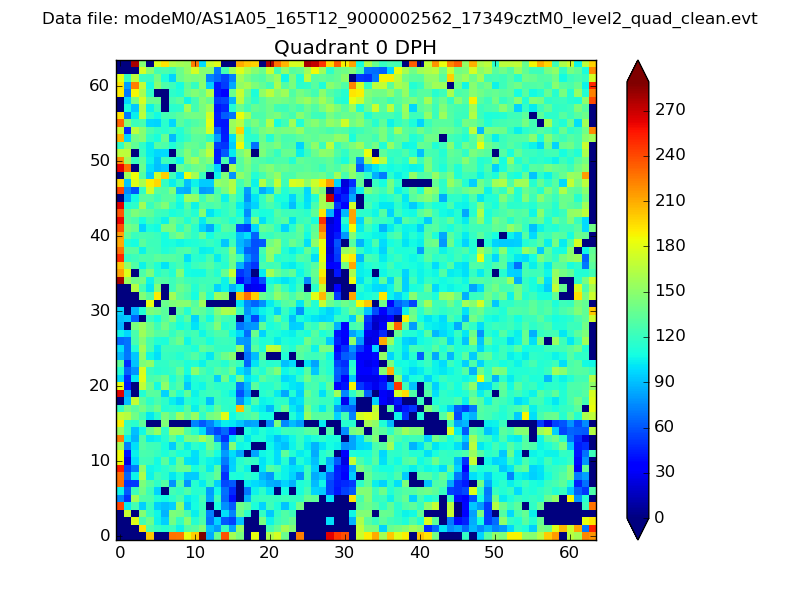 |
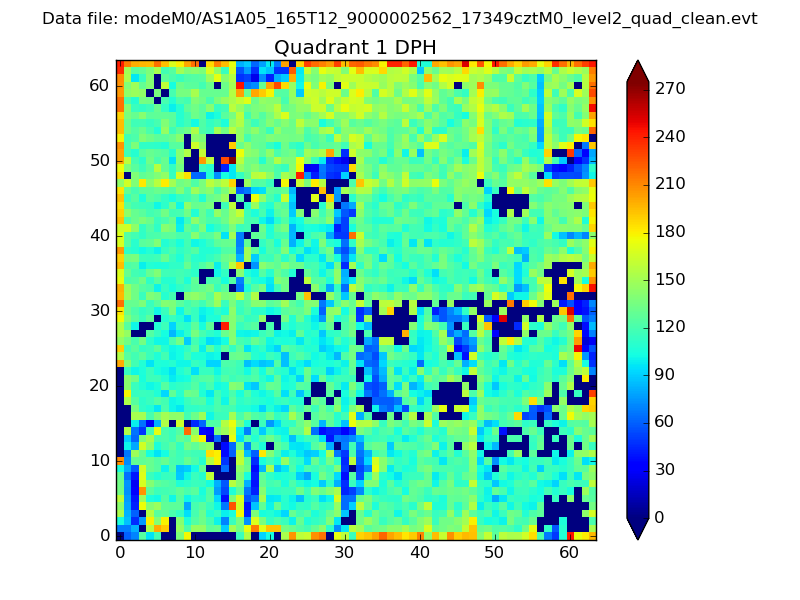 |
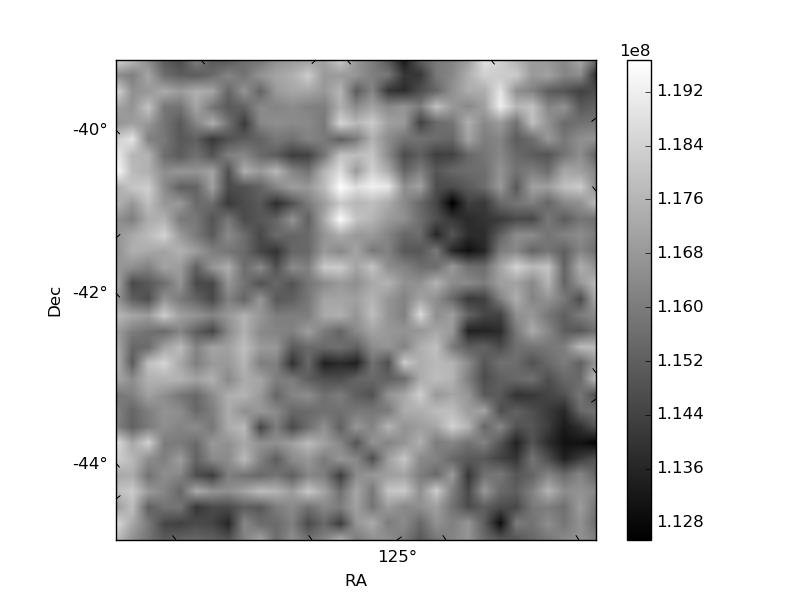
Quadrant B |
|---|---|---|---|
| Quadrant D | 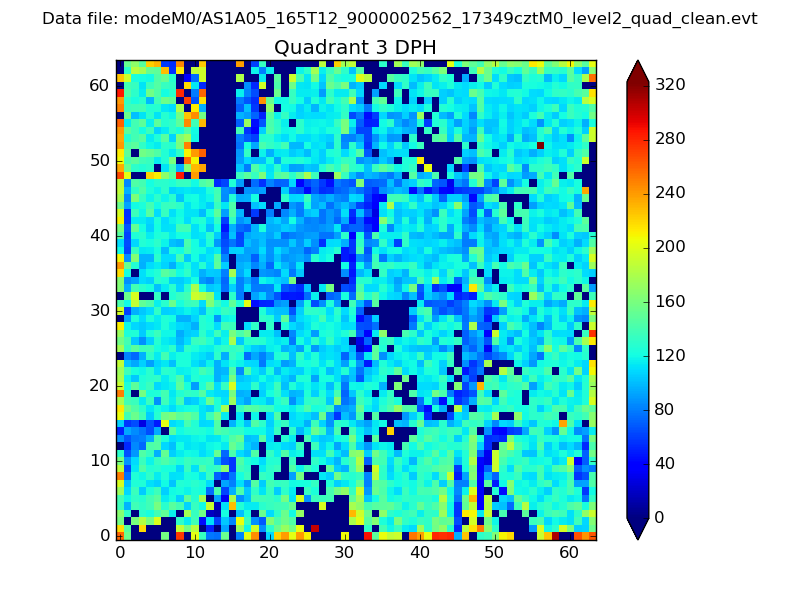 |
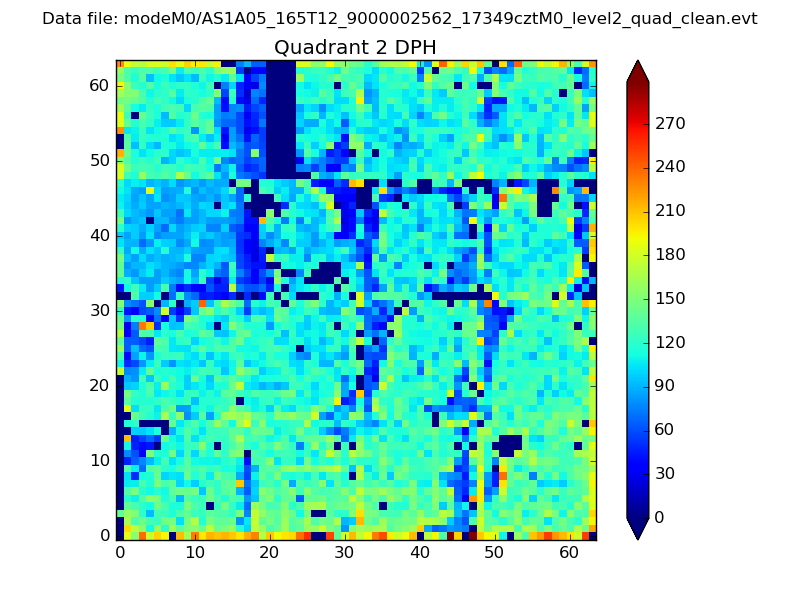 |
Quadrant C |
| Plot type | Count rate plots | Images |
|---|---|---|
| Comparison with Poisson distribution Blue bars denote a histogram of data divided into 1 sec bins. Red curve is a Poisson curve with rate = median count rate of data. |
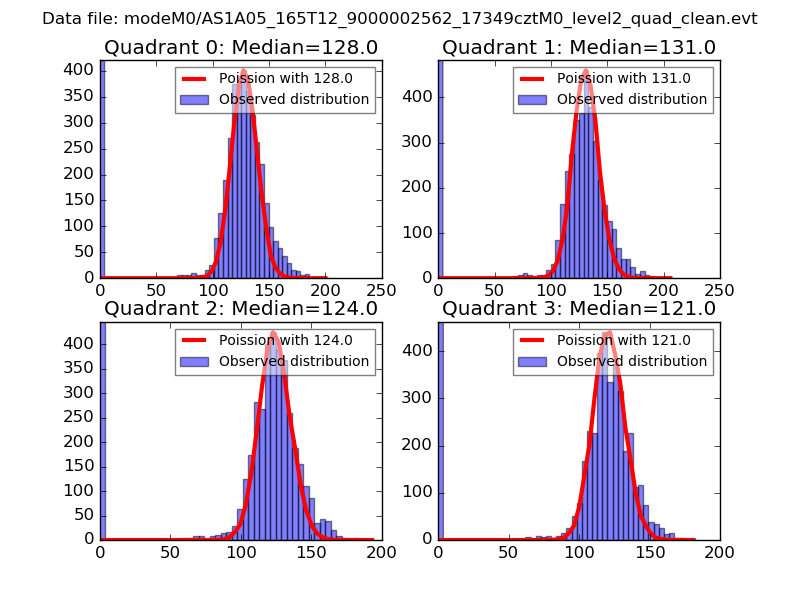 |
 |
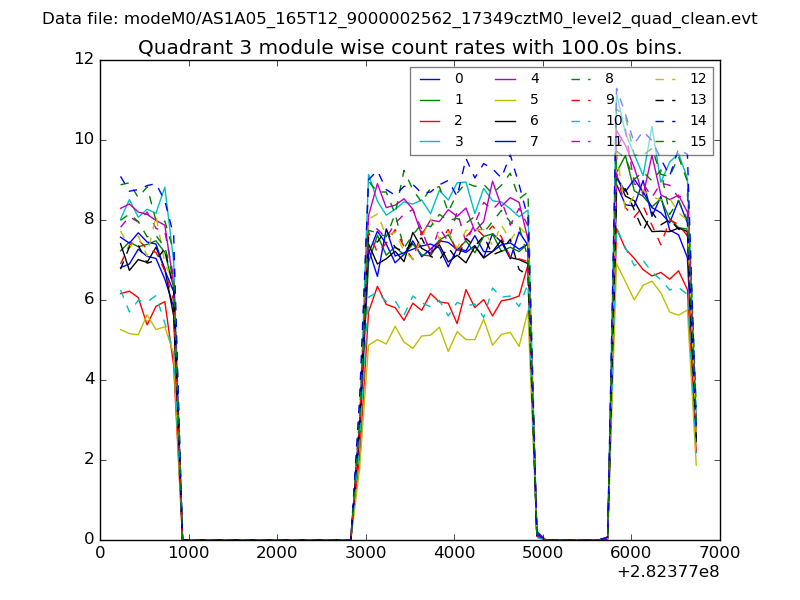
| Quadrant-wise count rates Data is divided into 100 sec bins |
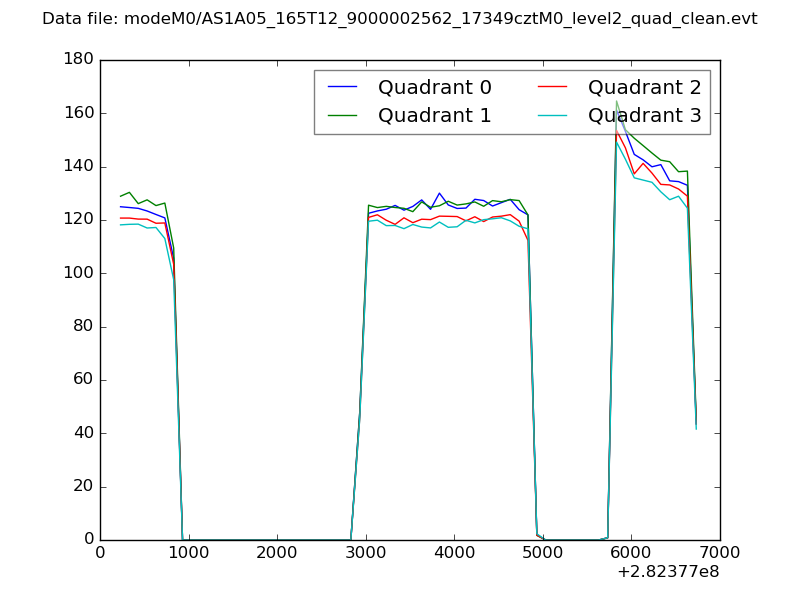 |
|
| Module-wise count rates for Quadrant A Data is divided into 100 sec bins |
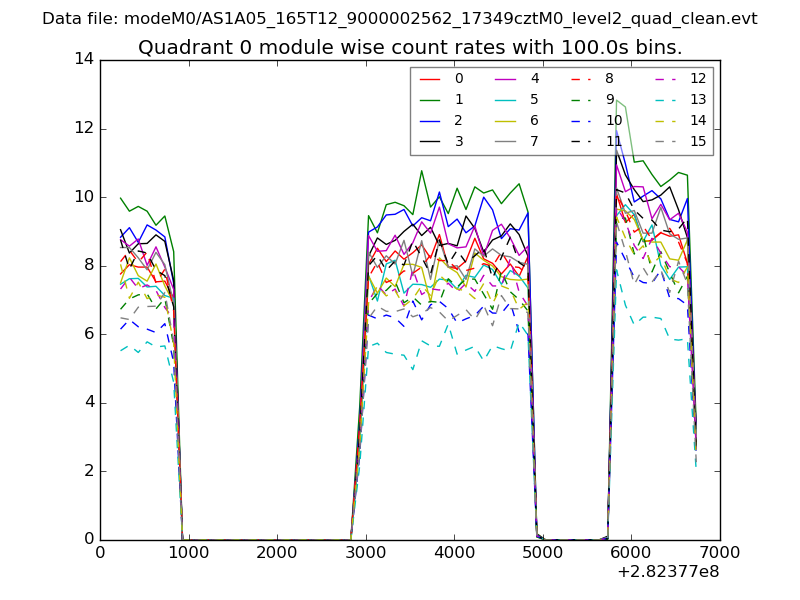 |
 |
| Module-wise count rates for Quadrant B Data is divided into 100 sec bins |
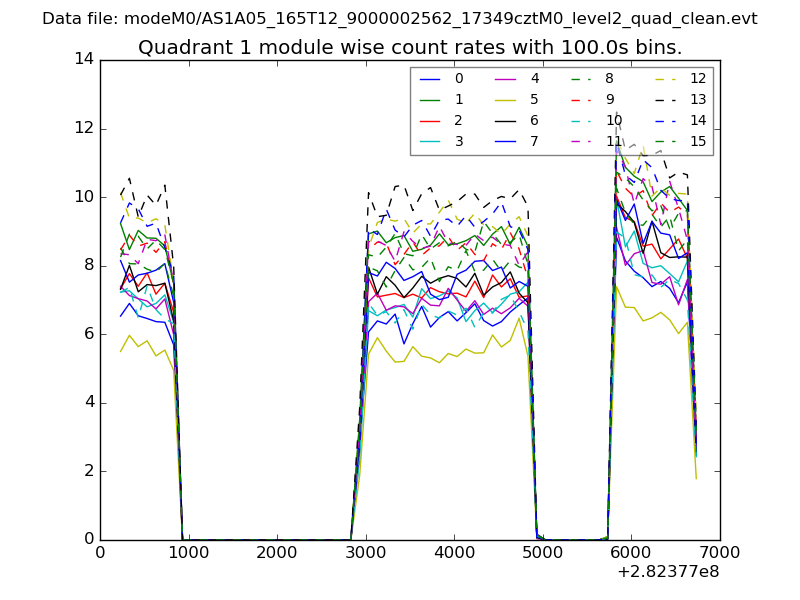 |
 |
| Module-wise count rates for Quadrant C Data is divided into 100 sec bins |
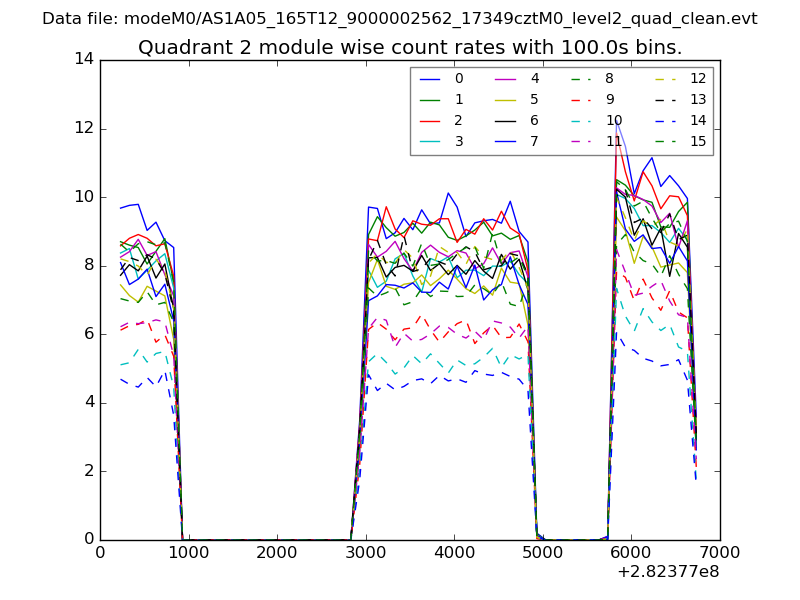 |
 |
| Module-wise count rates for Quadrant D Data is divided into 100 sec bins |
 |
 |
| Parameter | Plot |
|---|---|
| CZT HV Monitor | 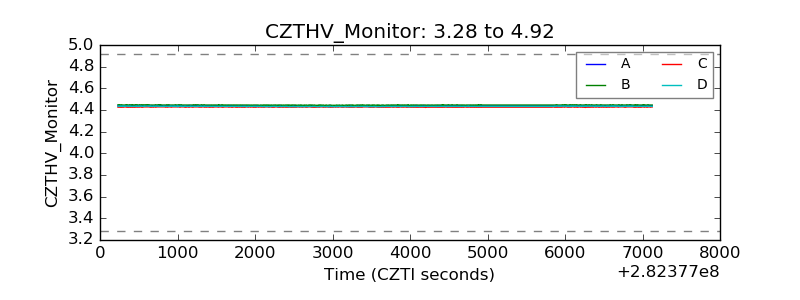 |
| D_VDD | 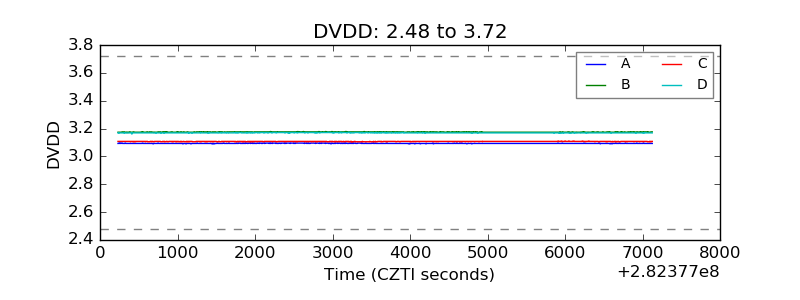 |
| Temperature 1 | 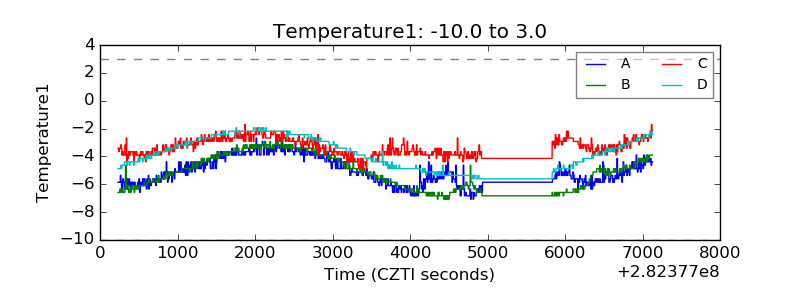 |
| Veto HV Monitor | 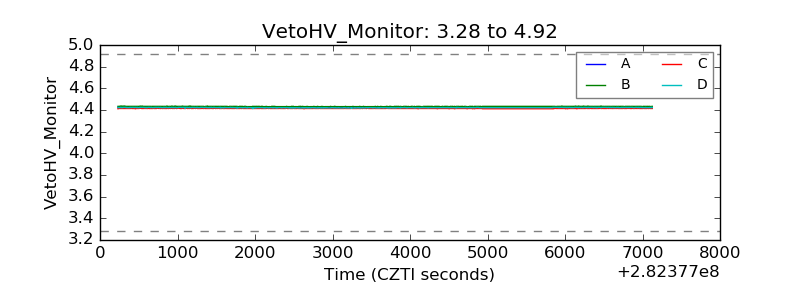 |
| Veto LLD | 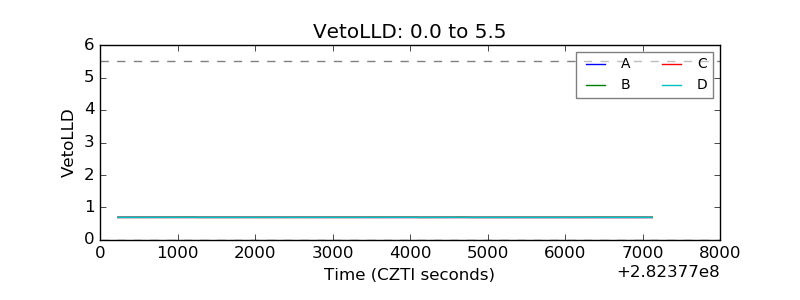 |
| Alpha Counter | 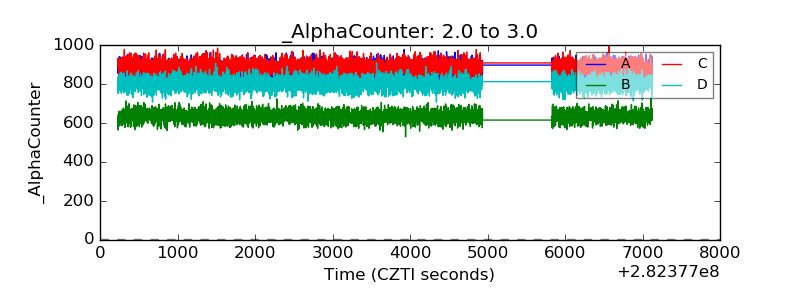 |
| _CPM_Rate | 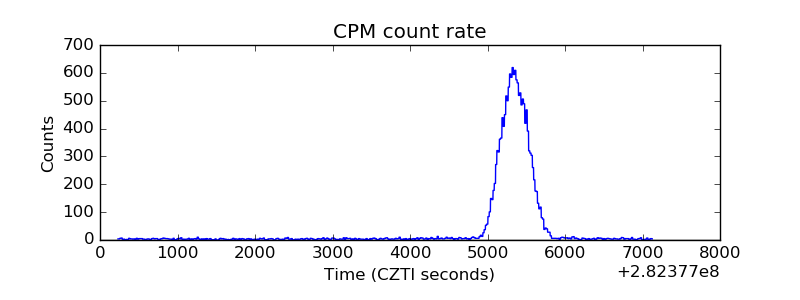 |
| CZT Counter | 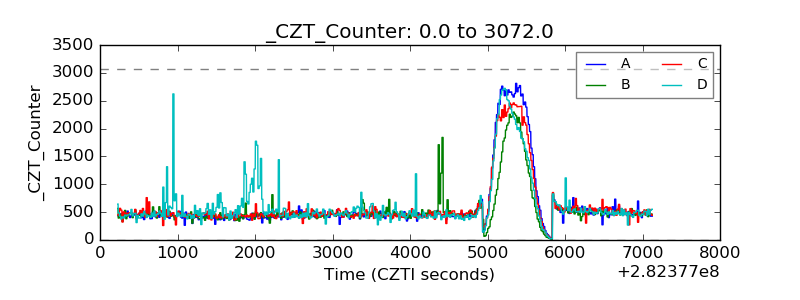 |
| +2.5 Volts monitor |  |
| +5 Volts monitor |  |
| _ROLL_ROT | 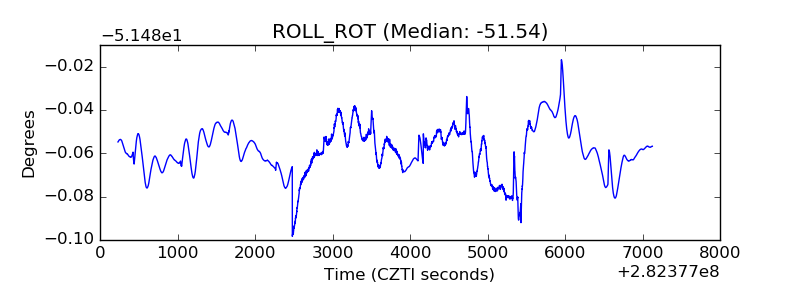 |
| _Roll_DEC | 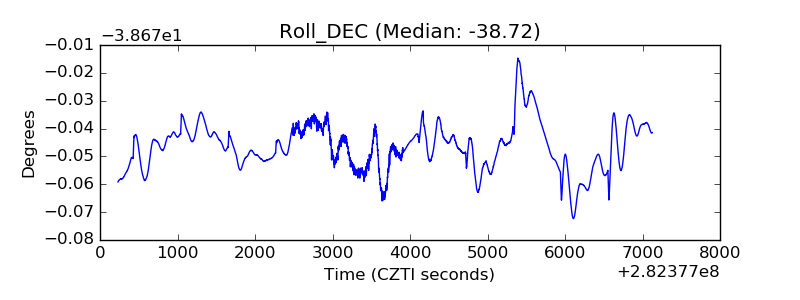 |
| _Roll_RA | 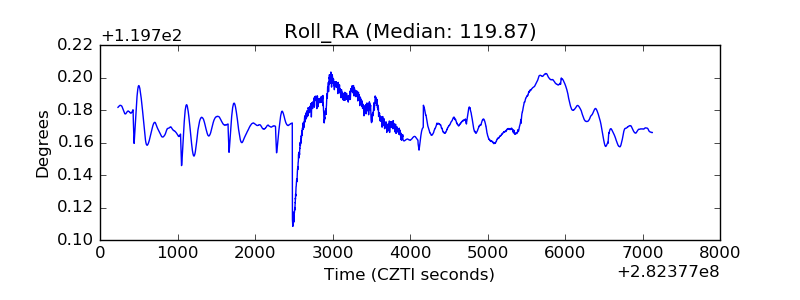 |
| Veto Counter | 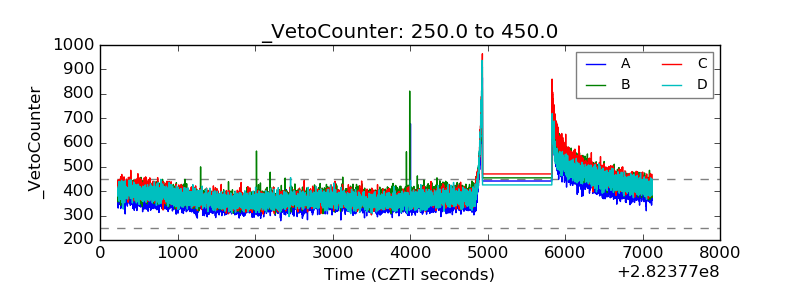 |