| Param | Original file | Final file |
|---|---|---|
| Filename | modeM0/AS1A05_165T12_9000002562_17350cztM0_level2.evt | modeM0/AS1A05_165T12_9000002562_17350cztM0_level2_quad_clean.evt |
| Size (bytes) | 455,549,760 | 79,565,760 |
| Size | 434.4 MB | 75.9 MB |
| Events in quadrant A | 3,112,069 | 497,998 |
| Events in quadrant B | 3,165,294 | 506,772 |
| Events in quadrant C | 3,262,245 | 479,927 |
| Events in quadrant D | 3,813,651 | 469,804 |
| Mode M9 | |||
|---|---|---|---|
| Quadrant | BADHDUFLAG | Total packets | Discarded packets |
| A | 0 | 12 | 0 |
| B | 0 | 13 | 0 |
| C | 0 | 13 | 0 |
| D | 0 | 13 | 0 |
| Mode M0 | |||
|---|---|---|---|
| Quadrant | BADHDUFLAG | Total packets | Discarded packets |
| A | 0 | 13503 | 2 |
| B | 0 | 13596 | 2 |
| C | 0 | 13761 | 2 |
| D | 0 | 15674 | 2 |
| Mode SS | |||
|---|---|---|---|
| Quadrant | BADHDUFLAG | Total packets | Discarded packets |
| A | 0 | 132 | 0 |
| B | 0 | 132 | 0 |
| C | 0 | 132 | 0 |
| D | 0 | 132 | 0 |
| Quadrant | Total seconds | Saturated seconds | Saturation percentage |
|---|---|---|---|
| A | 6522 | 52 | 0.797301% |
| B | 6522 | 57 | 0.873965% |
| C | 6522 | 85 | 1.303281% |
| D | 6522 | 164 | 2.514566% |
Noise dominated data is calculated using 1-second bins in cleaned event files. If a bin has >2000 counts, and if more than 50% of those come from <1% of pixels, then it is considered to be noise-dominated and hence unusable.
| Quadrant | # 1 sec bins | Bins with >0 counts | Bins with >2000 counts | High rate bins dominated by noise | Noise dominated (total time) | Noise dominated (detector-on time) | Marked lightcurve |
|---|---|---|---|---|---|---|---|
| A | 7567 | 6523 | 0 | 0 | 0.00% | 0.00% | 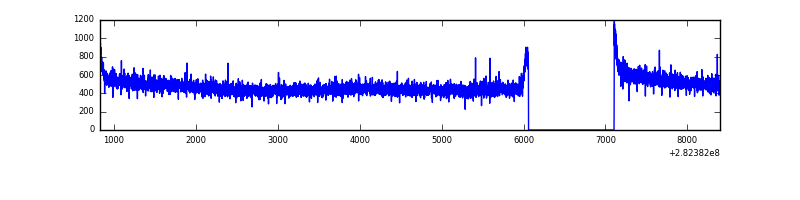 |
| B | 7567 | 6522 | 0 | 0 | 0.00% | 0.00% | 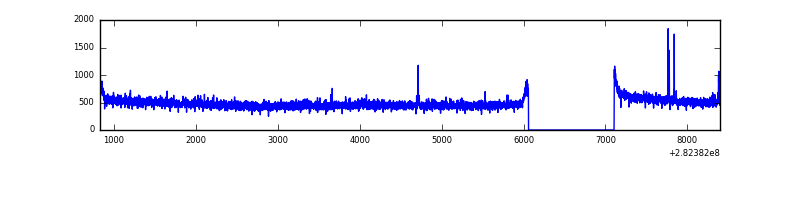 |
| C | 7567 | 6523 | 0 | 0 | 0.00% | 0.00% | 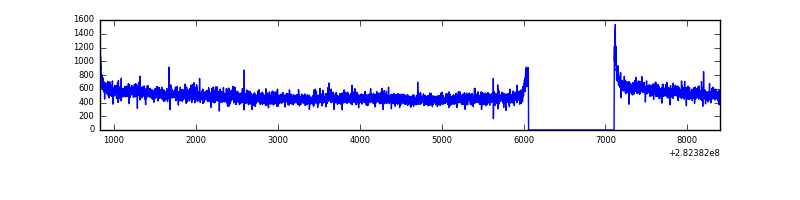 |
| D | 7567 | 6523 | 84 | 84 | 1.11% | 1.29% | 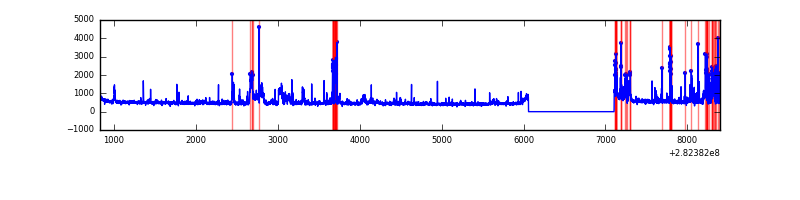 |
Top three noisy pixels from each quadrant. If the there are fewer than three noisy pixels in the level2.evt file, extra rows are filled as -1
| Pixel properties | Quadrant properties | ||||||
|---|---|---|---|---|---|---|---|
| Quadrant | DetID | PixID | Counts | Sigma | Mean | Median | Sigma |
| A | 0 | 226 | 7320 | 39.94 | 808 | 791 | 163.5 |
| A | 3 | 137 | 5922 | 31.39 | 808 | 791 | 163.5 |
| A | 12 | 194 | 5878 | 31.12 | 808 | 791 | 163.5 |
| B | 12 | 111 | 18349 | 113.8 | 803 | 783 | 154.4 |
| B | 11 | 111 | 16038 | 98.83 | 803 | 783 | 154.4 |
| B | 14 | 111 | 13990 | 85.56 | 803 | 783 | 154.4 |
| C | 14 | 238 | 120079 | 657.88 | 780 | 786 | 181.3 |
| C | 3 | 233 | 101543 | 555.66 | 780 | 786 | 181.3 |
| C | 13 | 61 | 5423 | 25.57 | 780 | 786 | 181.3 |
| D | 5 | 222 | 320144 | 1684.2 | 784 | 762 | 189.6 |
| D | 13 | 232 | 284372 | 1495.57 | 784 | 762 | 189.6 |
| D | 13 | 189 | 104078 | 544.82 | 784 | 762 | 189.6 |
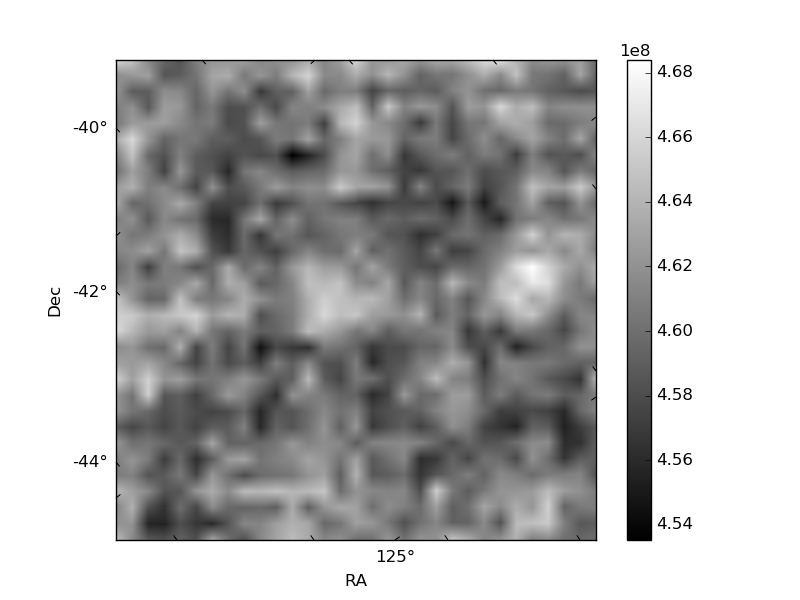
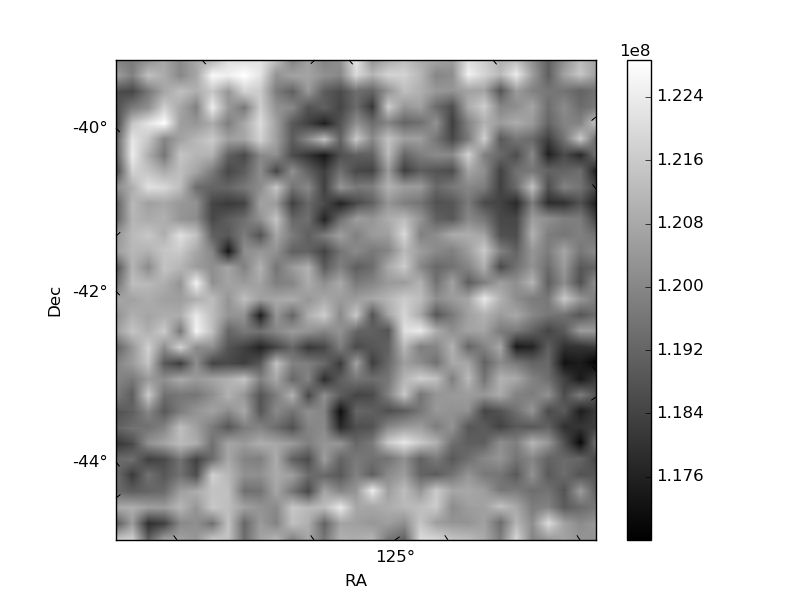
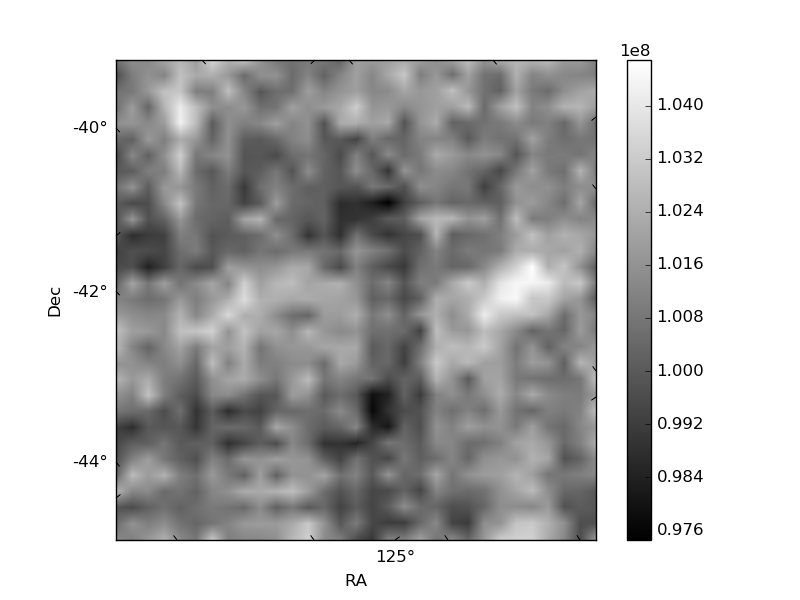
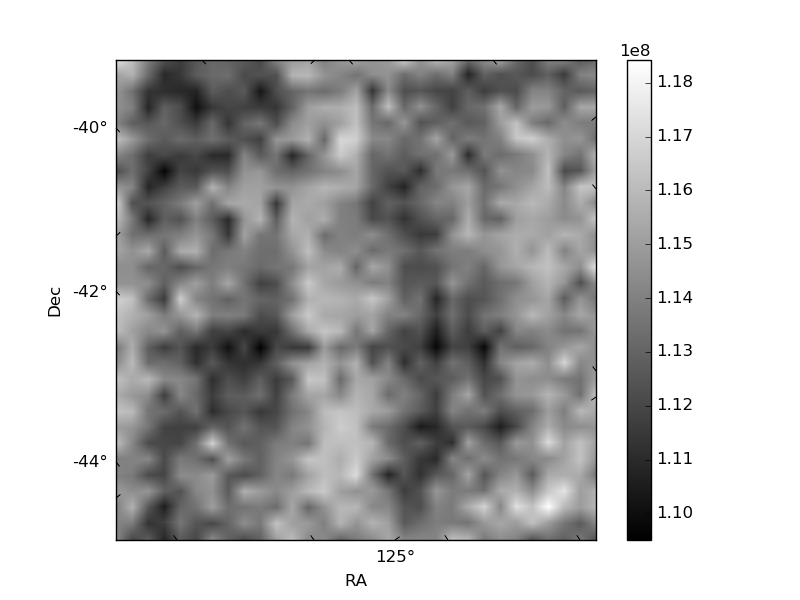
Histogram calculated using DETX and DETY for each event in the final _common_clean file
| Quadrant A | 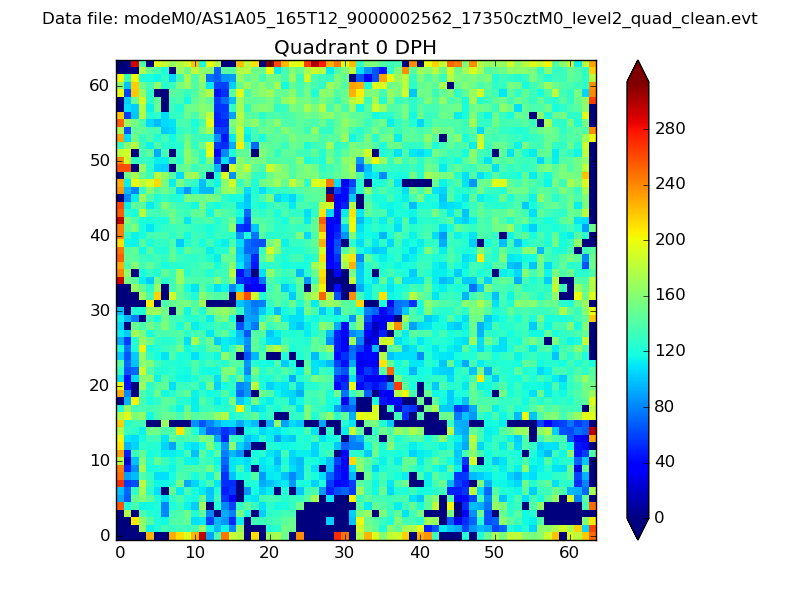 |
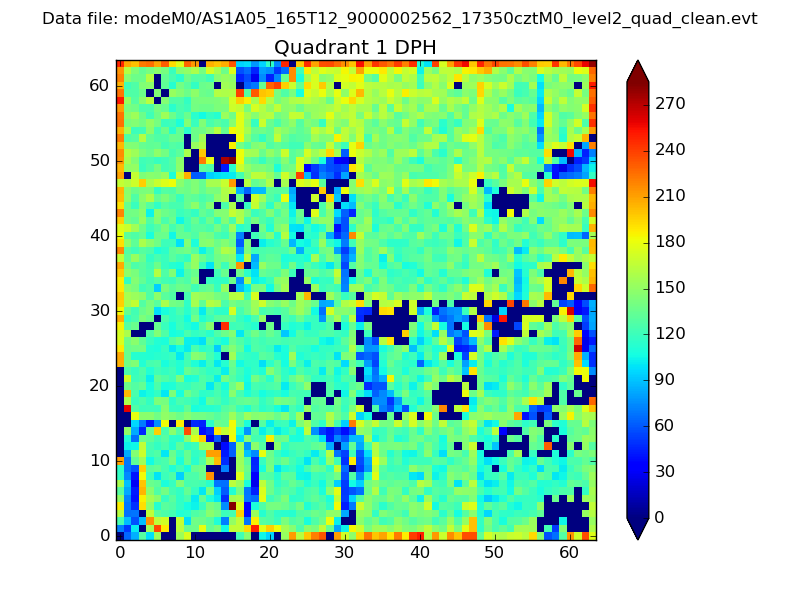 |
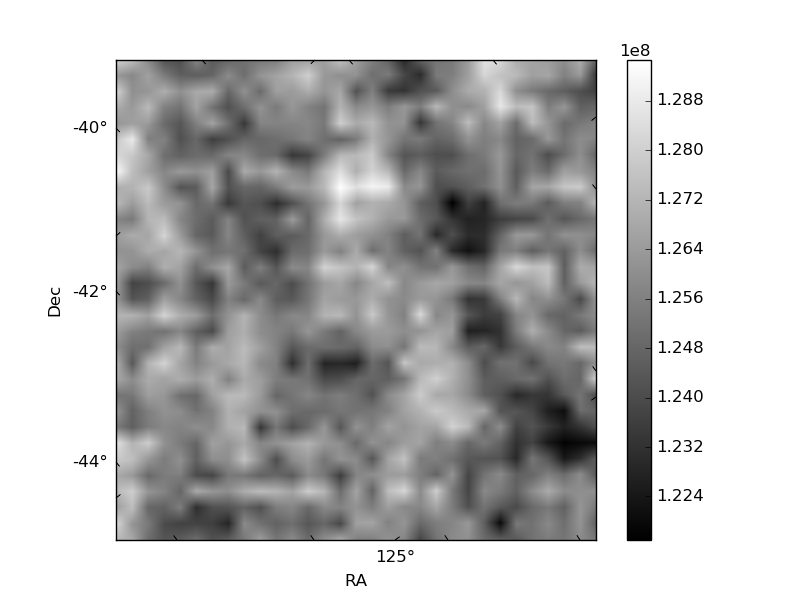
Quadrant B |
|---|---|---|---|
| Quadrant D | 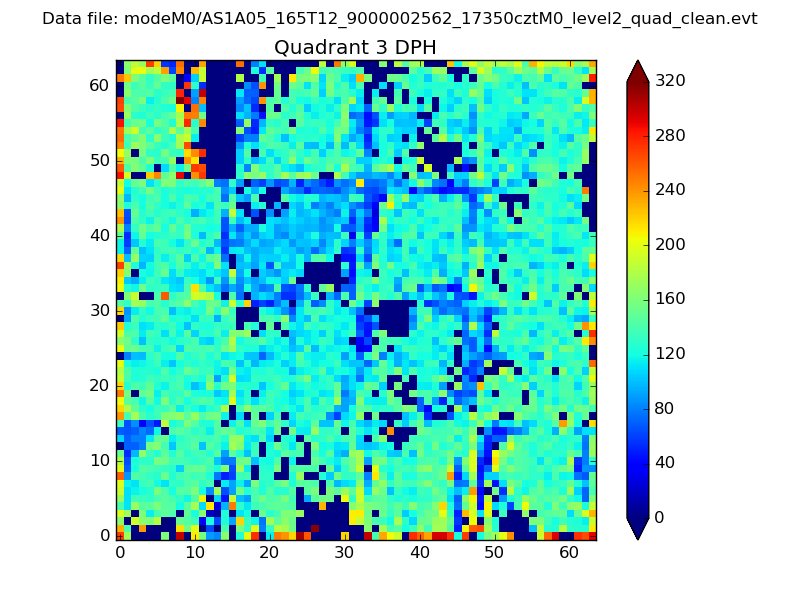 |
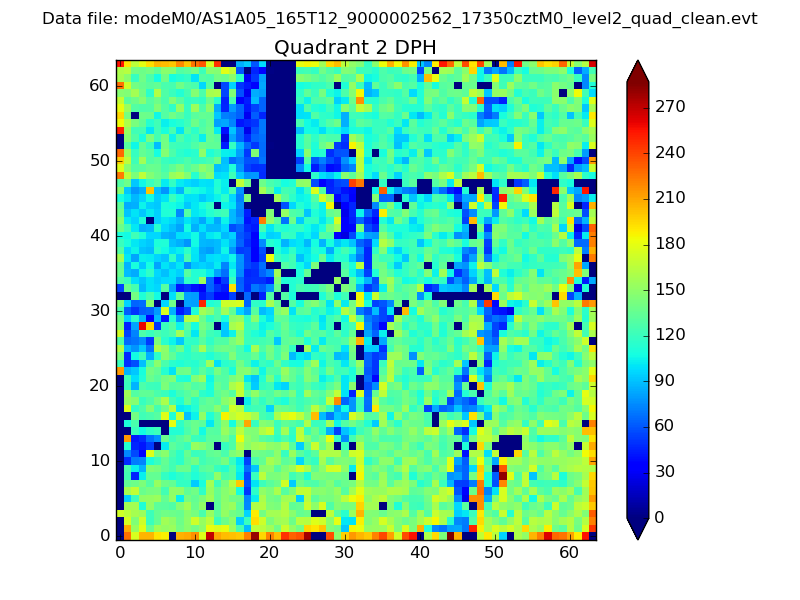 |
Quadrant C |
| Plot type | Count rate plots | Images |
|---|---|---|
| Comparison with Poisson distribution Blue bars denote a histogram of data divided into 1 sec bins. Red curve is a Poisson curve with rate = median count rate of data. |
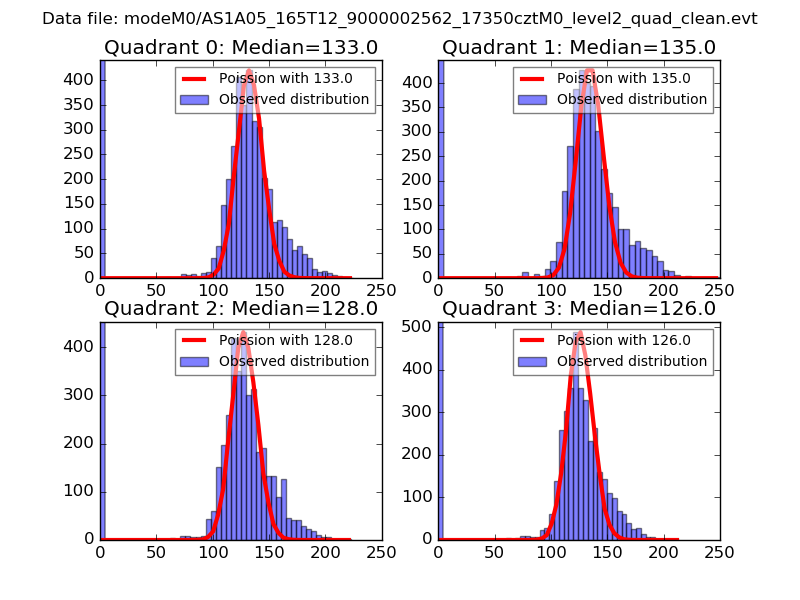 |
 |
| Quadrant-wise count rates Data is divided into 100 sec bins |
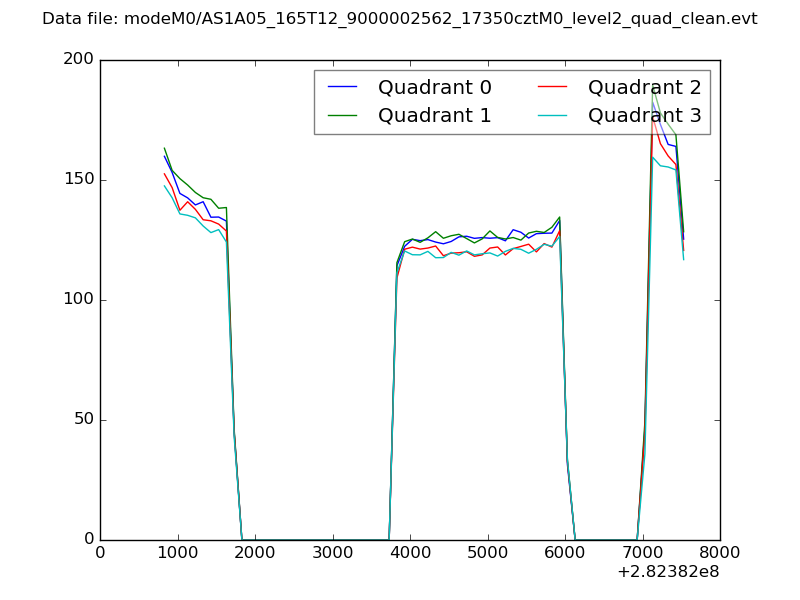 |
|
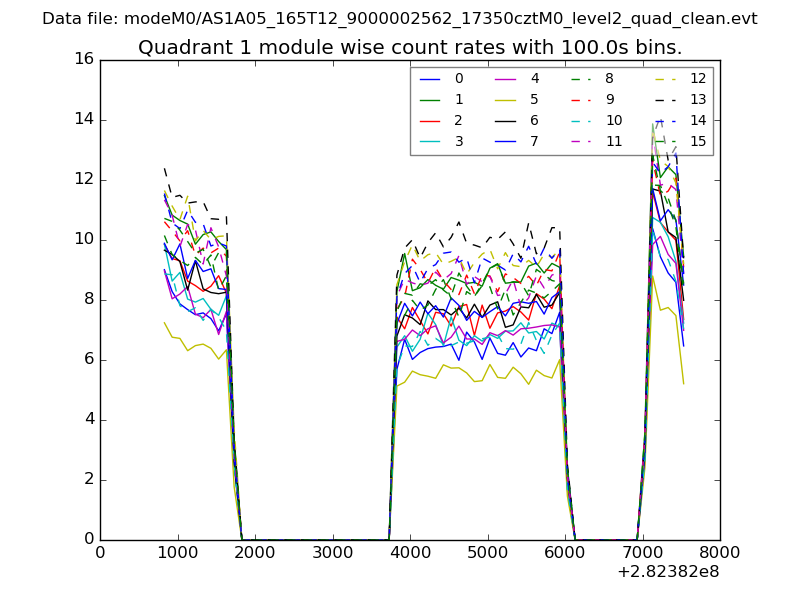
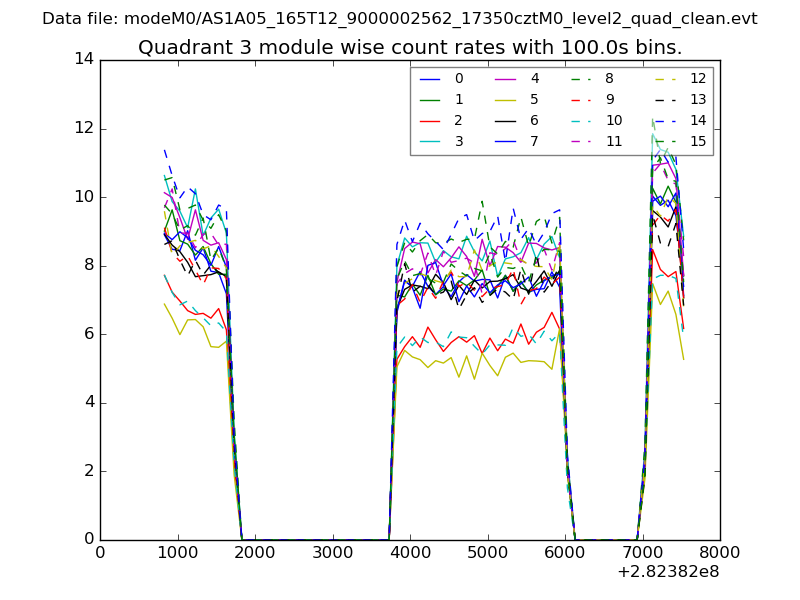
| Module-wise count rates for Quadrant A Data is divided into 100 sec bins |
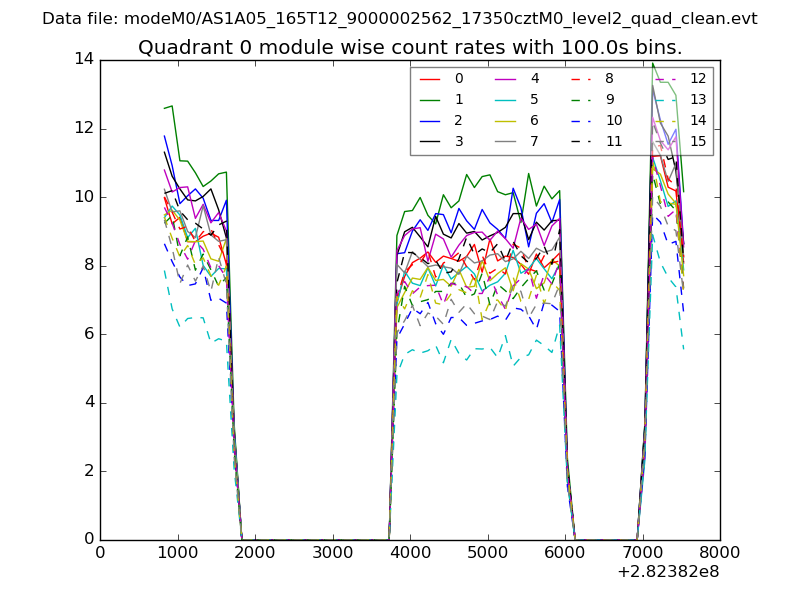 |
 |
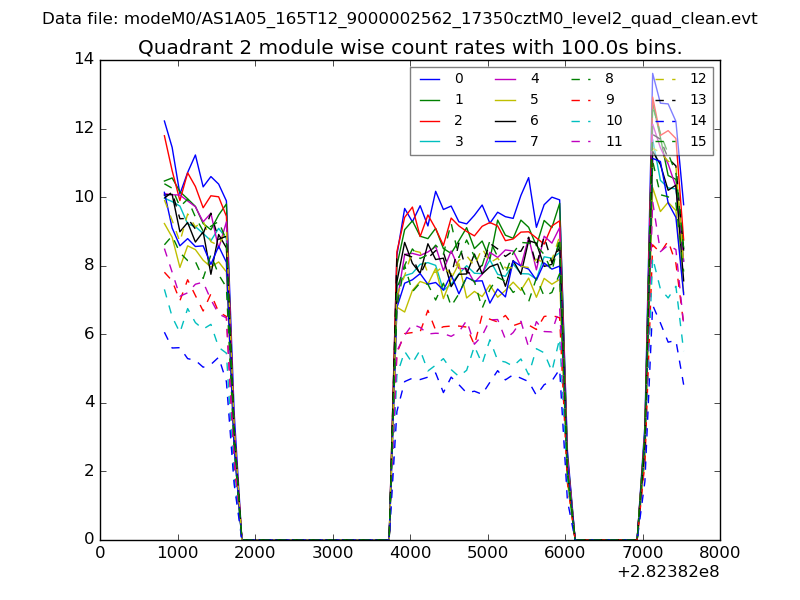
| Module-wise count rates for Quadrant B Data is divided into 100 sec bins |
 |
 |
| Module-wise count rates for Quadrant C Data is divided into 100 sec bins |
 |
 |
| Module-wise count rates for Quadrant D Data is divided into 100 sec bins |
 |
 |
| Parameter | Plot |
|---|---|
| CZT HV Monitor | 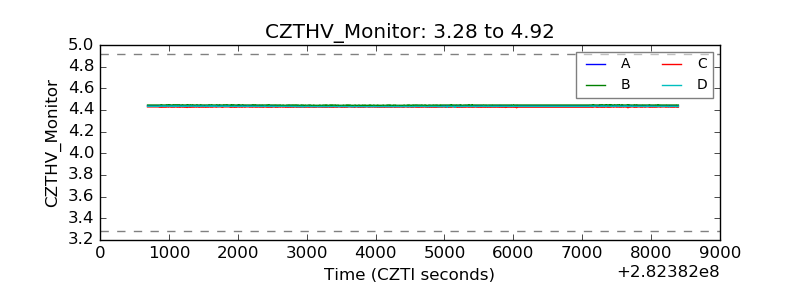 |
| D_VDD | 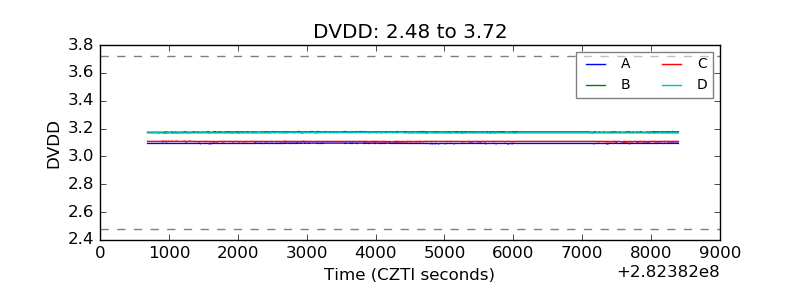 |
| Temperature 1 | 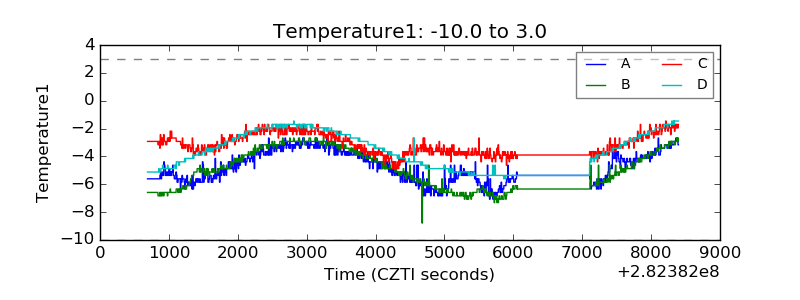 |
| Veto HV Monitor | 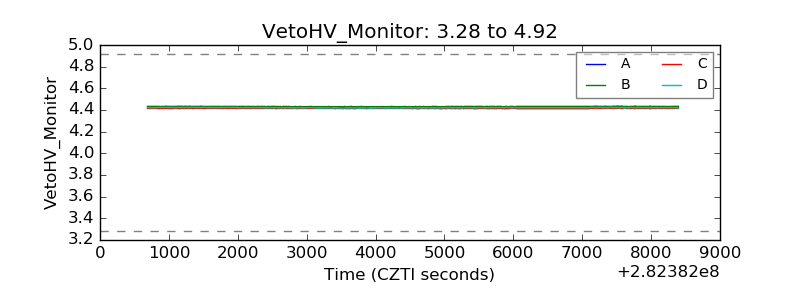 |
| Veto LLD | 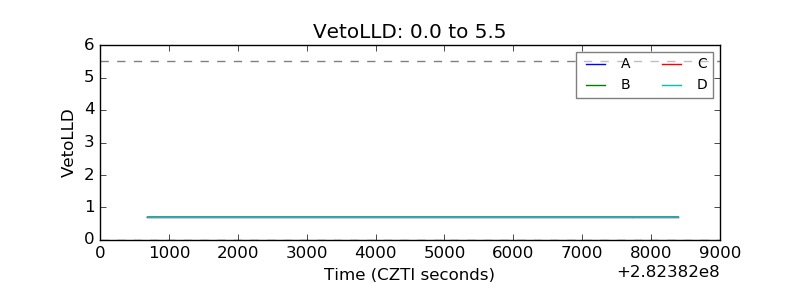 |
| Alpha Counter | 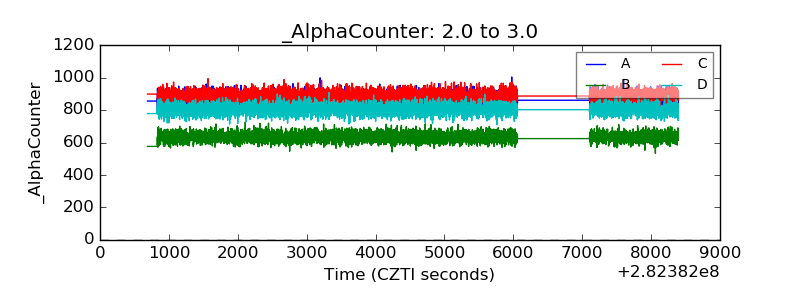 |
| _CPM_Rate | 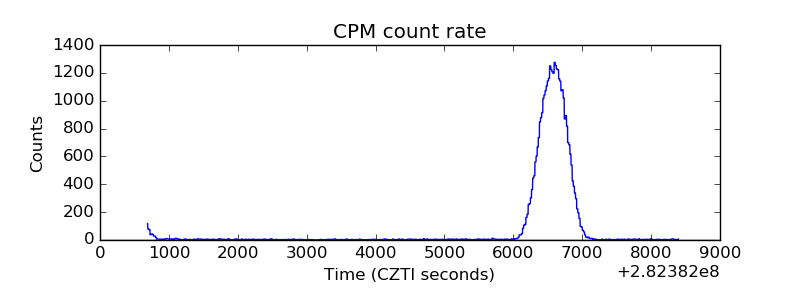 |
| CZT Counter | 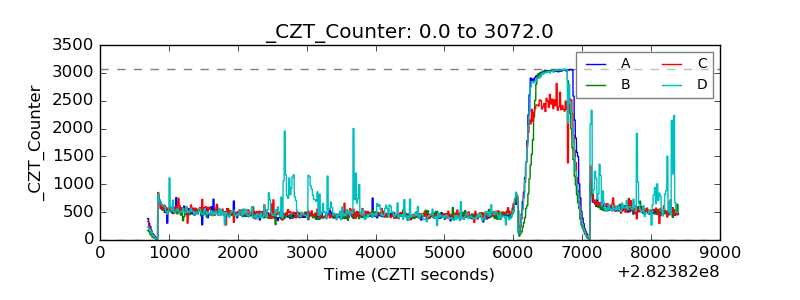 |
| +2.5 Volts monitor |  |
| +5 Volts monitor |  |
| _ROLL_ROT | 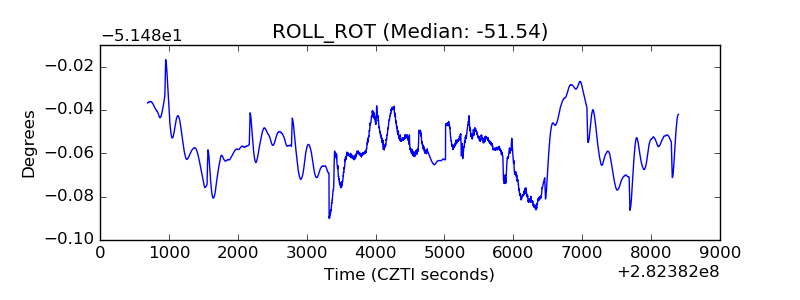 |
| _Roll_DEC | 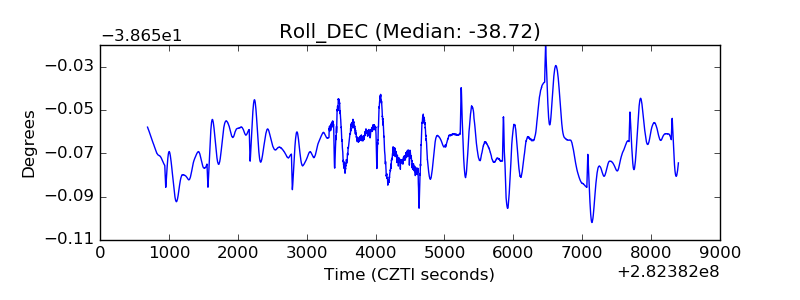 |
| _Roll_RA | 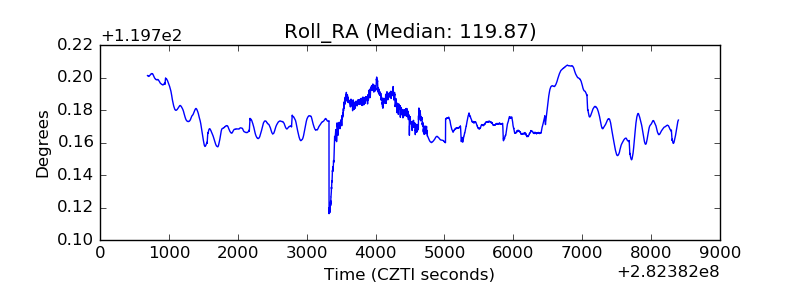 |
| Veto Counter | 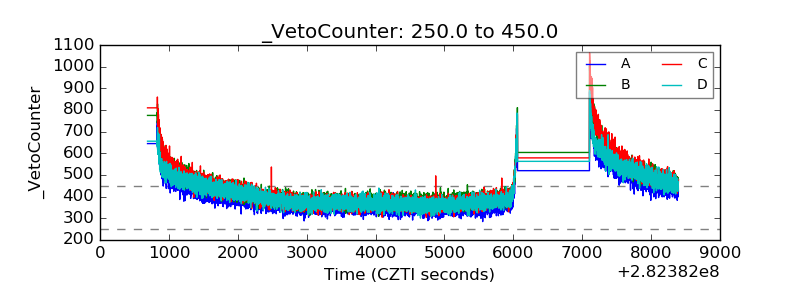 |