| Param | Original file | Final file |
|---|---|---|
| Filename | modeM0/AS1A05_165T12_9000002562_17352cztM0_level2.evt | modeM0/AS1A05_165T12_9000002562_17352cztM0_level2_quad_clean.evt |
| Size (bytes) | 488,744,640 | 70,888,320 |
| Size | 466.1 MB | 67.6 MB |
| Events in quadrant A | 3,277,426 | 432,493 |
| Events in quadrant B | 3,313,497 | 438,132 |
| Events in quadrant C | 3,327,997 | 418,062 |
| Events in quadrant D | 4,442,322 | 405,133 |
| Mode M9 | |||
|---|---|---|---|
| Quadrant | BADHDUFLAG | Total packets | Discarded packets |
| A | 0 | 11 | 0 |
| B | 0 | 12 | 0 |
| C | 0 | 12 | 0 |
| D | 0 | 12 | 0 |
| Mode M0 | |||
|---|---|---|---|
| Quadrant | BADHDUFLAG | Total packets | Discarded packets |
| A | 0 | 13947 | 2 |
| B | 0 | 14046 | 3 |
| C | 0 | 14102 | 2 |
| D | 0 | 17491 | 2 |
| Mode SS | |||
|---|---|---|---|
| Quadrant | BADHDUFLAG | Total packets | Discarded packets |
| A | 0 | 132 | 0 |
| B | 0 | 132 | 0 |
| C | 0 | 132 | 0 |
| D | 0 | 132 | 0 |
| Quadrant | Total seconds | Saturated seconds | Saturation percentage |
|---|---|---|---|
| A | 6487 | 85 | 1.310313% |
| B | 6486 | 93 | 1.433858% |
| C | 6486 | 114 | 1.757632% |
| D | 6486 | 301 | 4.640765% |
Noise dominated data is calculated using 1-second bins in cleaned event files. If a bin has >2000 counts, and if more than 50% of those come from <1% of pixels, then it is considered to be noise-dominated and hence unusable.
| Quadrant | # 1 sec bins | Bins with >0 counts | Bins with >2000 counts | High rate bins dominated by noise | Noise dominated (total time) | Noise dominated (detector-on time) | Marked lightcurve |
|---|---|---|---|---|---|---|---|
| A | 7637 | 6487 | 0 | 0 | 0.00% | 0.00% | 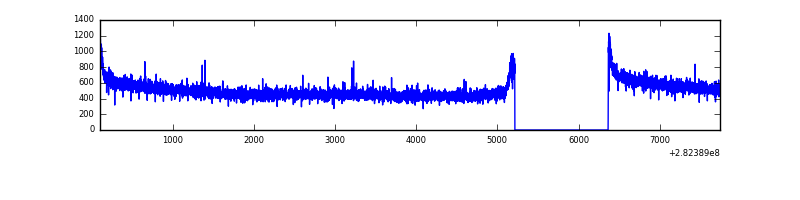 |
| B | 7636 | 6486 | 1 | 1 | 0.01% | 0.02% | 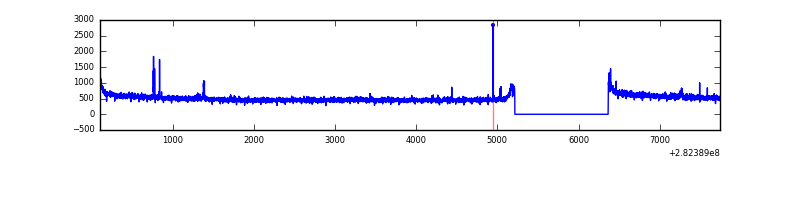 |
| C | 7636 | 6487 | 0 | 0 | 0.00% | 0.00% | 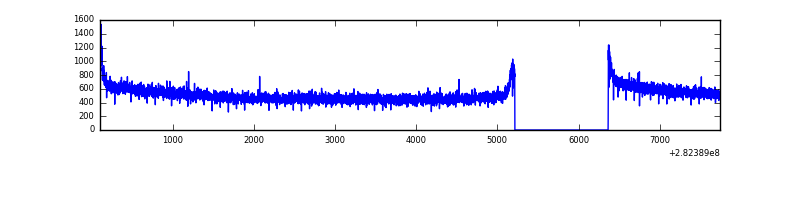 |
| D | 7636 | 6487 | 185 | 185 | 2.42% | 2.85% | 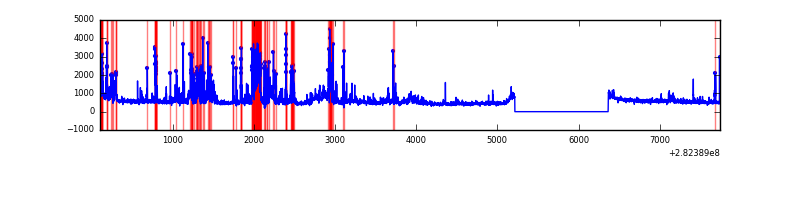 |
Top three noisy pixels from each quadrant. If the there are fewer than three noisy pixels in the level2.evt file, extra rows are filled as -1
| Pixel properties | Quadrant properties | ||||||
|---|---|---|---|---|---|---|---|
| Quadrant | DetID | PixID | Counts | Sigma | Mean | Median | Sigma |
| A | 0 | 23 | 8761 | 46.69 | 849 | 833 | 169.8 |
| A | 0 | 226 | 7845 | 41.29 | 849 | 833 | 169.8 |
| A | 12 | 194 | 6176 | 31.46 | 849 | 833 | 169.8 |
| B | 0 | 229 | 18521 | 111.33 | 840 | 820 | 159.0 |
| B | 12 | 111 | 18384 | 110.47 | 840 | 820 | 159.0 |
| B | 11 | 111 | 16331 | 97.56 | 840 | 820 | 159.0 |
| C | 14 | 238 | 125920 | 666.16 | 813 | 820 | 187.8 |
| C | 3 | 233 | 33608 | 174.6 | 813 | 820 | 187.8 |
| C | 13 | 61 | 5794 | 26.49 | 813 | 820 | 187.8 |
| D | 13 | 232 | 718233 | 3662.38 | 812 | 790 | 195.9 |
| D | 5 | 222 | 418273 | 2131.15 | 812 | 790 | 195.9 |
| D | 13 | 189 | 102340 | 518.39 | 812 | 790 | 195.9 |
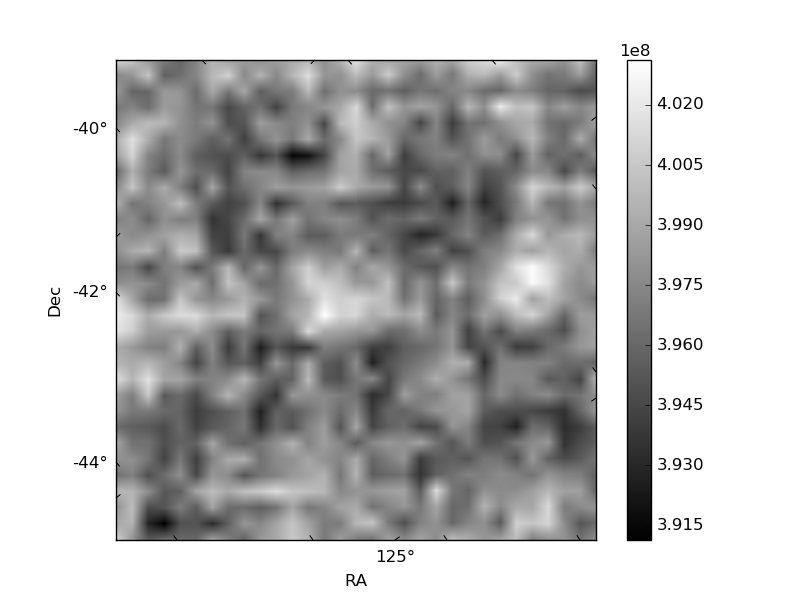
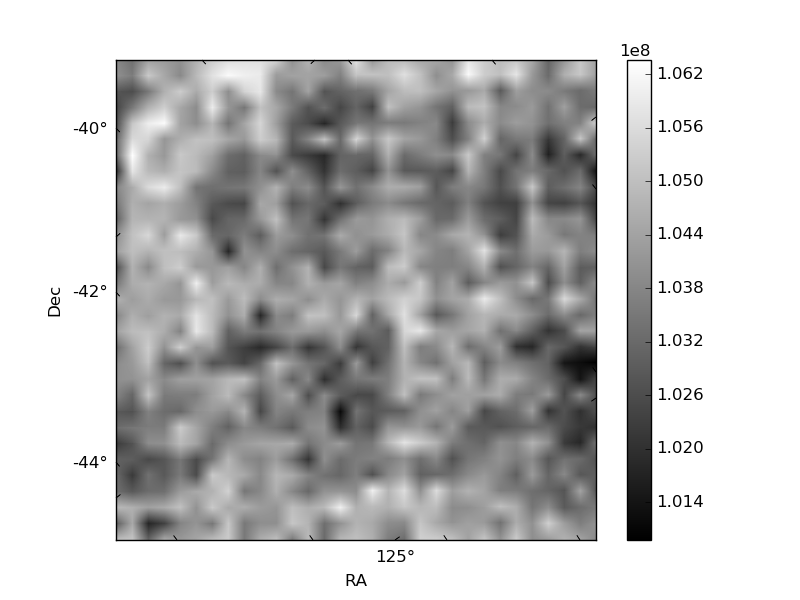
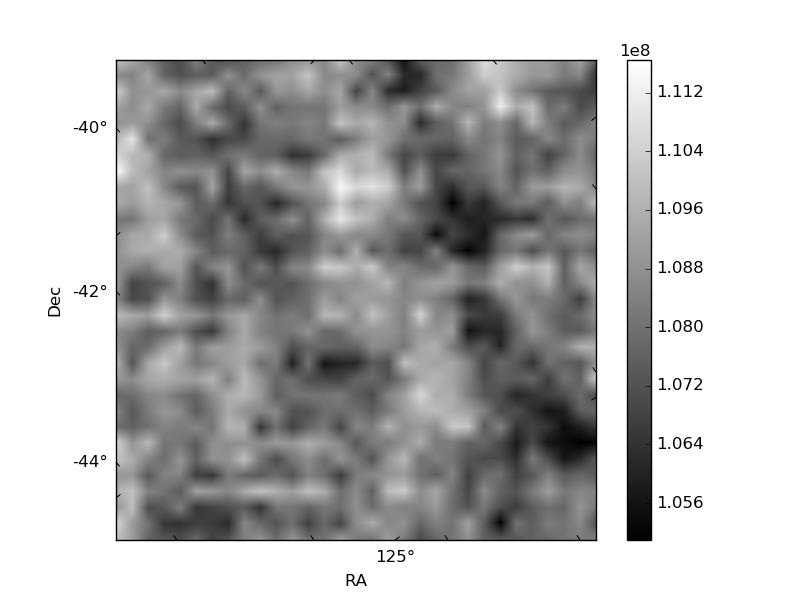
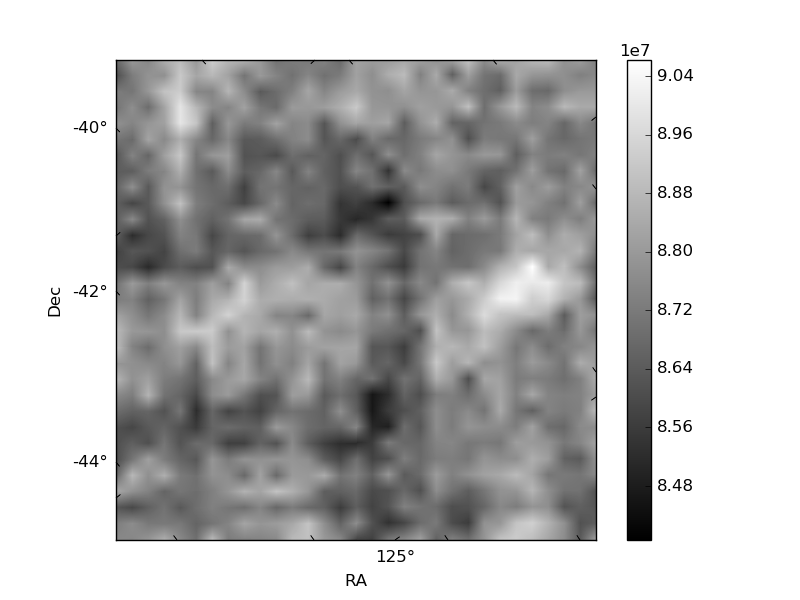
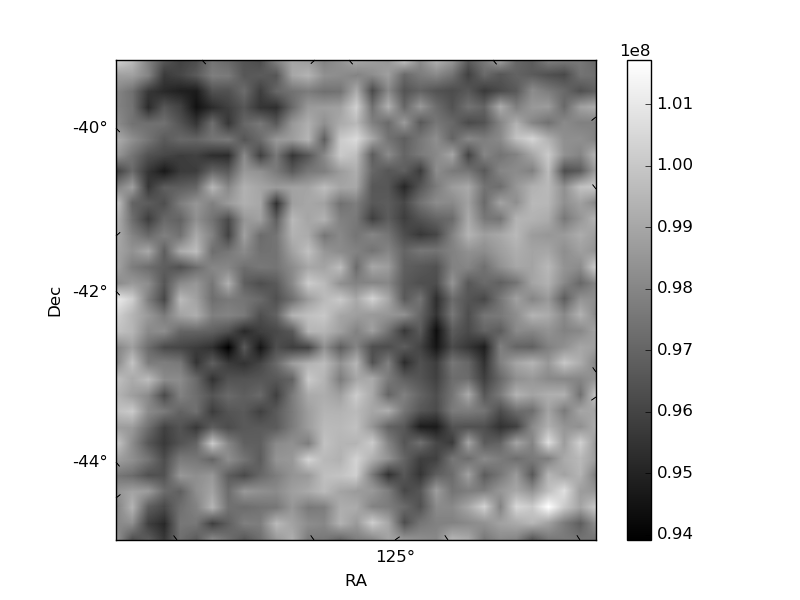
Histogram calculated using DETX and DETY for each event in the final _common_clean file
| Quadrant A | 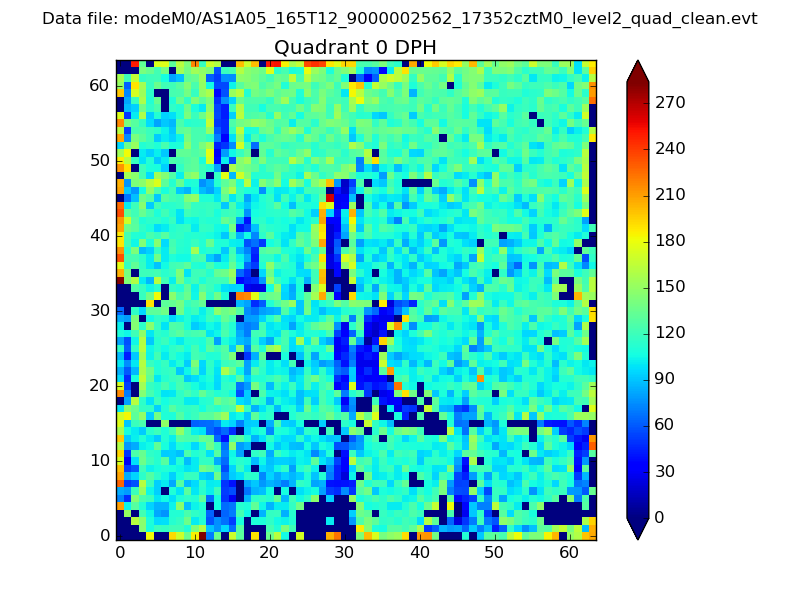 |
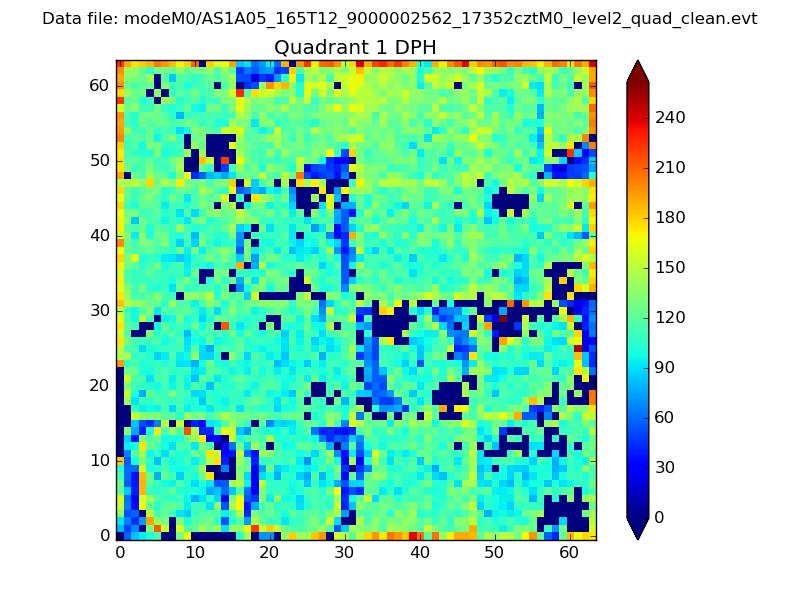 |
Quadrant B |
|---|---|---|---|
| Quadrant D | 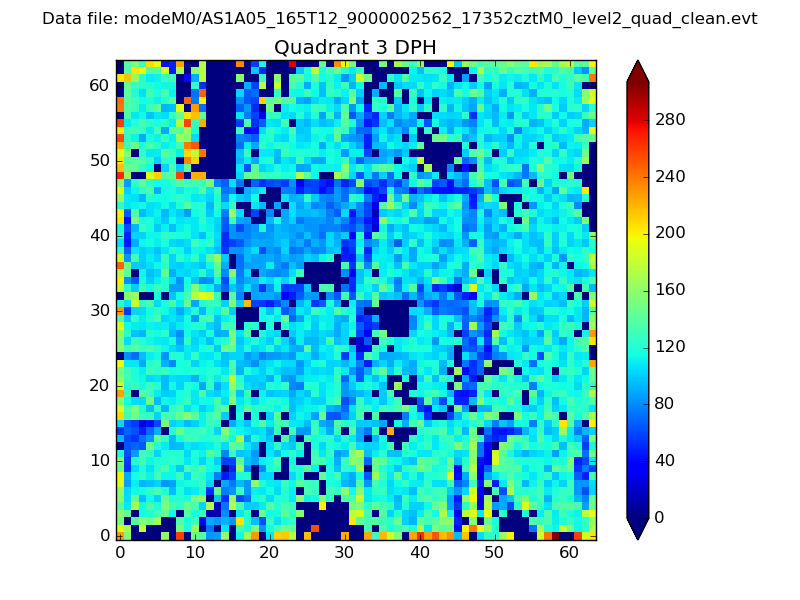 |
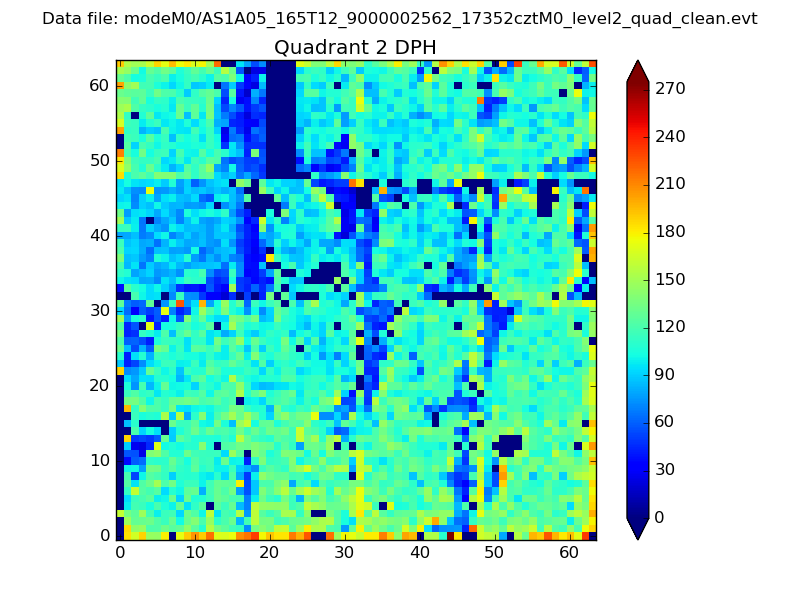 |
Quadrant C |
| Plot type | Count rate plots | Images |
|---|---|---|
| Comparison with Poisson distribution Blue bars denote a histogram of data divided into 1 sec bins. Red curve is a Poisson curve with rate = median count rate of data. |
 |
 |
| Quadrant-wise count rates Data is divided into 100 sec bins |
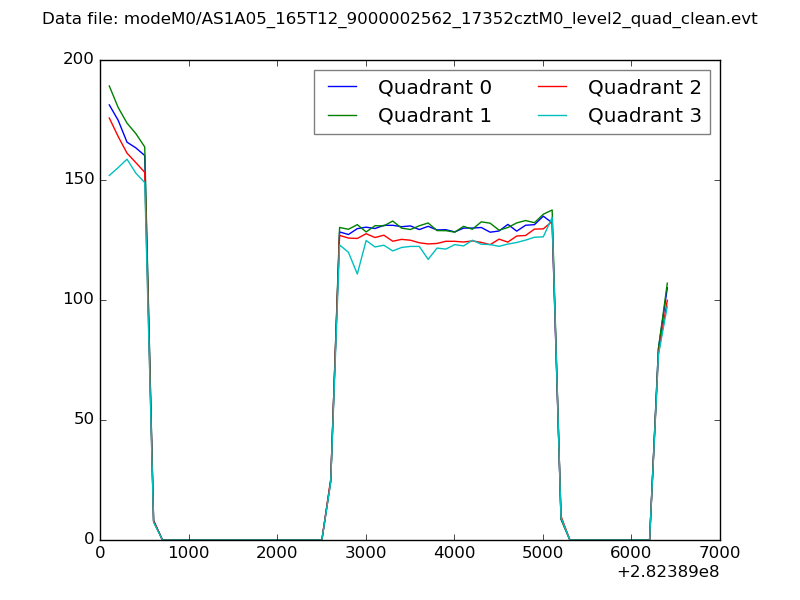 |
|
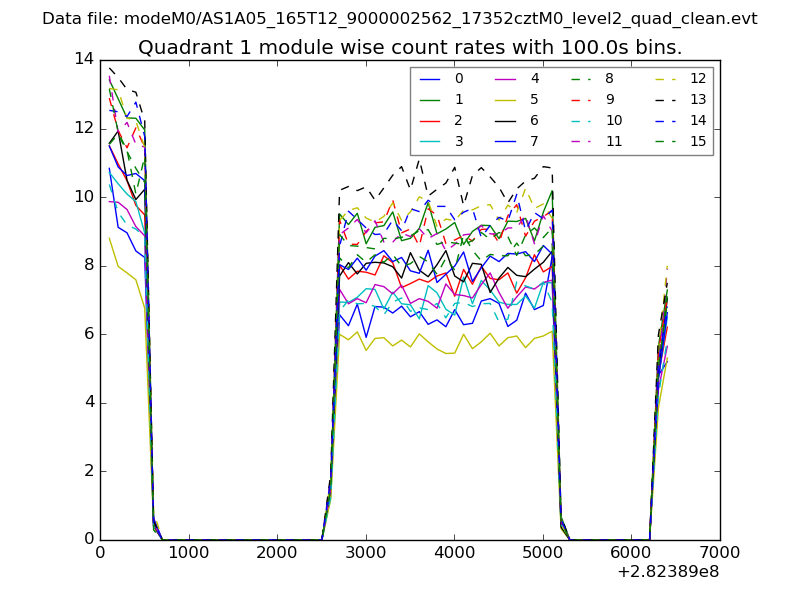
| Module-wise count rates for Quadrant A Data is divided into 100 sec bins |
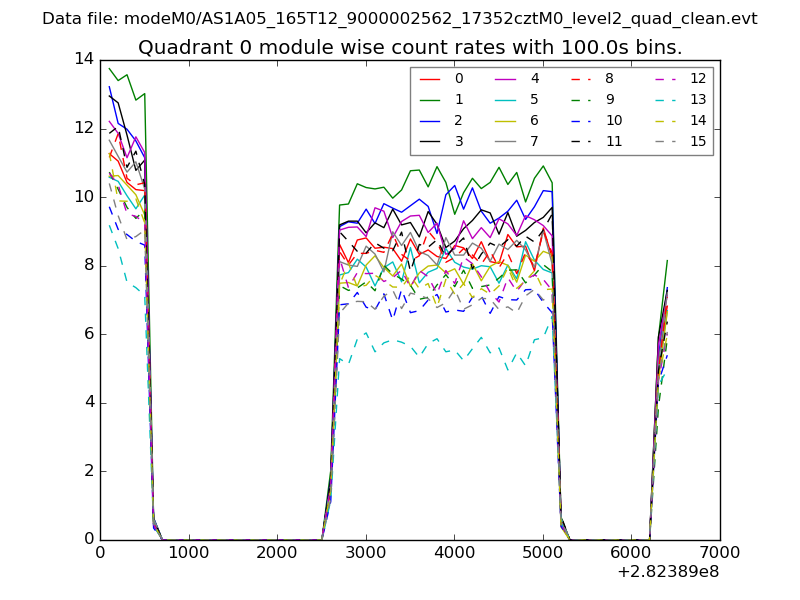 |
 |
| Module-wise count rates for Quadrant B Data is divided into 100 sec bins |
 |
 |
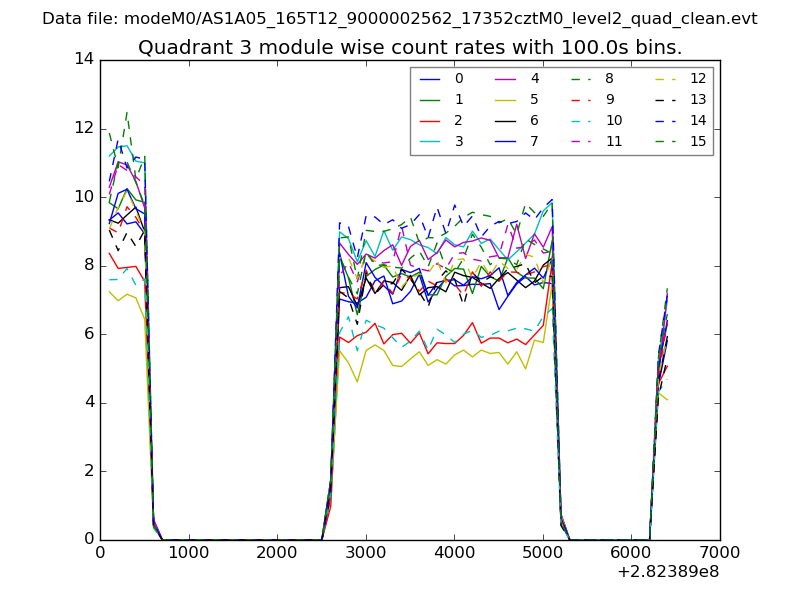
| Module-wise count rates for Quadrant C Data is divided into 100 sec bins |
 |
 |
| Module-wise count rates for Quadrant D Data is divided into 100 sec bins |
 |
 |
| Parameter | Plot |
|---|---|
| CZT HV Monitor |  |
| D_VDD | 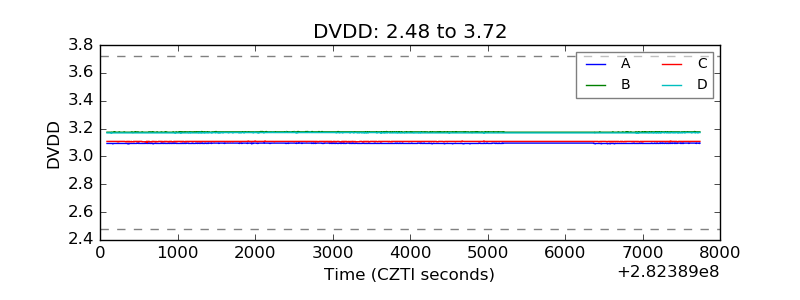 |
| Temperature 1 | 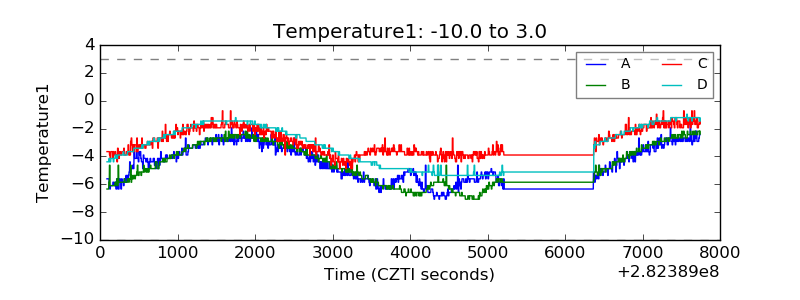 |
| Veto HV Monitor | 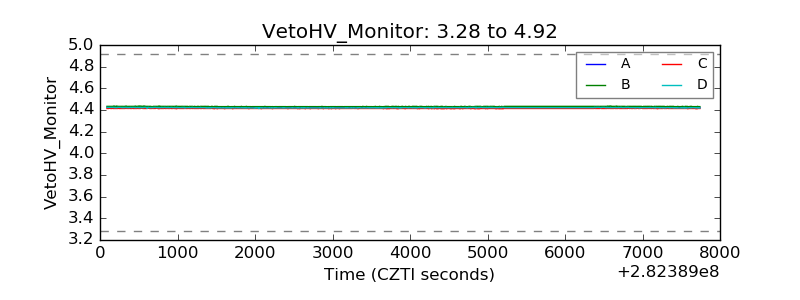 |
| Veto LLD | 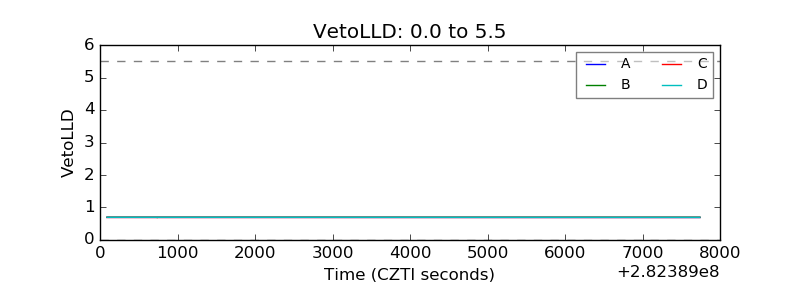 |
| Alpha Counter | 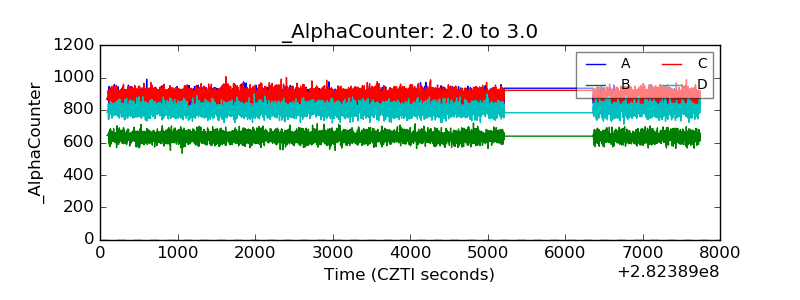 |
| _CPM_Rate | 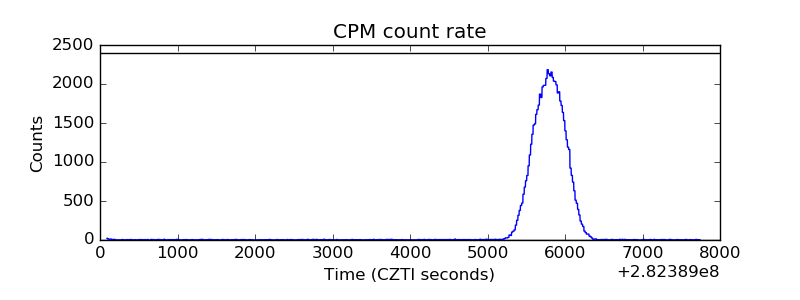 |
| CZT Counter | 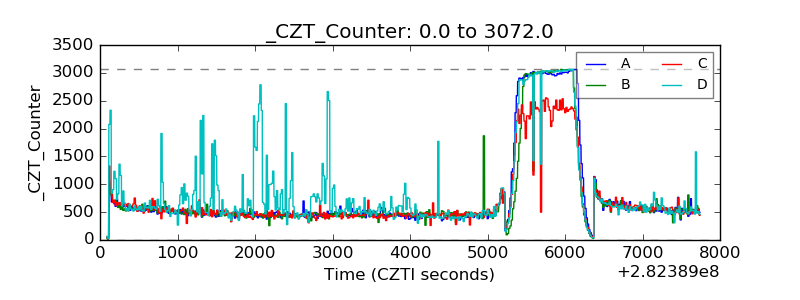 |
| +2.5 Volts monitor |  |
| +5 Volts monitor |  |
| _ROLL_ROT | 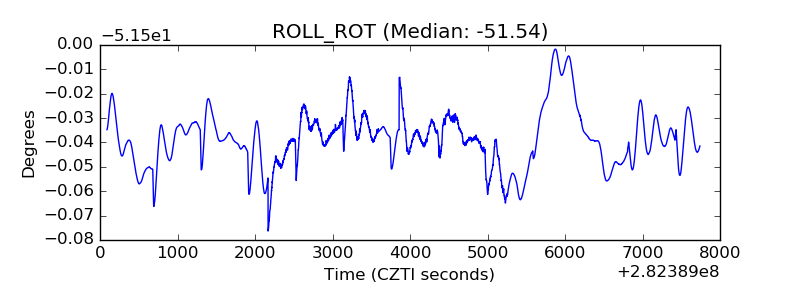 |
| _Roll_DEC | 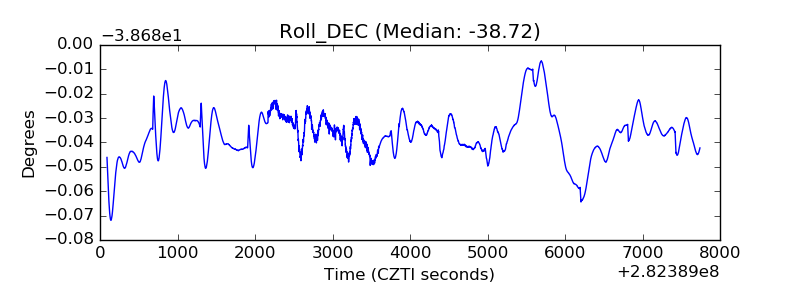 |
| _Roll_RA | 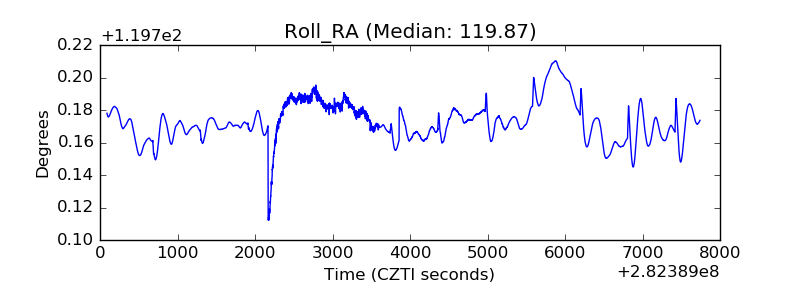 |
| Veto Counter | 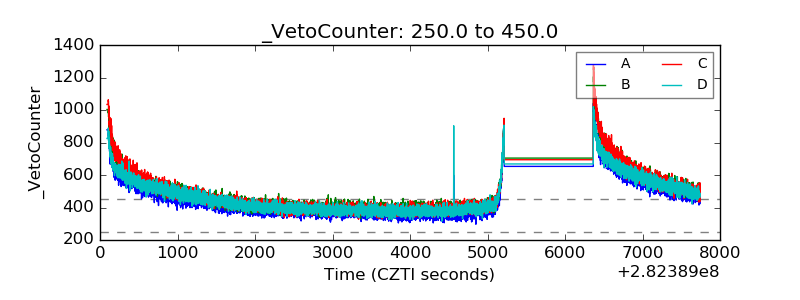 |