| Param | Original file | Final file |
|---|---|---|
| Filename | modeM0/AS1A05_165T12_9000002562_17353cztM0_level2.evt | modeM0/AS1A05_165T12_9000002562_17353cztM0_level2_quad_clean.evt |
| Size (bytes) | 495,201,600 | 68,172,480 |
| Size | 472.3 MB | 65.0 MB |
| Events in quadrant A | 3,500,747 | 410,984 |
| Events in quadrant B | 3,600,015 | 412,993 |
| Events in quadrant C | 3,511,120 | 391,845 |
| Events in quadrant D | 3,935,437 | 386,142 |
| Mode M9 | |||
|---|---|---|---|
| Quadrant | BADHDUFLAG | Total packets | Discarded packets |
| A | 0 | 20 | 0 |
| B | 0 | 21 | 0 |
| C | 0 | 21 | 0 |
| D | 0 | 21 | 0 |
| Mode M0 | |||
|---|---|---|---|
| Quadrant | BADHDUFLAG | Total packets | Discarded packets |
| A | 0 | 14664 | 2 |
| B | 0 | 14967 | 2 |
| C | 0 | 14722 | 2 |
| D | 0 | 16123 | 2 |
| Mode SS | |||
|---|---|---|---|
| Quadrant | BADHDUFLAG | Total packets | Discarded packets |
| A | 0 | 136 | 0 |
| B | 0 | 136 | 0 |
| C | 0 | 136 | 0 |
| D | 0 | 136 | 0 |
| Quadrant | Total seconds | Saturated seconds | Saturation percentage |
|---|---|---|---|
| A | 6622 | 105 | 1.585624% |
| B | 6622 | 118 | 1.781939% |
| C | 6622 | 141 | 2.129266% |
| D | 6622 | 174 | 2.627605% |
Noise dominated data is calculated using 1-second bins in cleaned event files. If a bin has >2000 counts, and if more than 50% of those come from <1% of pixels, then it is considered to be noise-dominated and hence unusable.
| Quadrant | # 1 sec bins | Bins with >0 counts | Bins with >2000 counts | High rate bins dominated by noise | Noise dominated (total time) | Noise dominated (detector-on time) | Marked lightcurve |
|---|---|---|---|---|---|---|---|
| A | 7877 | 6622 | 0 | 0 | 0.00% | 0.00% |  |
| B | 7877 | 6622 | 1 | 1 | 0.01% | 0.02% |  |
| C | 7877 | 6622 | 0 | 0 | 0.00% | 0.00% | 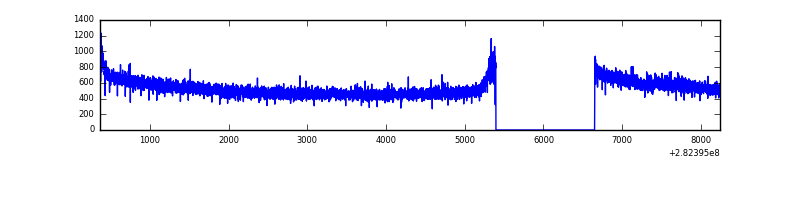 |
| D | 7877 | 6622 | 62 | 62 | 0.79% | 0.94% |  |
Top three noisy pixels from each quadrant. If the there are fewer than three noisy pixels in the level2.evt file, extra rows are filled as -1
| Pixel properties | Quadrant properties | ||||||
|---|---|---|---|---|---|---|---|
| Quadrant | DetID | PixID | Counts | Sigma | Mean | Median | Sigma |
| A | 0 | 226 | 8024 | 39.51 | 910 | 894 | 180.5 |
| A | 12 | 194 | 6580 | 31.51 | 910 | 894 | 180.5 |
| A | 3 | 137 | 6264 | 29.76 | 910 | 894 | 180.5 |
| B | 4 | 216 | 72191 | 425.32 | 898 | 878 | 167.7 |
| B | 12 | 111 | 18948 | 107.77 | 898 | 878 | 167.7 |
| B | 11 | 111 | 16707 | 94.41 | 898 | 878 | 167.7 |
| C | 14 | 238 | 135699 | 686.64 | 858 | 864 | 196.4 |
| C | 3 | 233 | 30679 | 151.83 | 858 | 864 | 196.4 |
| C | 13 | 61 | 6107 | 26.7 | 858 | 864 | 196.4 |
| D | 13 | 189 | 265359 | 1260.6 | 871 | 849 | 209.8 |
| D | 13 | 232 | 204474 | 970.43 | 871 | 849 | 209.8 |
| D | 10 | 70 | 94634 | 446.96 | 871 | 849 | 209.8 |
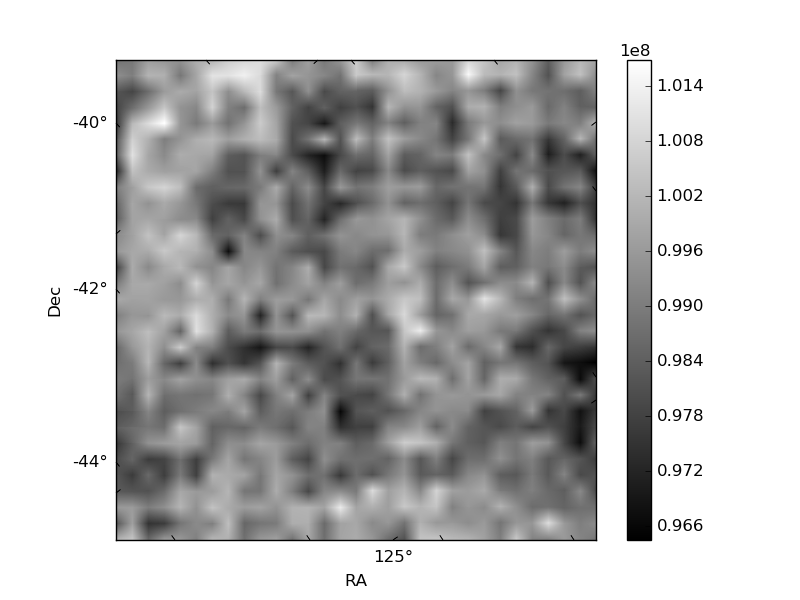
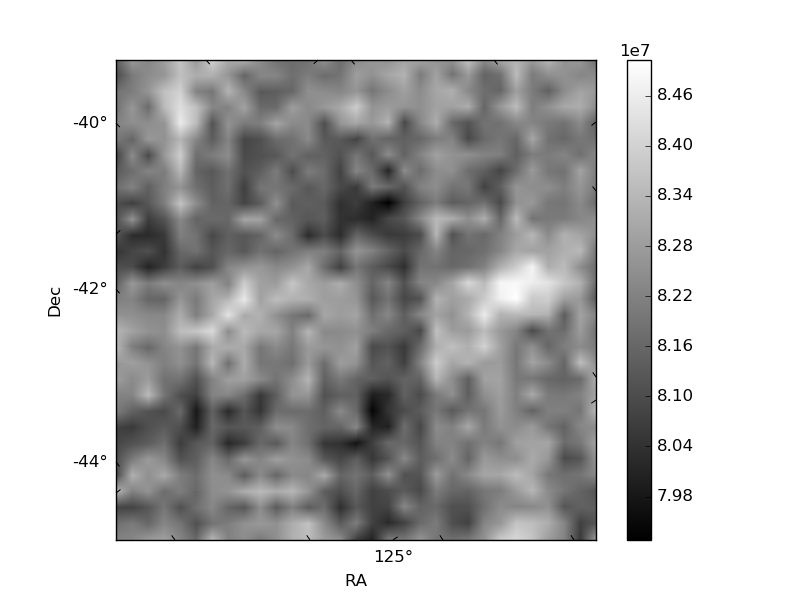
Histogram calculated using DETX and DETY for each event in the final _common_clean file
| Quadrant A | 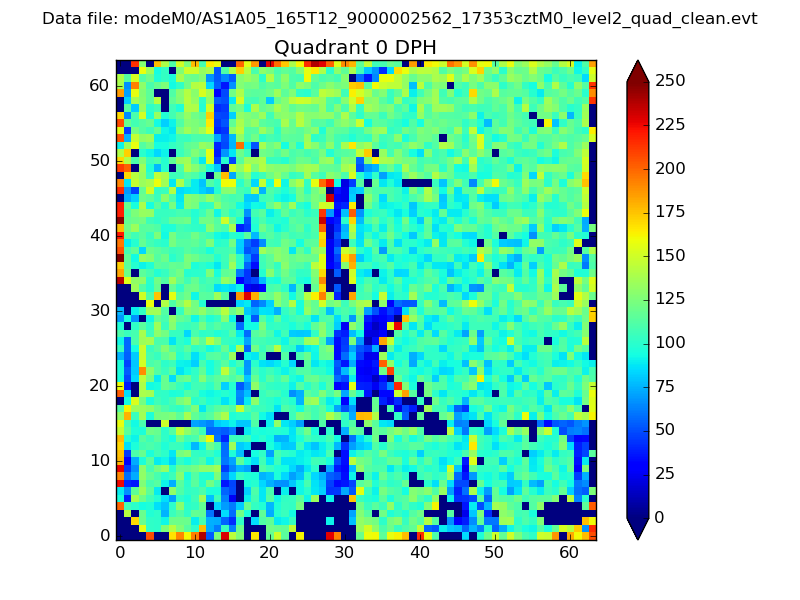 |
 |
Quadrant B |
|---|---|---|---|
| Quadrant D | 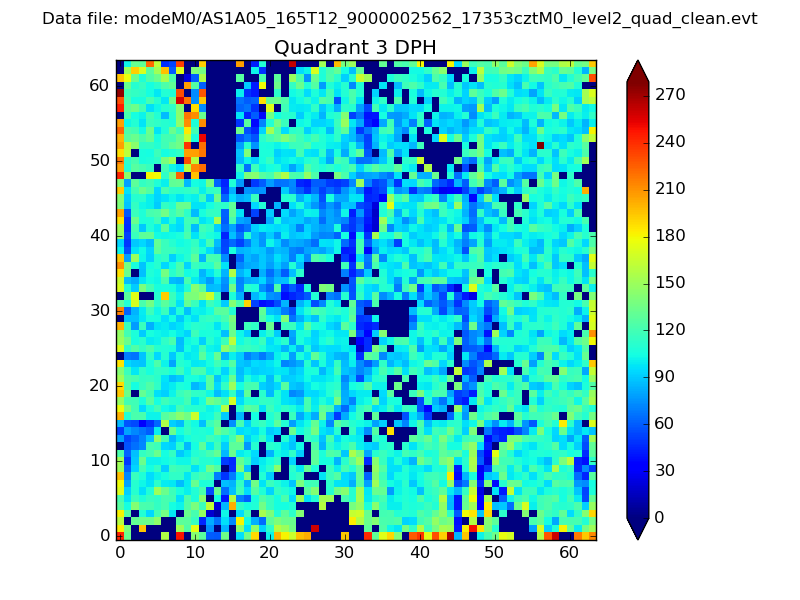 |
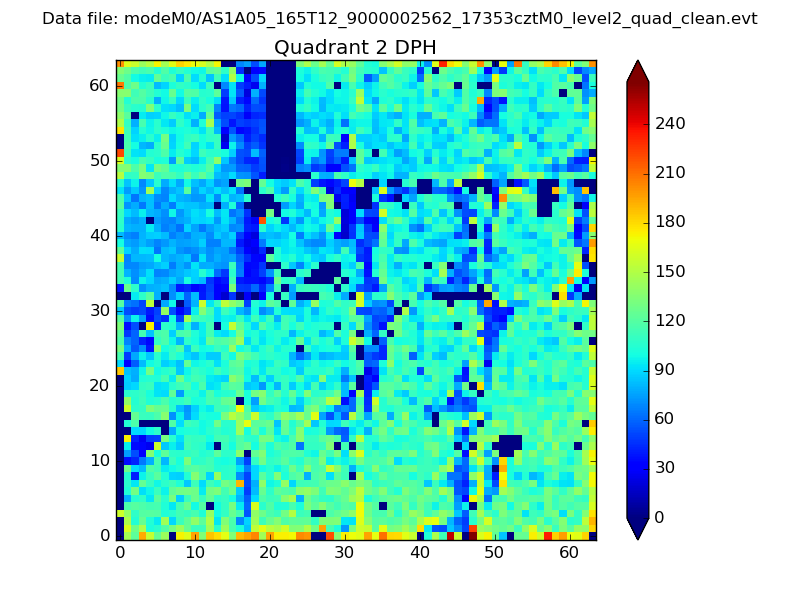 |
Quadrant C |
| Plot type | Count rate plots | Images |
|---|---|---|
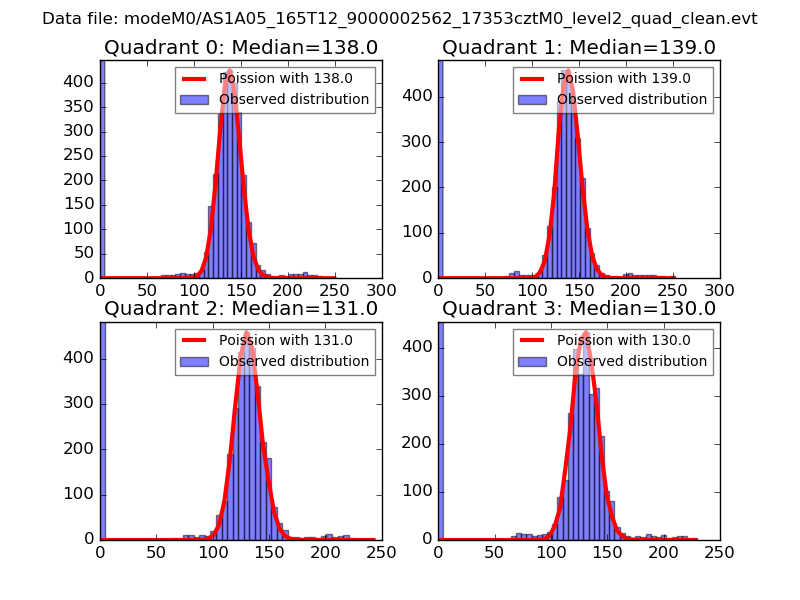
| Comparison with Poisson distribution Blue bars denote a histogram of data divided into 1 sec bins. Red curve is a Poisson curve with rate = median count rate of data. |
 |
 |
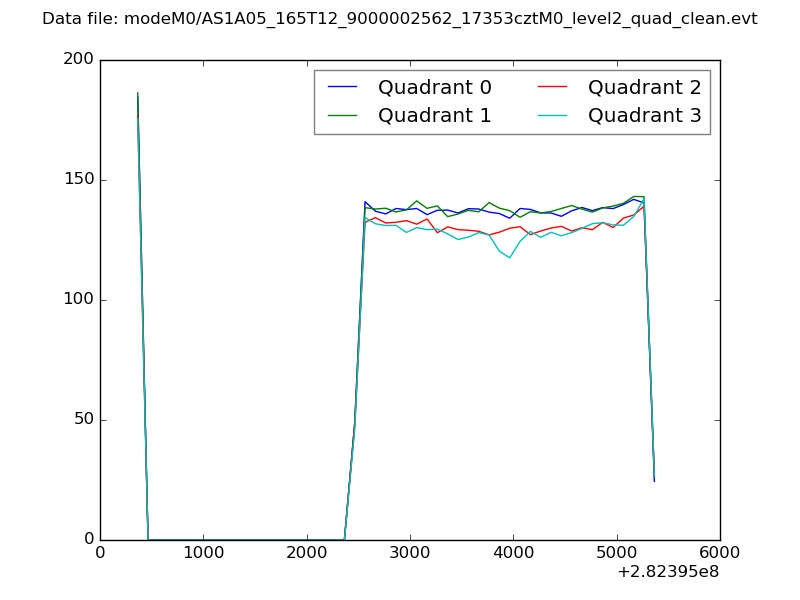
| Quadrant-wise count rates Data is divided into 100 sec bins |
 |
|
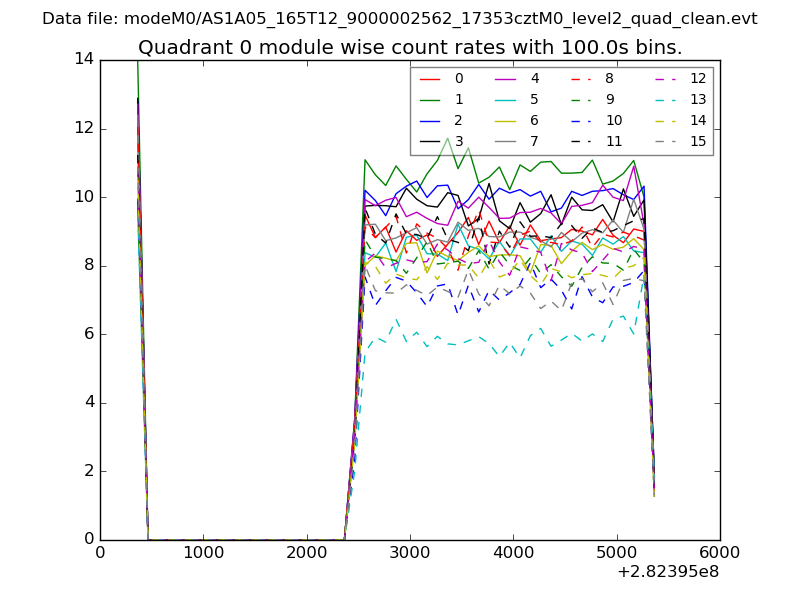
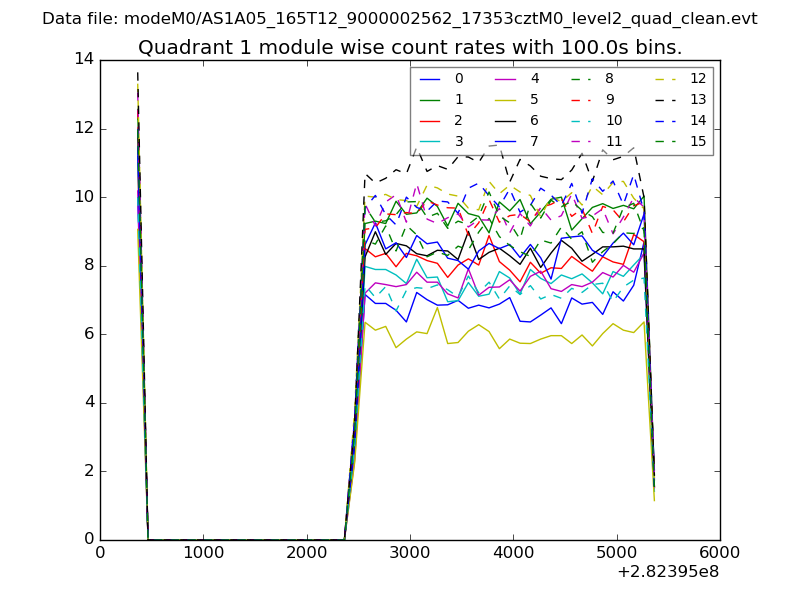
| Module-wise count rates for Quadrant A Data is divided into 100 sec bins |
 |
 |
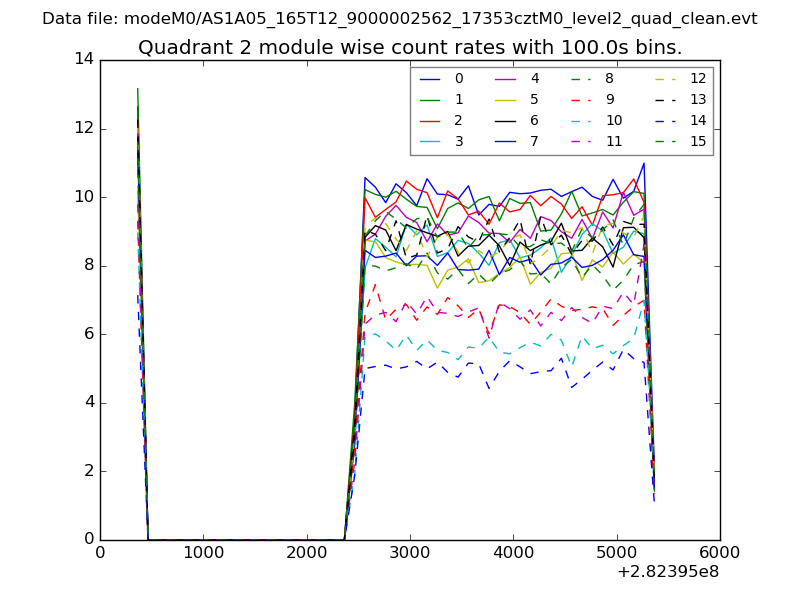
| Module-wise count rates for Quadrant B Data is divided into 100 sec bins |
 |
 |
| Module-wise count rates for Quadrant C Data is divided into 100 sec bins |
 |
 |
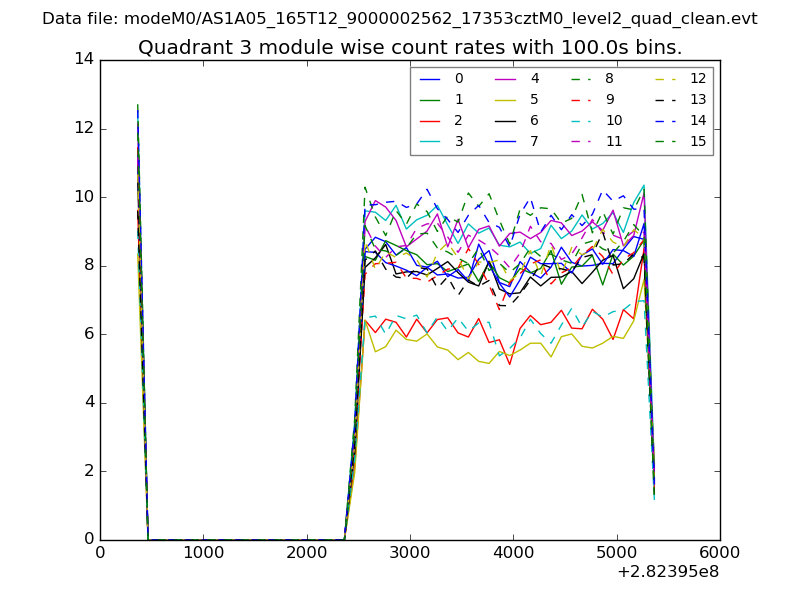
| Module-wise count rates for Quadrant D Data is divided into 100 sec bins |
 |
 |
| Parameter | Plot |
|---|---|
| CZT HV Monitor | 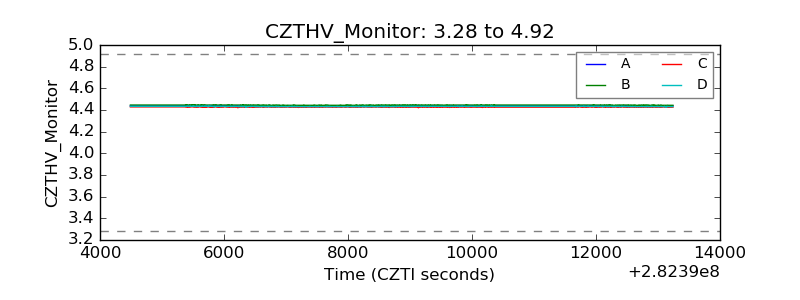 |
| D_VDD | 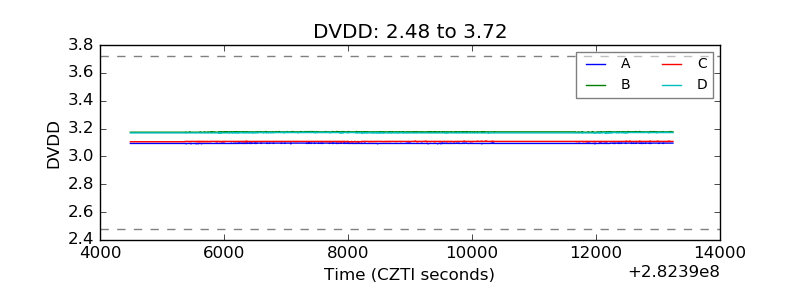 |
| Temperature 1 |  |
| Veto HV Monitor | 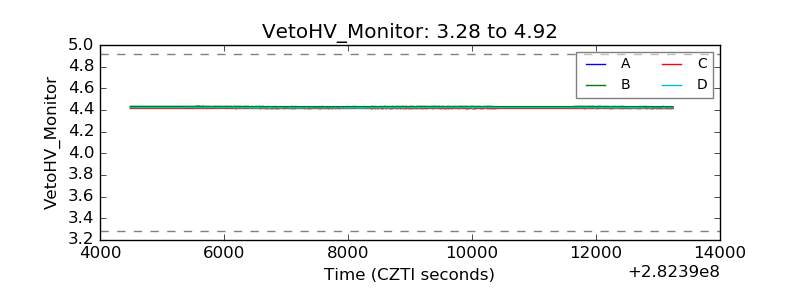 |
| Veto LLD | 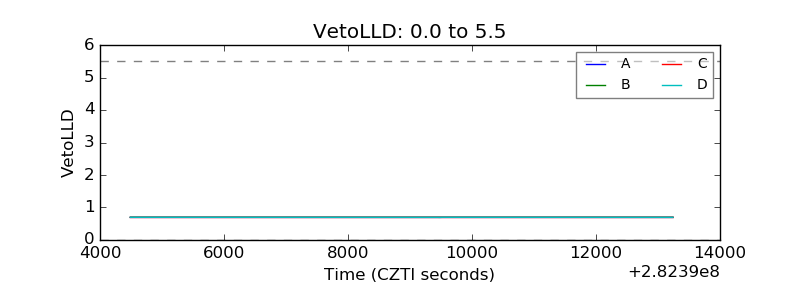 |
| Alpha Counter | 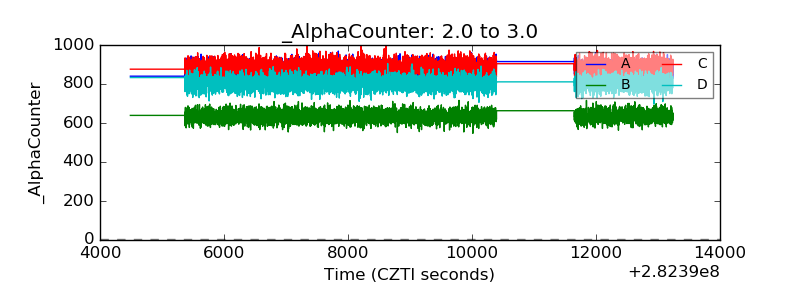 |
| _CPM_Rate | 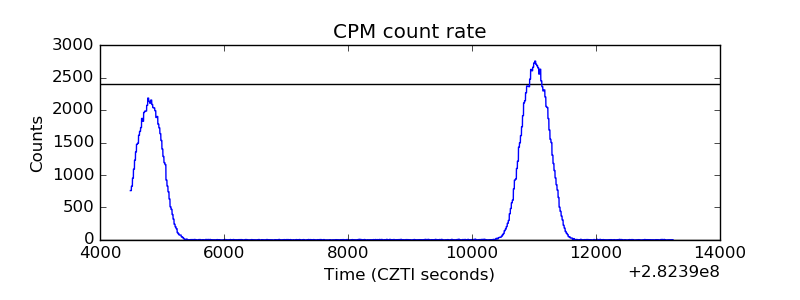 |
| CZT Counter | 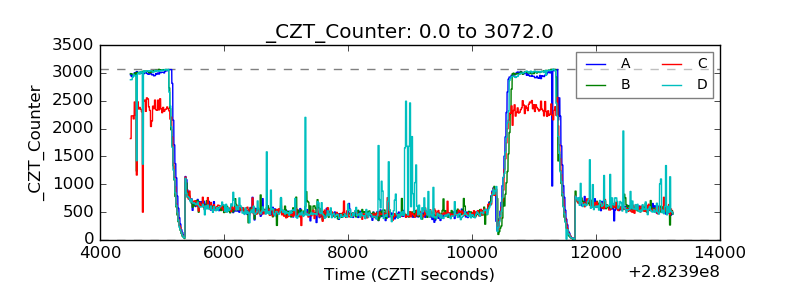 |
| +2.5 Volts monitor |  |
| +5 Volts monitor |  |
| _ROLL_ROT | 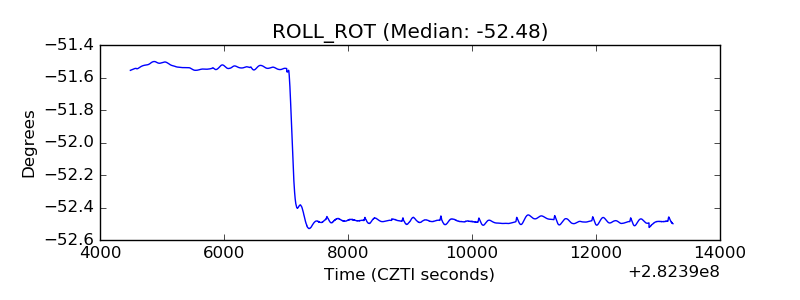 |
| _Roll_DEC | 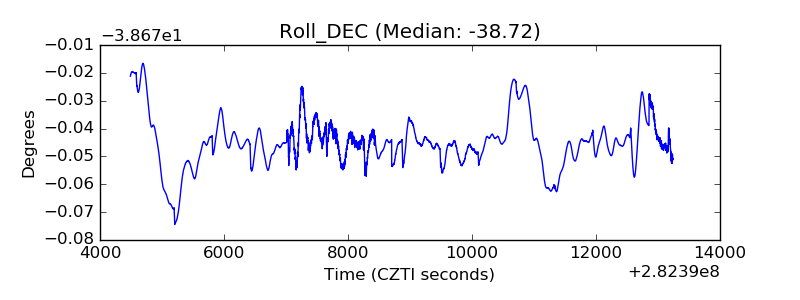 |
| _Roll_RA | 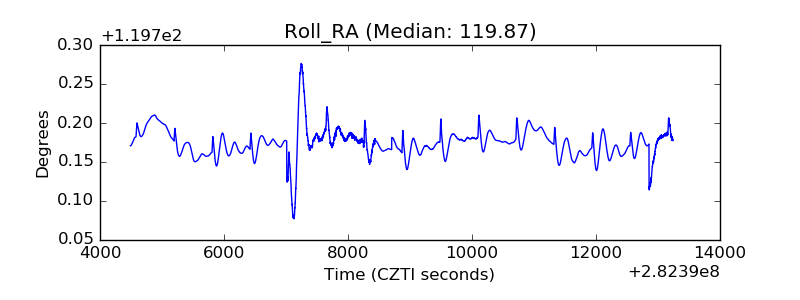 |
| Veto Counter | 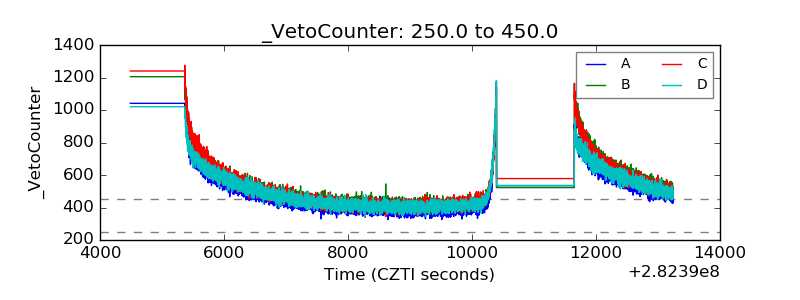 |