| Param | Original file | Final file |
|---|---|---|
| Filename | modeM0/AS1A05_165T12_9000002562_17355cztM0_level2.evt | modeM0/AS1A05_165T12_9000002562_17355cztM0_level2_quad_clean.evt |
| Size (bytes) | 508,608,000 | 92,704,320 |
| Size | 485.0 MB | 88.4 MB |
| Events in quadrant A | 3,435,410 | 608,056 |
| Events in quadrant B | 3,536,571 | 618,559 |
| Events in quadrant C | 3,435,588 | 575,206 |
| Events in quadrant D | 4,554,557 | 552,270 |
| Mode M9 | |||
|---|---|---|---|
| Quadrant | BADHDUFLAG | Total packets | Discarded packets |
| A | 0 | 15 | 0 |
| B | 0 | 16 | 0 |
| C | 0 | 16 | 0 |
| D | 0 | 16 | 0 |
| Mode M0 | |||
|---|---|---|---|
| Quadrant | BADHDUFLAG | Total packets | Discarded packets |
| A | 0 | 14301 | 2 |
| B | 0 | 14643 | 2 |
| C | 0 | 14272 | 2 |
| D | 0 | 17887 | 2 |
| Mode SS | |||
|---|---|---|---|
| Quadrant | BADHDUFLAG | Total packets | Discarded packets |
| A | 0 | 132 | 0 |
| B | 0 | 132 | 0 |
| C | 0 | 132 | 0 |
| D | 0 | 132 | 0 |
| Quadrant | Total seconds | Saturated seconds | Saturation percentage |
|---|---|---|---|
| A | 6498 | 108 | 1.662050% |
| B | 6498 | 129 | 1.985226% |
| C | 6498 | 151 | 2.323792% |
| D | 6498 | 314 | 4.832256% |
Noise dominated data is calculated using 1-second bins in cleaned event files. If a bin has >2000 counts, and if more than 50% of those come from <1% of pixels, then it is considered to be noise-dominated and hence unusable.
| Quadrant | # 1 sec bins | Bins with >0 counts | Bins with >2000 counts | High rate bins dominated by noise | Noise dominated (total time) | Noise dominated (detector-on time) | Marked lightcurve |
|---|---|---|---|---|---|---|---|
| A | 7798 | 6499 | 1 | 1 | 0.01% | 0.02% | 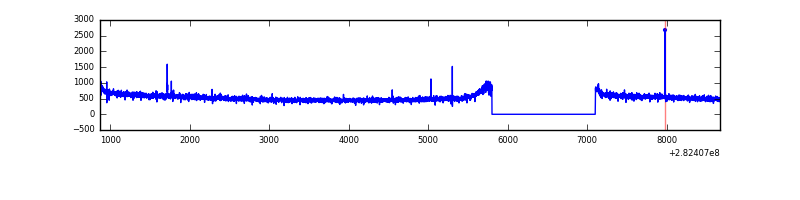 |
| B | 7798 | 6499 | 2 | 2 | 0.03% | 0.03% | 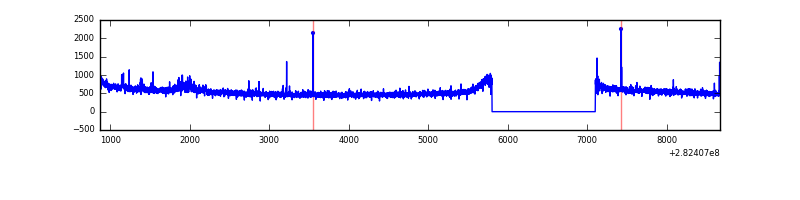 |
| C | 7798 | 6499 | 0 | 0 | 0.00% | 0.00% | 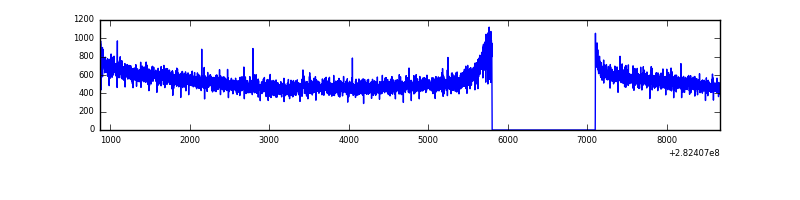 |
| D | 7798 | 6499 | 213 | 213 | 2.73% | 3.28% | 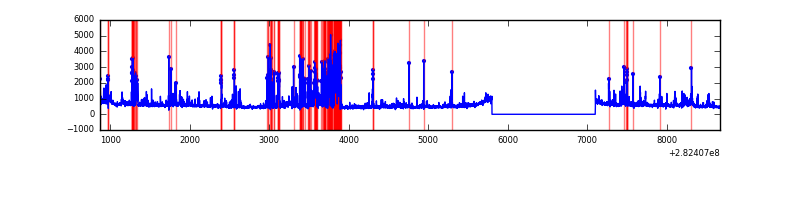 |
Top three noisy pixels from each quadrant. If the there are fewer than three noisy pixels in the level2.evt file, extra rows are filled as -1
| Pixel properties | Quadrant properties | ||||||
|---|---|---|---|---|---|---|---|
| Quadrant | DetID | PixID | Counts | Sigma | Mean | Median | Sigma |
| A | 0 | 226 | 8166 | 41.25 | 890 | 876 | 176.7 |
| A | 15 | 174 | 7601 | 38.05 | 890 | 876 | 176.7 |
| A | 12 | 194 | 6491 | 31.77 | 890 | 876 | 176.7 |
| B | 4 | 216 | 47660 | 284.53 | 888 | 868 | 164.5 |
| B | 12 | 111 | 18621 | 107.95 | 888 | 868 | 164.5 |
| B | 11 | 111 | 15886 | 91.32 | 888 | 868 | 164.5 |
| C | 14 | 238 | 134230 | 697.09 | 836 | 845 | 191.3 |
| C | 3 | 233 | 40415 | 206.8 | 836 | 845 | 191.3 |
| C | 13 | 61 | 6086 | 27.39 | 836 | 845 | 191.3 |
| D | 1 | 52 | 765309 | 3773.55 | 839 | 815 | 202.6 |
| D | 13 | 232 | 171353 | 841.77 | 839 | 815 | 202.6 |
| D | 13 | 189 | 126542 | 620.59 | 839 | 815 | 202.6 |
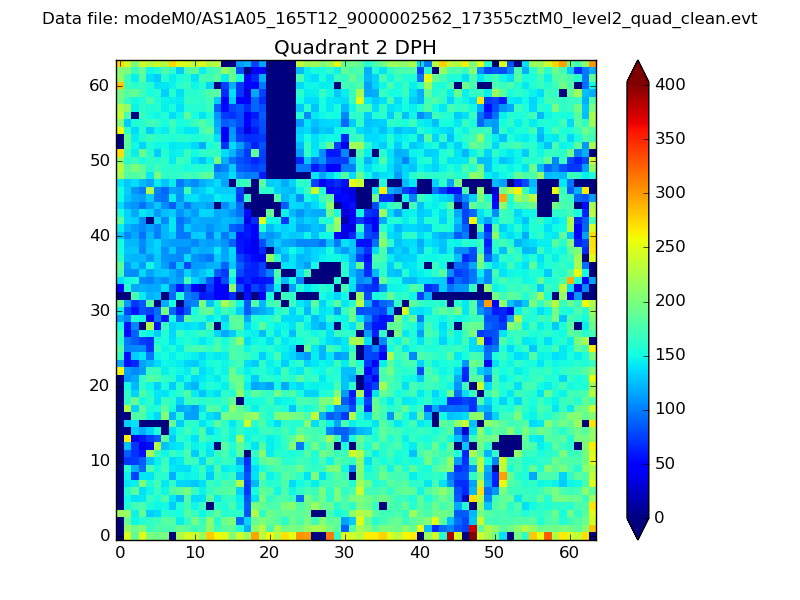
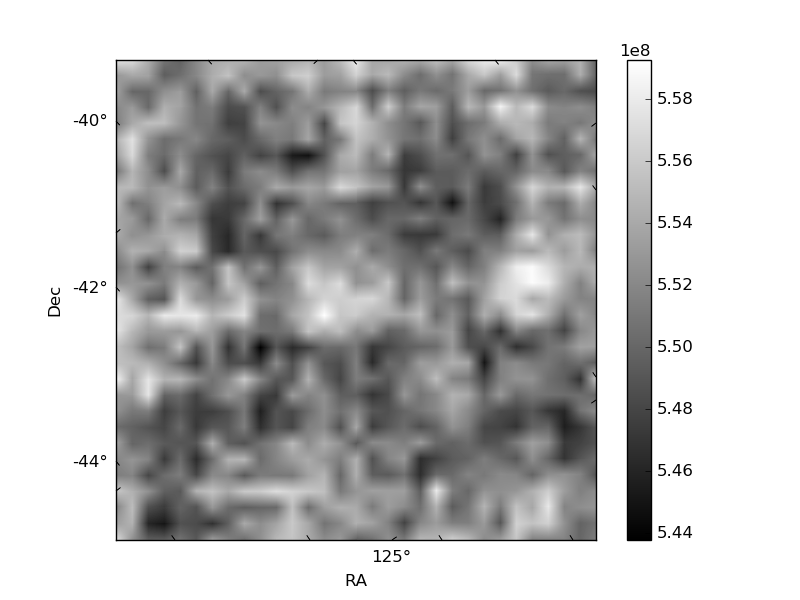
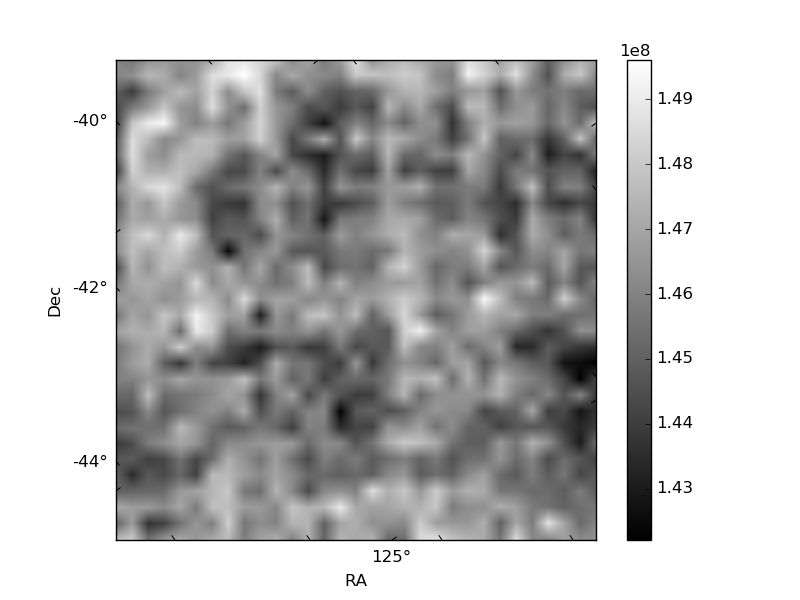
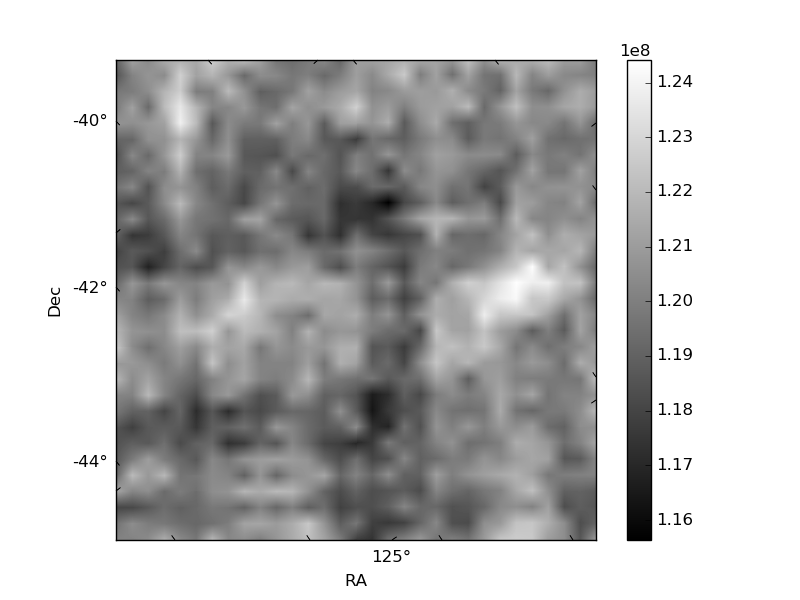
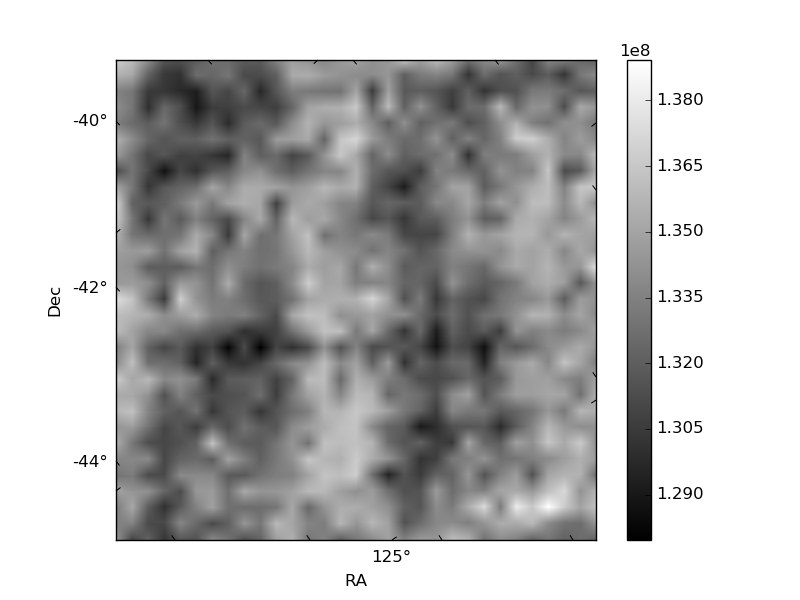
Histogram calculated using DETX and DETY for each event in the final _common_clean file
| Quadrant A | 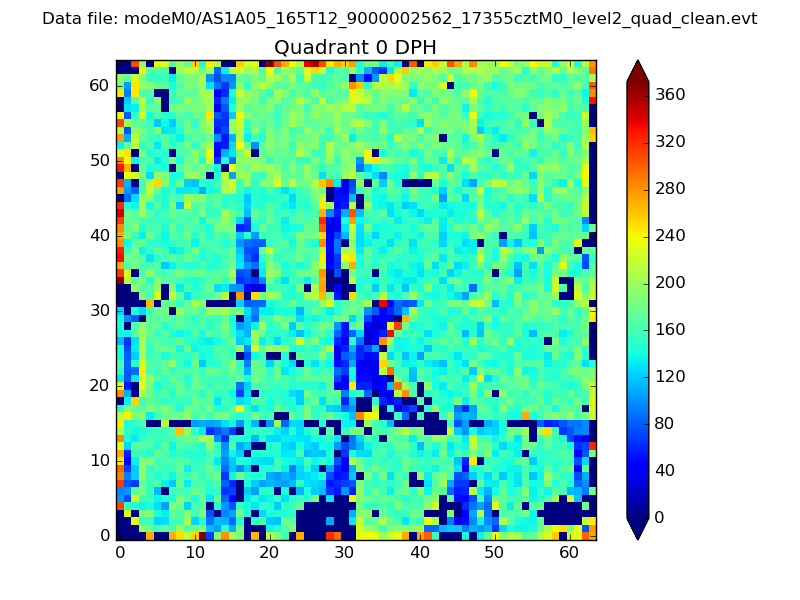 |
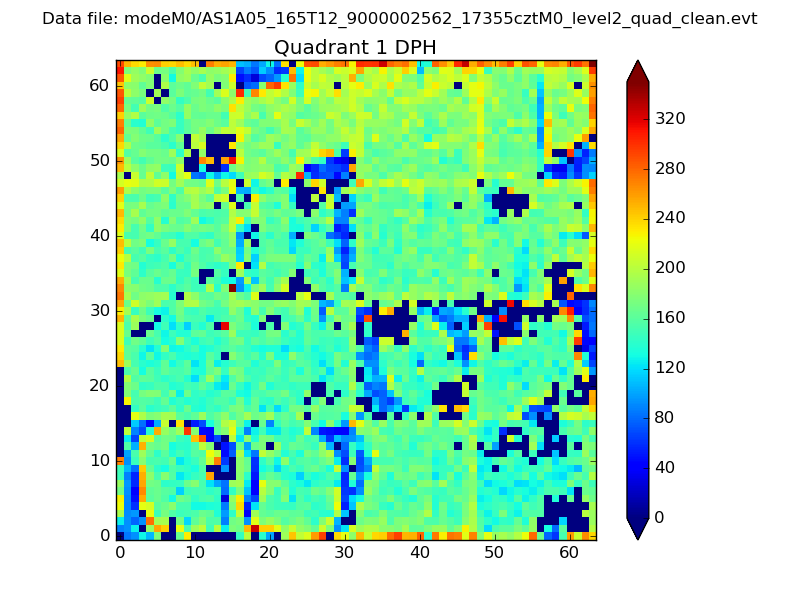 |
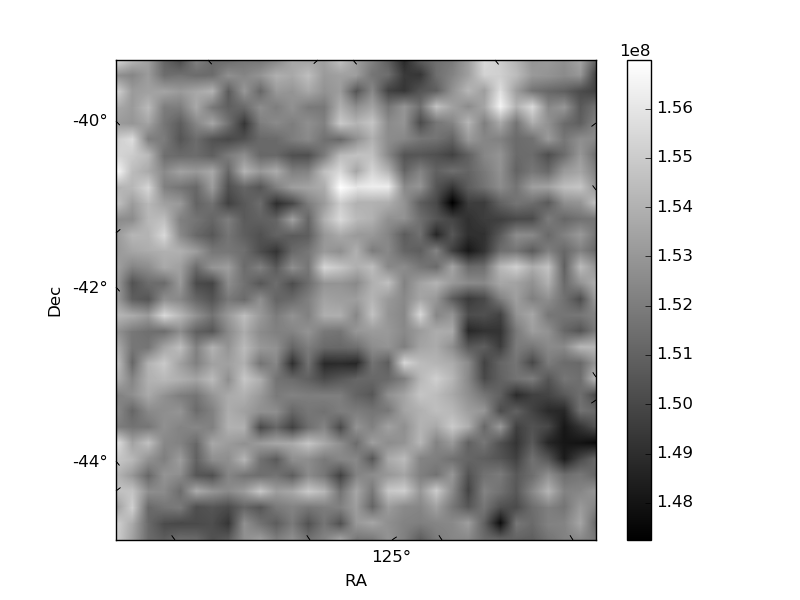
Quadrant B |
|---|---|---|---|
| Quadrant D | 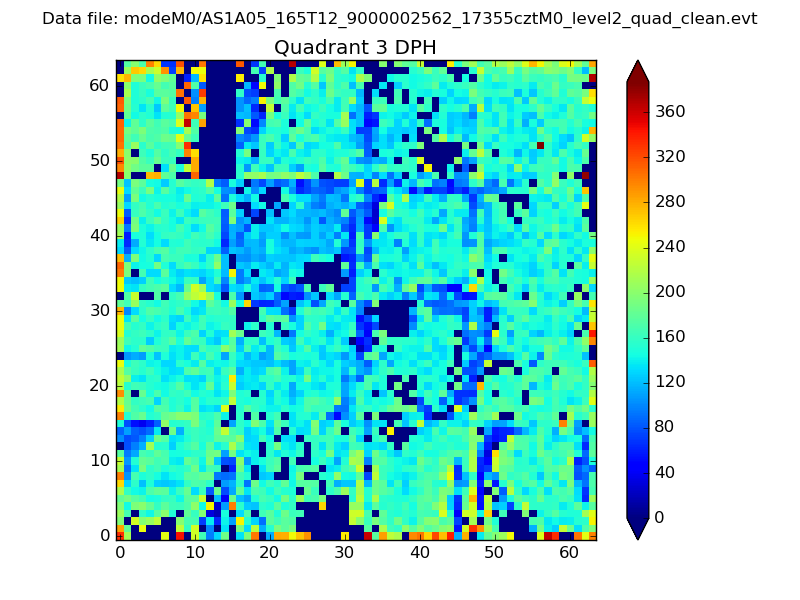 |
 |
Quadrant C |
| Plot type | Count rate plots | Images |
|---|---|---|
| Comparison with Poisson distribution Blue bars denote a histogram of data divided into 1 sec bins. Red curve is a Poisson curve with rate = median count rate of data. |
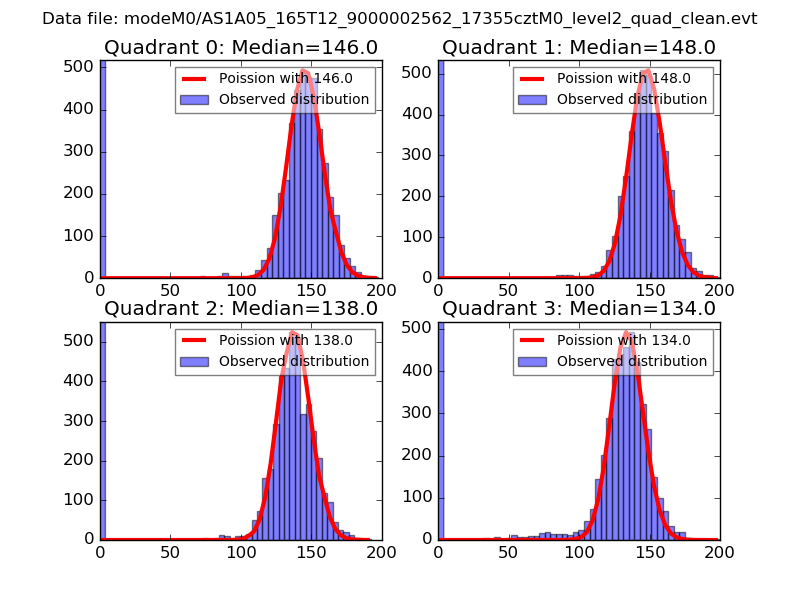 |
 |
| Quadrant-wise count rates Data is divided into 100 sec bins |
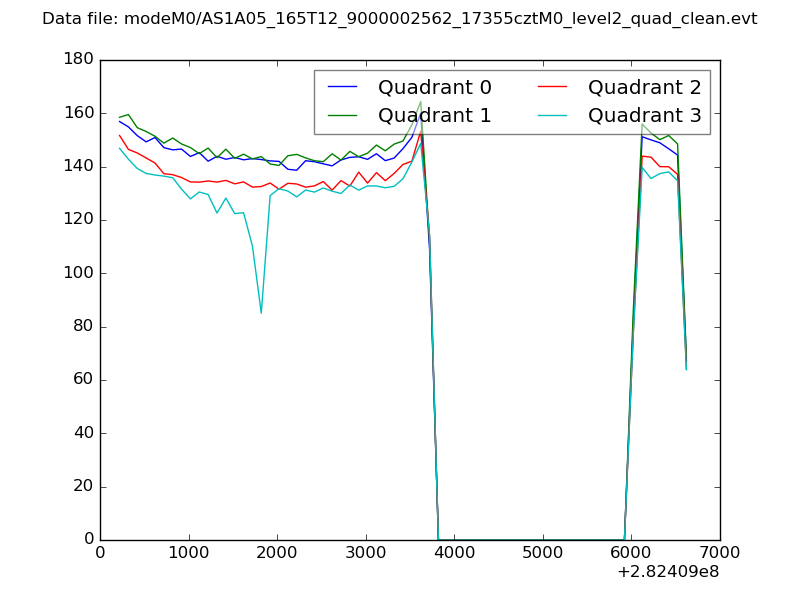 |
|
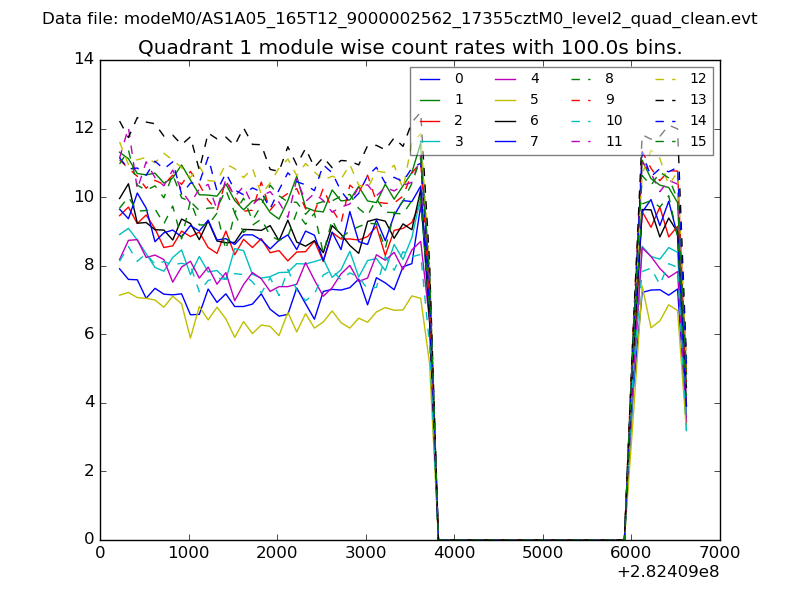
| Module-wise count rates for Quadrant A Data is divided into 100 sec bins |
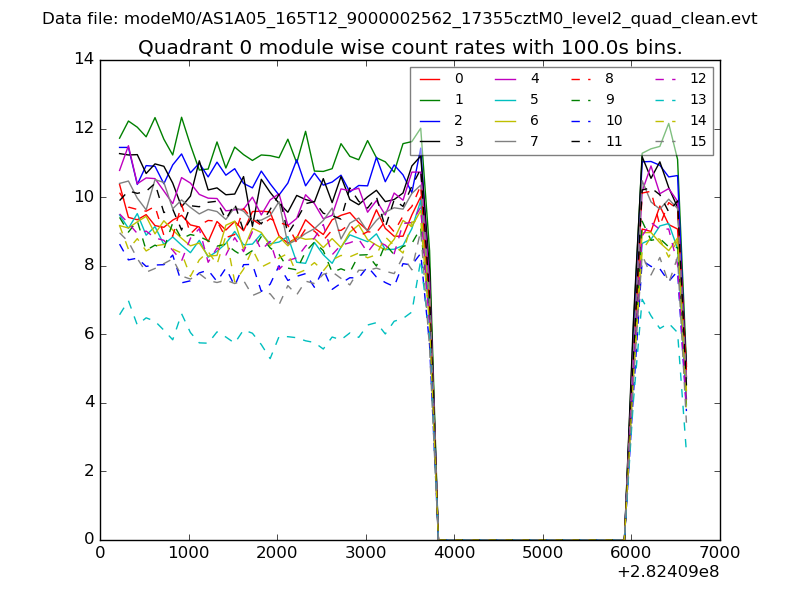 |
 |
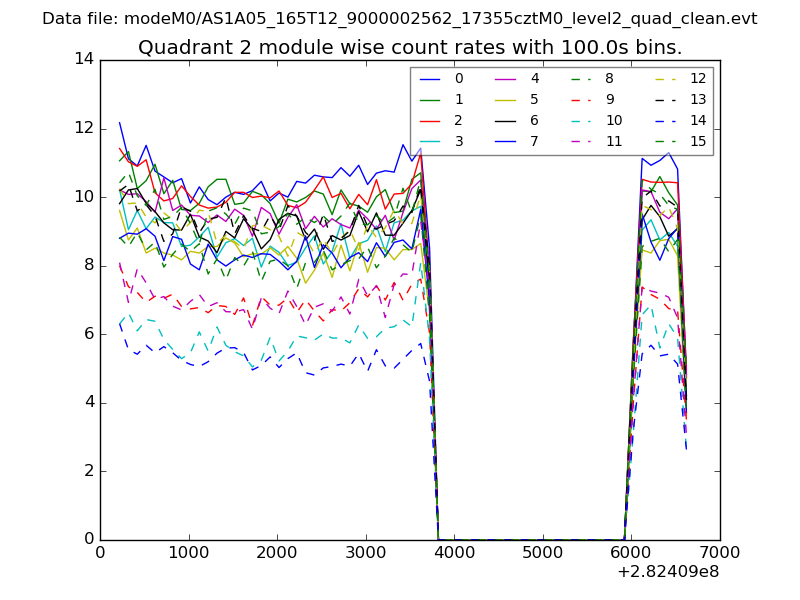
| Module-wise count rates for Quadrant B Data is divided into 100 sec bins |
 |
 |
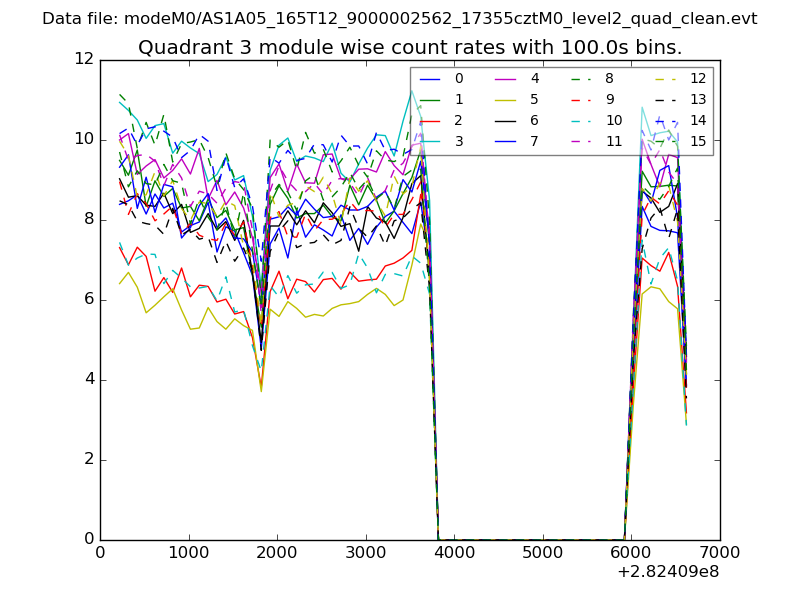
| Module-wise count rates for Quadrant C Data is divided into 100 sec bins |
 |
 |
| Module-wise count rates for Quadrant D Data is divided into 100 sec bins |
 |
 |
| Parameter | Plot |
|---|---|
| CZT HV Monitor | 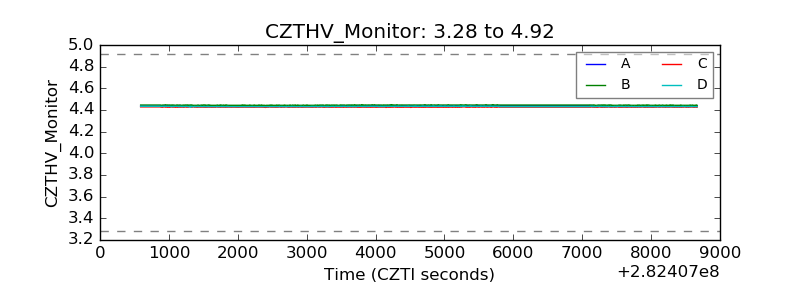 |
| D_VDD | 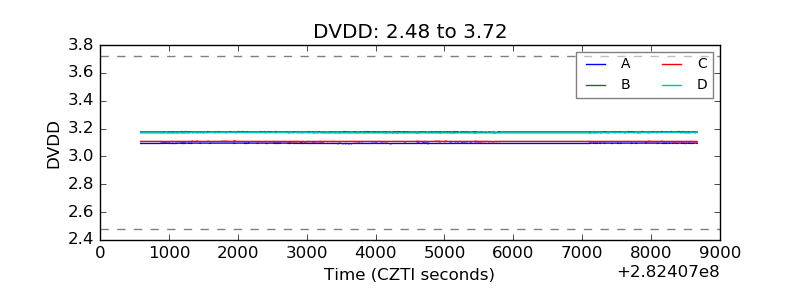 |
| Temperature 1 | 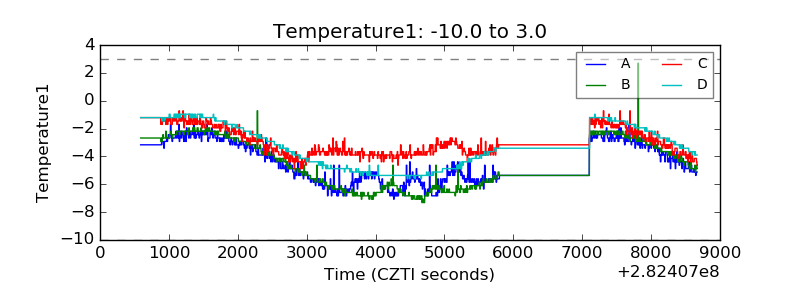 |
| Veto HV Monitor | 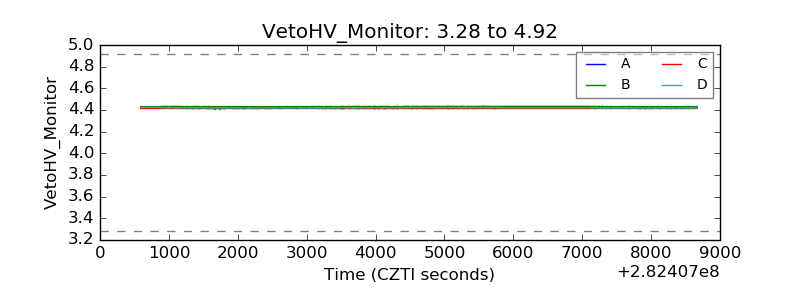 |
| Veto LLD | 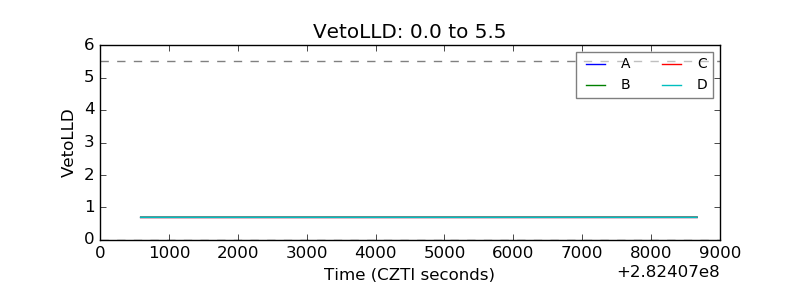 |
| Alpha Counter | 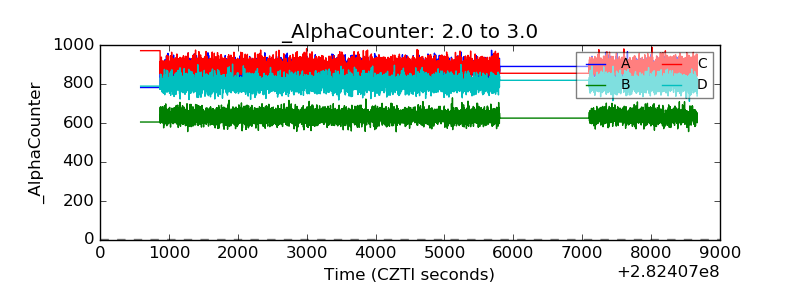 |
| _CPM_Rate | 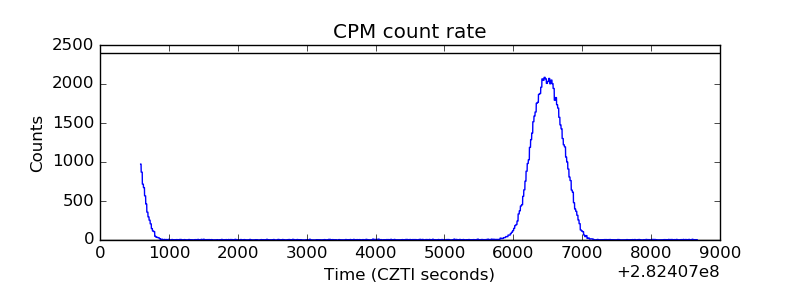 |
| CZT Counter | 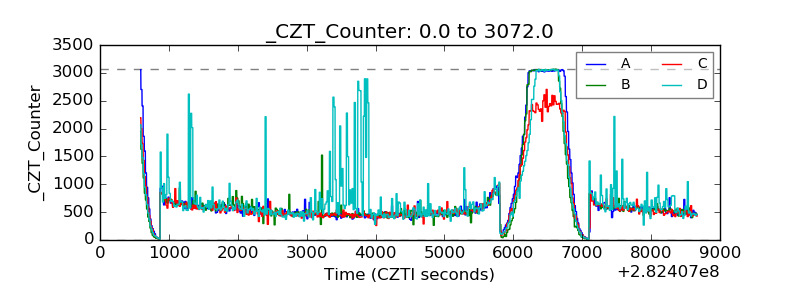 |
| +2.5 Volts monitor | 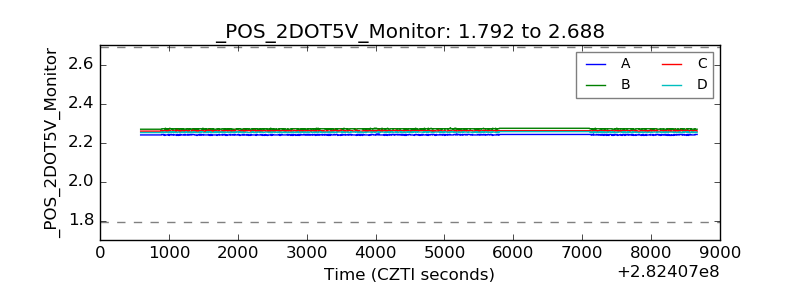 |
| +5 Volts monitor | 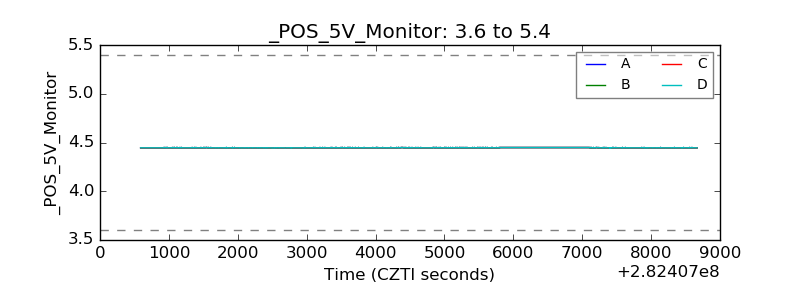 |
| _ROLL_ROT | 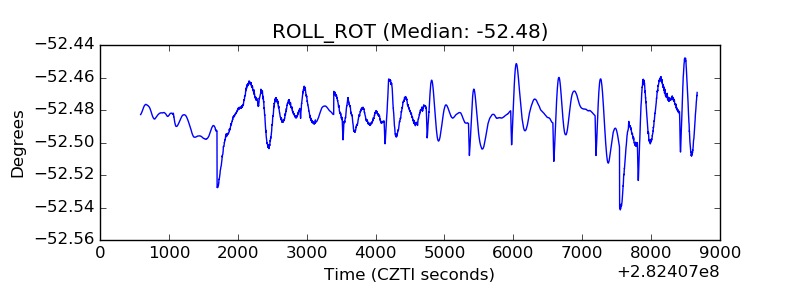 |
| _Roll_DEC | 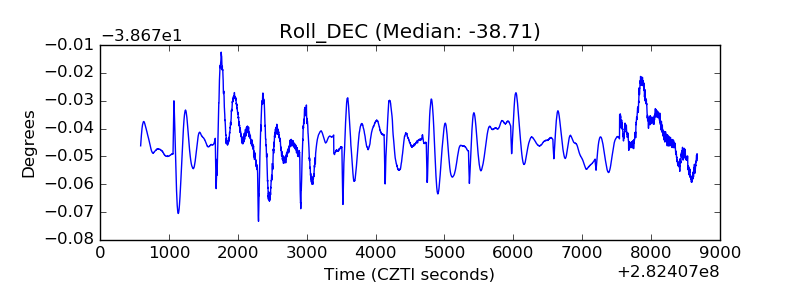 |
| _Roll_RA | 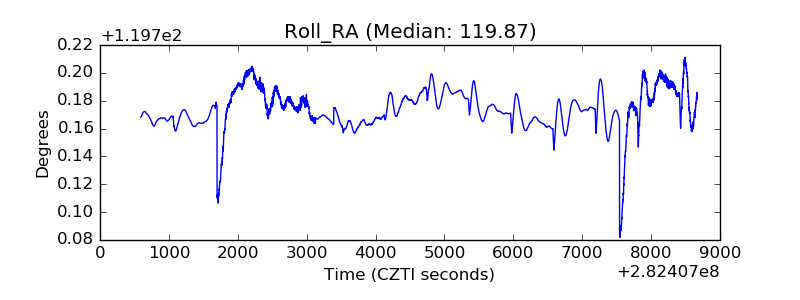 |
| Veto Counter | 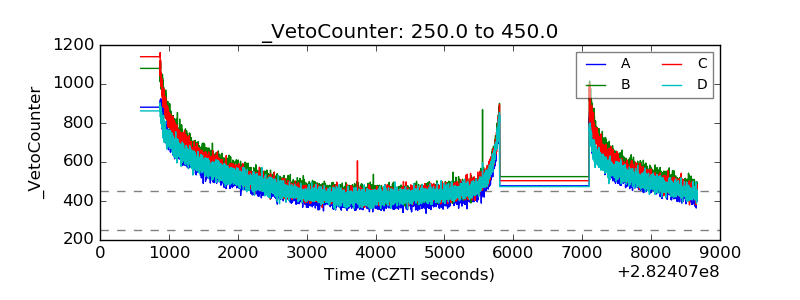 |