| Param | Original file | Final file |
|---|---|---|
| Filename | modeM0/AS1A05_165T12_9000002562_17356cztM0_level2.evt | modeM0/AS1A05_165T12_9000002562_17356cztM0_level2_quad_clean.evt |
| Size (bytes) | 482,860,800 | 98,424,000 |
| Size | 460.5 MB | 93.9 MB |
| Events in quadrant A | 3,294,876 | 652,583 |
| Events in quadrant B | 3,363,773 | 663,486 |
| Events in quadrant C | 3,291,005 | 617,355 |
| Events in quadrant D | 4,233,810 | 595,522 |
| Mode M9 | |||
|---|---|---|---|
| Quadrant | BADHDUFLAG | Total packets | Discarded packets |
| A | 0 | 25 | 0 |
| B | 0 | 25 | 0 |
| C | 0 | 25 | 0 |
| D | 0 | 25 | 0 |
| Mode M0 | |||
|---|---|---|---|
| Quadrant | BADHDUFLAG | Total packets | Discarded packets |
| A | 0 | 13887 | 2 |
| B | 0 | 13993 | 2 |
| C | 0 | 13860 | 2 |
| D | 0 | 17026 | 2 |
| Mode SS | |||
|---|---|---|---|
| Quadrant | BADHDUFLAG | Total packets | Discarded packets |
| A | 0 | 134 | 0 |
| B | 0 | 134 | 0 |
| C | 0 | 134 | 0 |
| D | 0 | 134 | 0 |
| Quadrant | Total seconds | Saturated seconds | Saturation percentage |
|---|---|---|---|
| A | 6475 | 160 | 2.471042% |
| B | 6476 | 191 | 2.949351% |
| C | 6476 | 195 | 3.011118% |
| D | 6476 | 274 | 4.231007% |
Noise dominated data is calculated using 1-second bins in cleaned event files. If a bin has >2000 counts, and if more than 50% of those come from <1% of pixels, then it is considered to be noise-dominated and hence unusable.
| Quadrant | # 1 sec bins | Bins with >0 counts | Bins with >2000 counts | High rate bins dominated by noise | Noise dominated (total time) | Noise dominated (detector-on time) | Marked lightcurve |
|---|---|---|---|---|---|---|---|
| A | 9000 | 6477 | 1 | 1 | 0.01% | 0.02% |  |
| B | 9001 | 6478 | 1 | 1 | 0.01% | 0.02% |  |
| C | 9001 | 6478 | 0 | 0 | 0.00% | 0.00% |  |
| D | 9001 | 6478 | 132 | 132 | 1.47% | 2.04% | 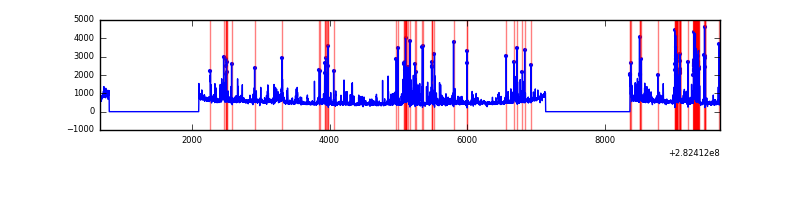 |
Top three noisy pixels from each quadrant. If the there are fewer than three noisy pixels in the level2.evt file, extra rows are filled as -1
| Pixel properties | Quadrant properties | ||||||
|---|---|---|---|---|---|---|---|
| Quadrant | DetID | PixID | Counts | Sigma | Mean | Median | Sigma |
| A | 0 | 226 | 7691 | 40.12 | 855 | 838 | 170.8 |
| A | 3 | 137 | 6123 | 30.94 | 855 | 838 | 170.8 |
| A | 12 | 194 | 6007 | 30.26 | 855 | 838 | 170.8 |
| B | 12 | 111 | 18664 | 111.2 | 855 | 835 | 160.3 |
| B | 11 | 111 | 16001 | 94.59 | 855 | 835 | 160.3 |
| B | 14 | 111 | 13589 | 79.55 | 855 | 835 | 160.3 |
| C | 14 | 238 | 126295 | 669.86 | 808 | 814 | 187.3 |
| C | 3 | 233 | 15860 | 80.32 | 808 | 814 | 187.3 |
| C | 13 | 61 | 5790 | 26.56 | 808 | 814 | 187.3 |
| D | 13 | 189 | 376771 | 1923.84 | 810 | 788 | 195.4 |
| D | 13 | 232 | 345726 | 1764.99 | 810 | 788 | 195.4 |
| D | 13 | 172 | 127231 | 646.99 | 810 | 788 | 195.4 |
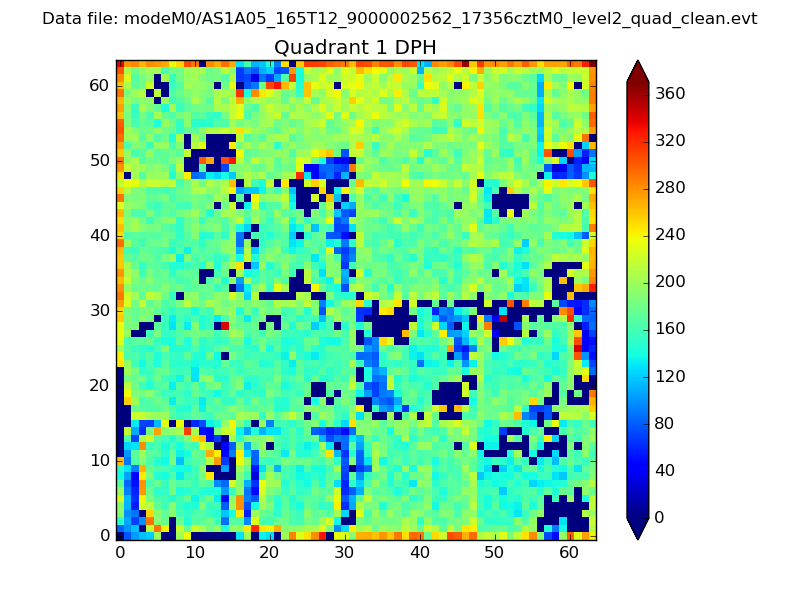
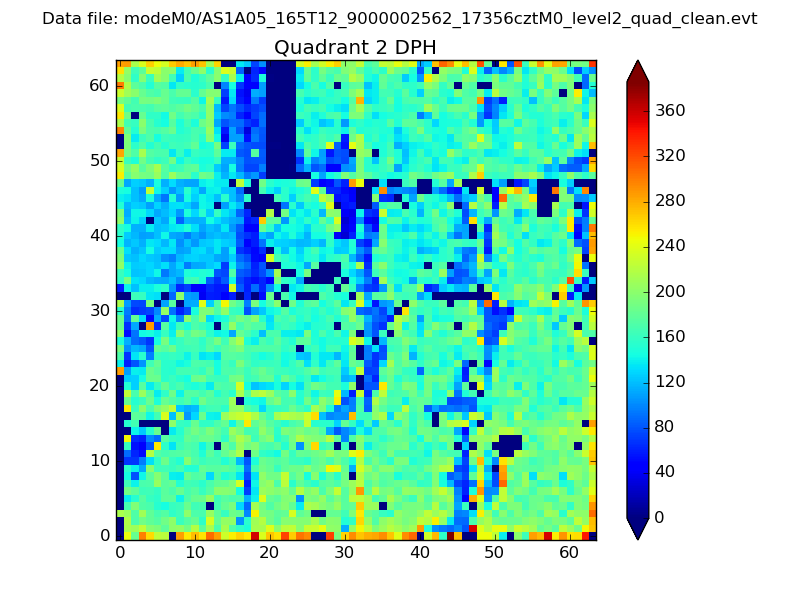
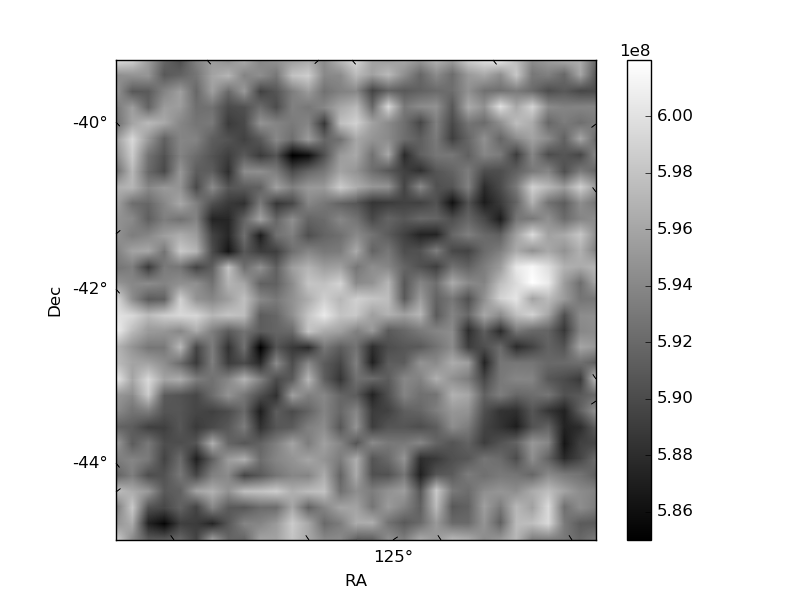
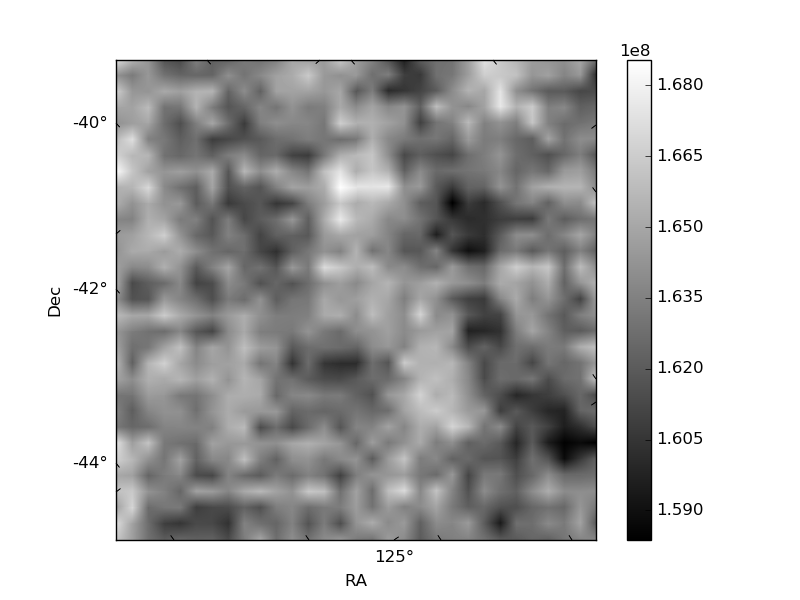
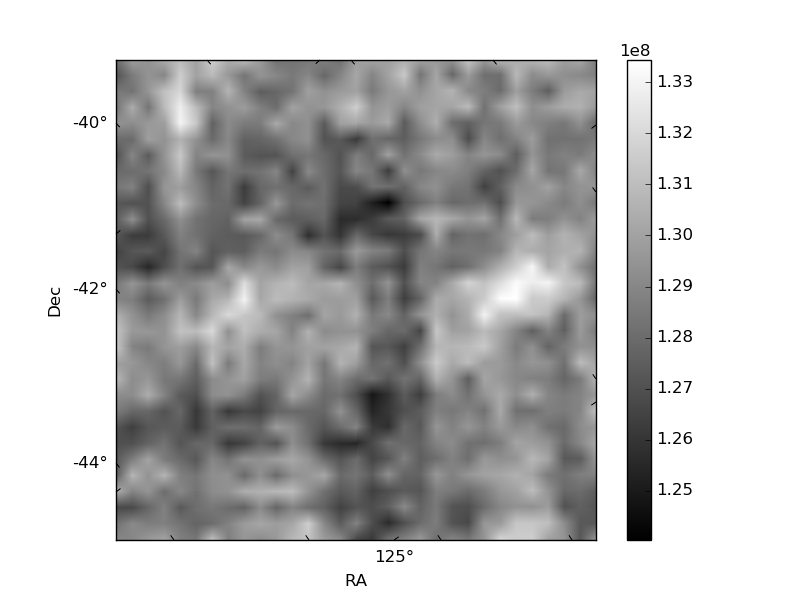
Histogram calculated using DETX and DETY for each event in the final _common_clean file
| Quadrant A |  |
 |
Quadrant B |
|---|---|---|---|
| Quadrant D | 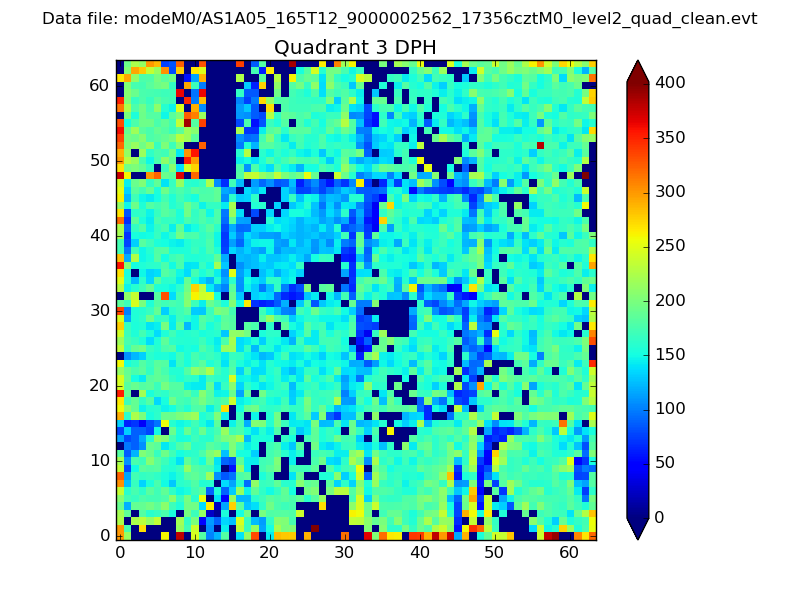 |
 |
Quadrant C |
| Plot type | Count rate plots | Images |
|---|---|---|
| Comparison with Poisson distribution Blue bars denote a histogram of data divided into 1 sec bins. Red curve is a Poisson curve with rate = median count rate of data. |
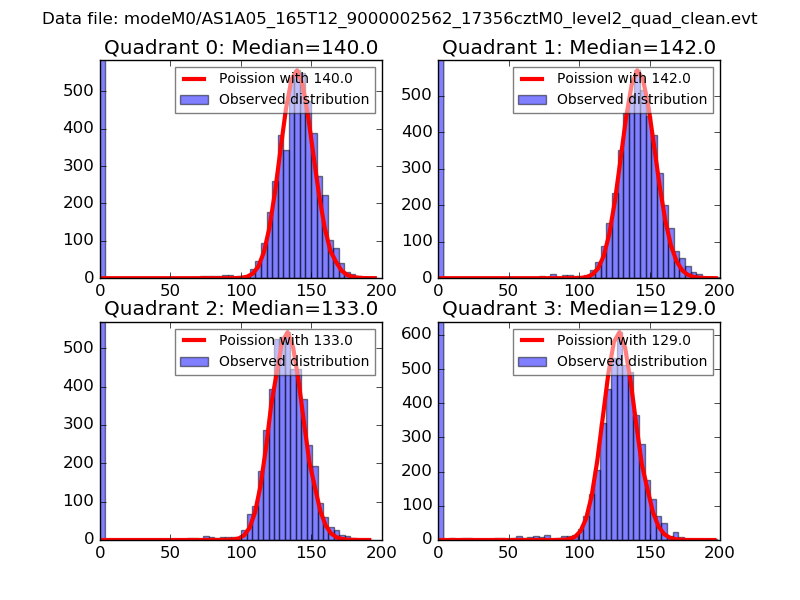 |
 |
| Quadrant-wise count rates Data is divided into 100 sec bins |
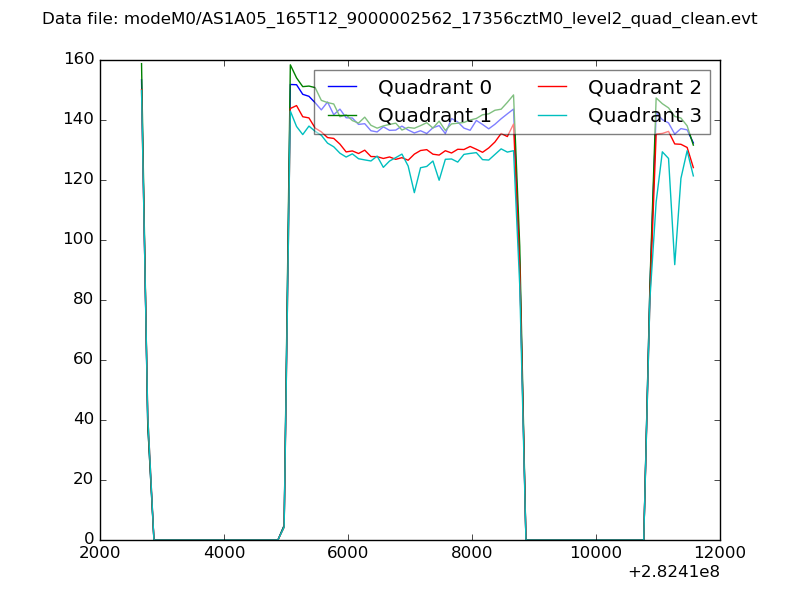 |
|
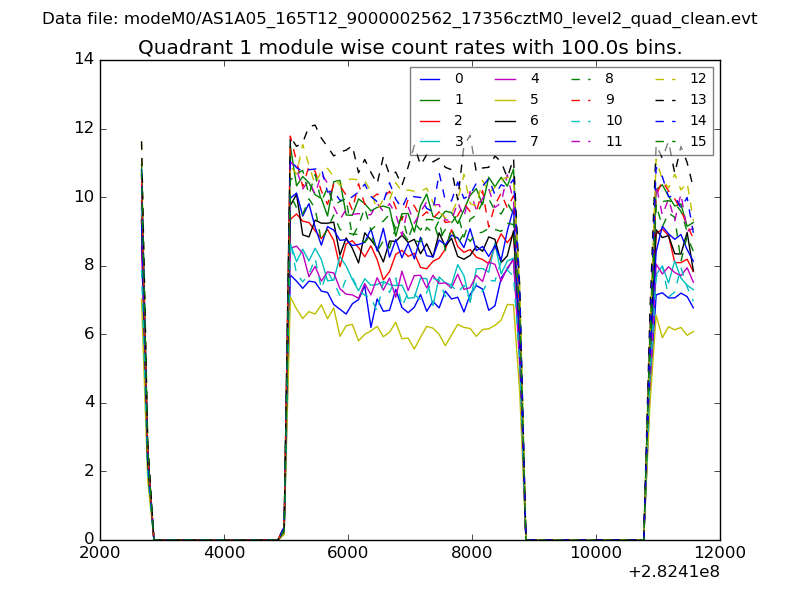
| Module-wise count rates for Quadrant A Data is divided into 100 sec bins |
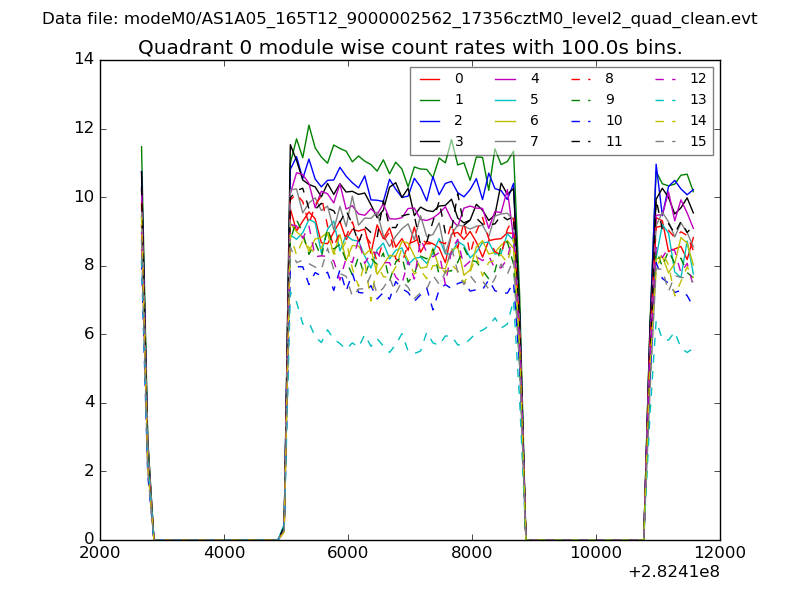 |
 |
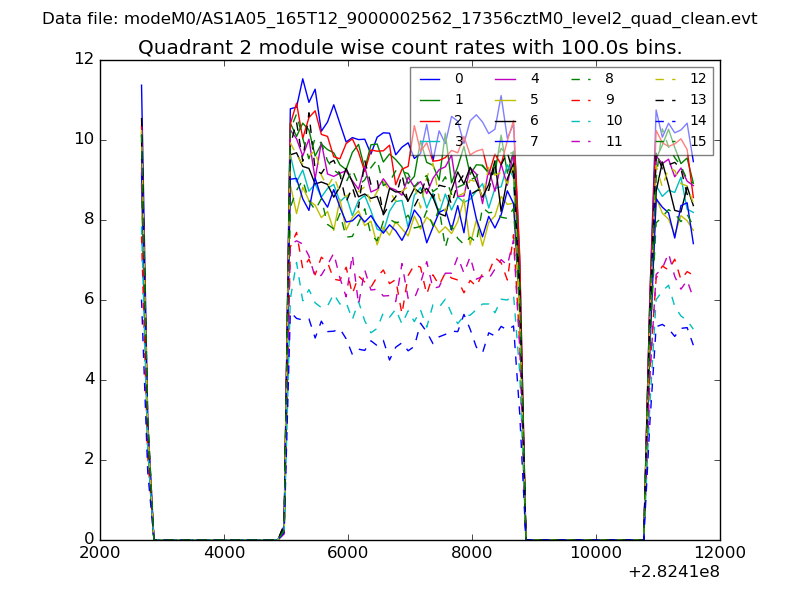
| Module-wise count rates for Quadrant B Data is divided into 100 sec bins |
 |
 |
| Module-wise count rates for Quadrant C Data is divided into 100 sec bins |
 |
 |
| Module-wise count rates for Quadrant D Data is divided into 100 sec bins |
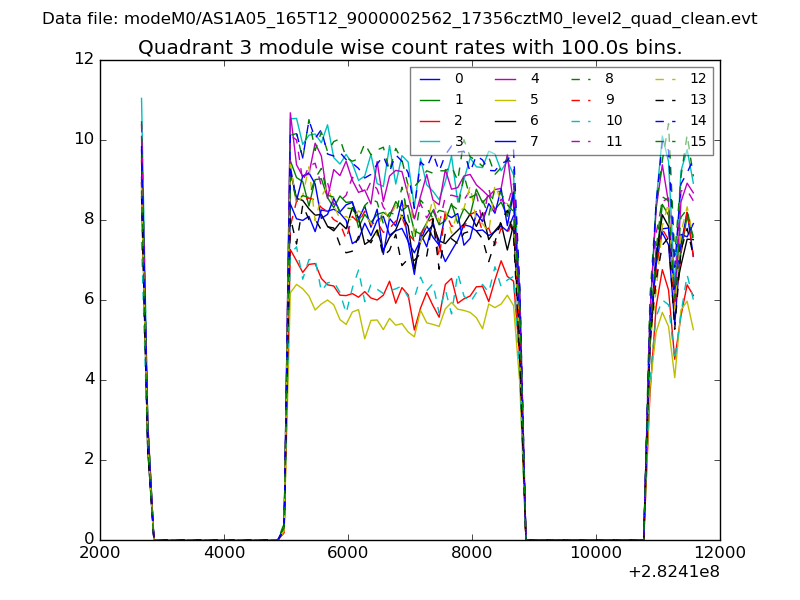 |
 |
| Parameter | Plot |
|---|---|
| CZT HV Monitor | 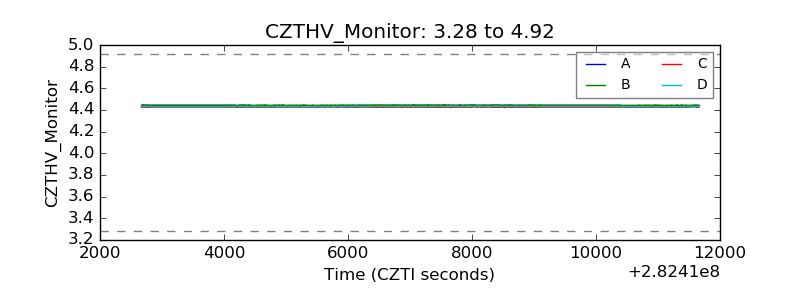 |
| D_VDD | 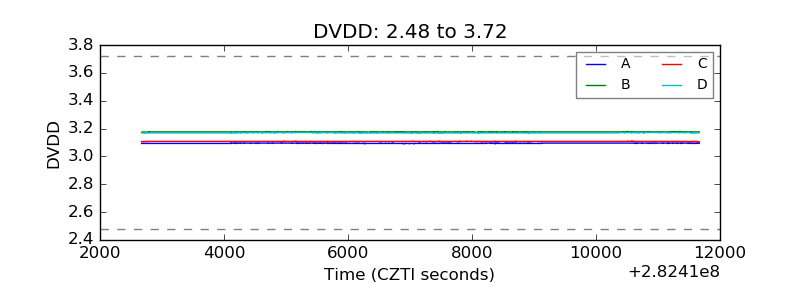 |
| Temperature 1 | 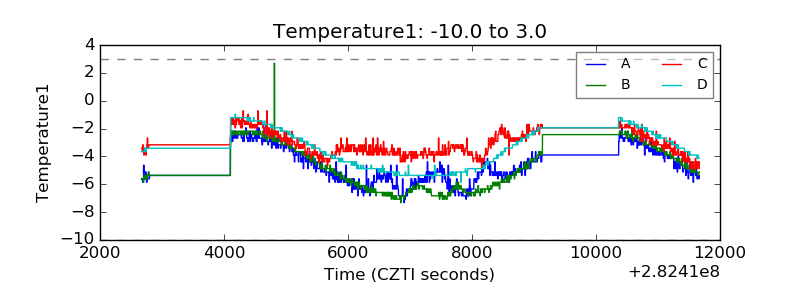 |
| Veto HV Monitor | 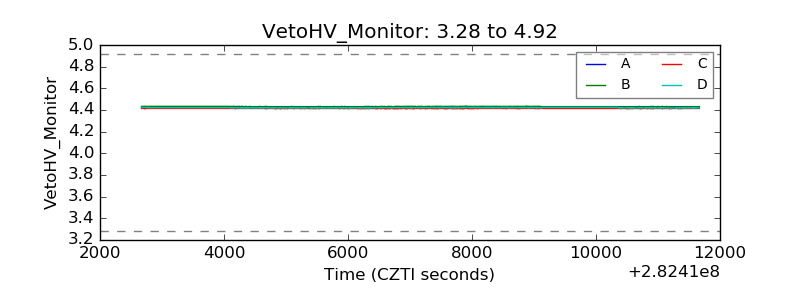 |
| Veto LLD |  |
| Alpha Counter | 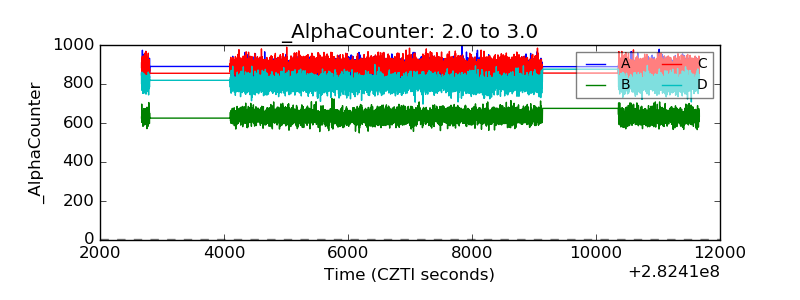 |
| _CPM_Rate | 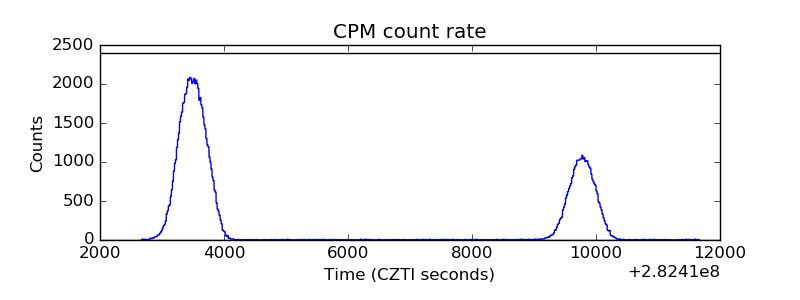 |
| CZT Counter | 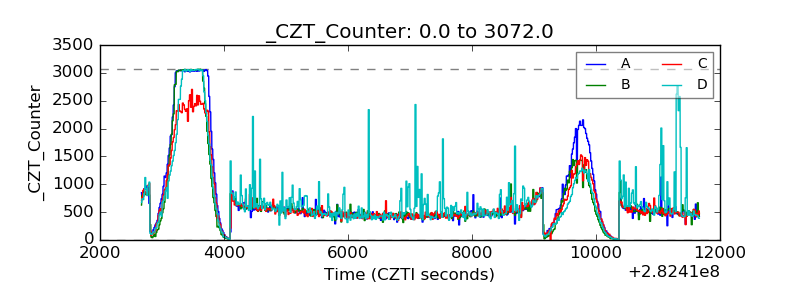 |
| +2.5 Volts monitor |  |
| +5 Volts monitor |  |
| _ROLL_ROT | 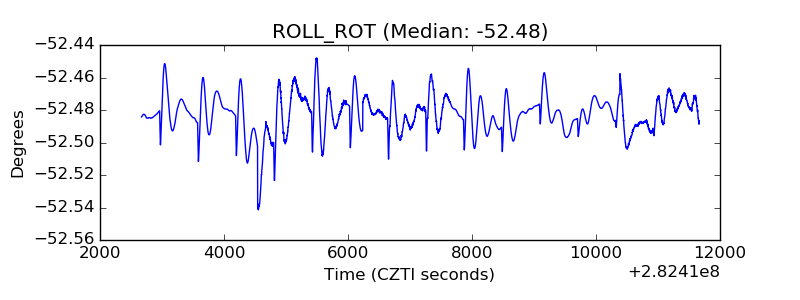 |
| _Roll_DEC | 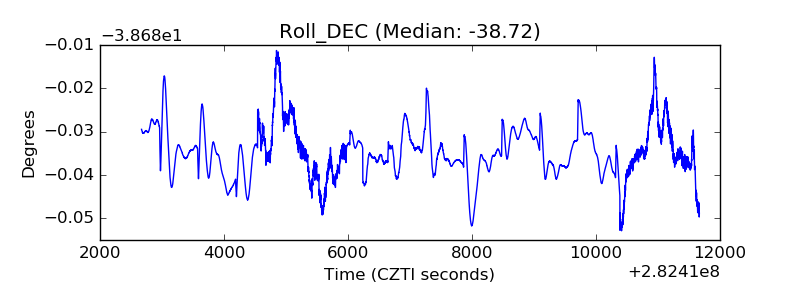 |
| _Roll_RA | 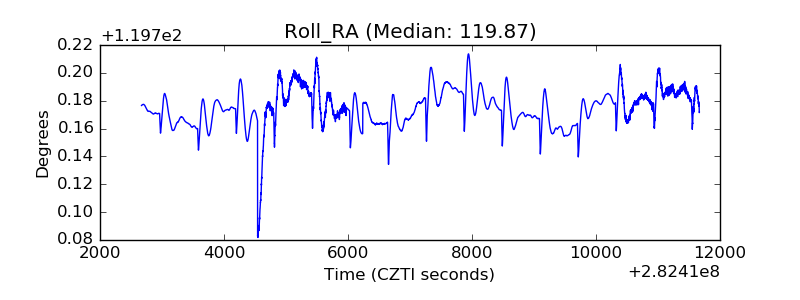 |
| Veto Counter | 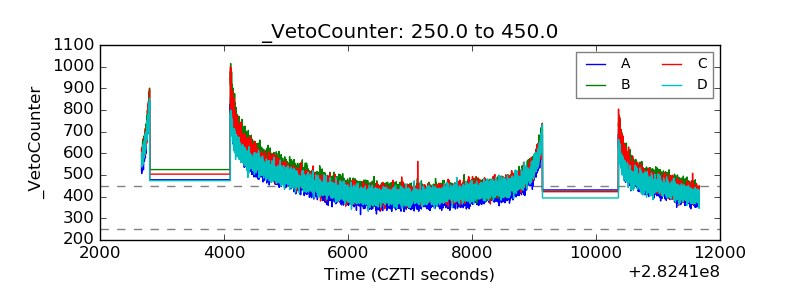 |