| Param | Original file | Final file |
|---|---|---|
| Filename | modeM0/AS1A05_165T12_9000002562_17357cztM0_level2.evt | modeM0/AS1A05_165T12_9000002562_17357cztM0_level2_quad_clean.evt |
| Size (bytes) | 463,844,160 | 96,923,520 |
| Size | 442.4 MB | 92.4 MB |
| Events in quadrant A | 3,072,382 | 641,259 |
| Events in quadrant B | 3,168,196 | 651,955 |
| Events in quadrant C | 3,099,893 | 608,441 |
| Events in quadrant D | 4,264,575 | 579,323 |
| Mode M9 | |||
|---|---|---|---|
| Quadrant | BADHDUFLAG | Total packets | Discarded packets |
| A | 0 | 17 | 0 |
| B | 0 | 18 | 0 |
| C | 0 | 18 | 0 |
| D | 0 | 18 | 0 |
| Mode M0 | |||
|---|---|---|---|
| Quadrant | BADHDUFLAG | Total packets | Discarded packets |
| A | 0 | 13403 | 2 |
| B | 0 | 13531 | 2 |
| C | 0 | 13389 | 2 |
| D | 0 | 17217 | 2 |
| Mode SS | |||
|---|---|---|---|
| Quadrant | BADHDUFLAG | Total packets | Discarded packets |
| A | 0 | 132 | 0 |
| B | 0 | 132 | 0 |
| C | 0 | 132 | 0 |
| D | 0 | 132 | 0 |
| Quadrant | Total seconds | Saturated seconds | Saturation percentage |
|---|---|---|---|
| A | 6514 | 27 | 0.414492% |
| B | 6514 | 37 | 0.568007% |
| C | 6514 | 43 | 0.660117% |
| D | 6514 | 284 | 4.359840% |
Noise dominated data is calculated using 1-second bins in cleaned event files. If a bin has >2000 counts, and if more than 50% of those come from <1% of pixels, then it is considered to be noise-dominated and hence unusable.
| Quadrant | # 1 sec bins | Bins with >0 counts | Bins with >2000 counts | High rate bins dominated by noise | Noise dominated (total time) | Noise dominated (detector-on time) | Marked lightcurve |
|---|---|---|---|---|---|---|---|
| A | 7489 | 6515 | 0 | 0 | 0.00% | 0.00% |  |
| B | 7489 | 6515 | 2 | 2 | 0.03% | 0.03% | 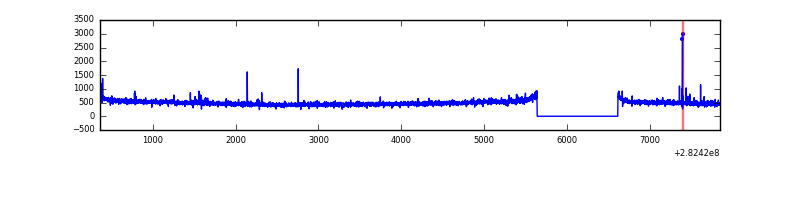 |
| C | 7489 | 6515 | 0 | 0 | 0.00% | 0.00% | 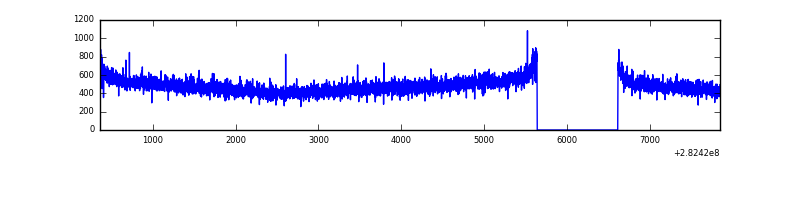 |
| D | 7489 | 6515 | 225 | 225 | 3.00% | 3.45% | 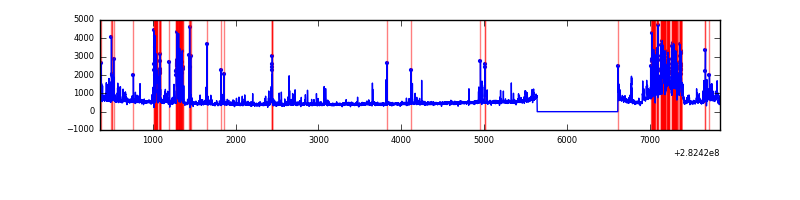 |
Top three noisy pixels from each quadrant. If the there are fewer than three noisy pixels in the level2.evt file, extra rows are filled as -1
| Pixel properties | Quadrant properties | ||||||
|---|---|---|---|---|---|---|---|
| Quadrant | DetID | PixID | Counts | Sigma | Mean | Median | Sigma |
| A | 0 | 226 | 6995 | 38.77 | 799 | 786 | 160.1 |
| A | 3 | 137 | 5910 | 32.0 | 799 | 786 | 160.1 |
| A | 12 | 194 | 5826 | 31.47 | 799 | 786 | 160.1 |
| B | 12 | 111 | 17622 | 112.19 | 802 | 785 | 150.1 |
| B | 11 | 111 | 15326 | 96.89 | 802 | 785 | 150.1 |
| B | 0 | 182 | 13500 | 84.73 | 802 | 785 | 150.1 |
| C | 14 | 238 | 117616 | 668.71 | 758 | 764 | 174.7 |
| C | 3 | 233 | 22136 | 122.31 | 758 | 764 | 174.7 |
| C | 13 | 61 | 5431 | 26.71 | 758 | 764 | 174.7 |
| D | 13 | 189 | 466319 | 2554.79 | 751 | 728 | 182.2 |
| D | 11 | 176 | 253095 | 1384.79 | 751 | 728 | 182.2 |
| D | 10 | 70 | 238746 | 1306.05 | 751 | 728 | 182.2 |
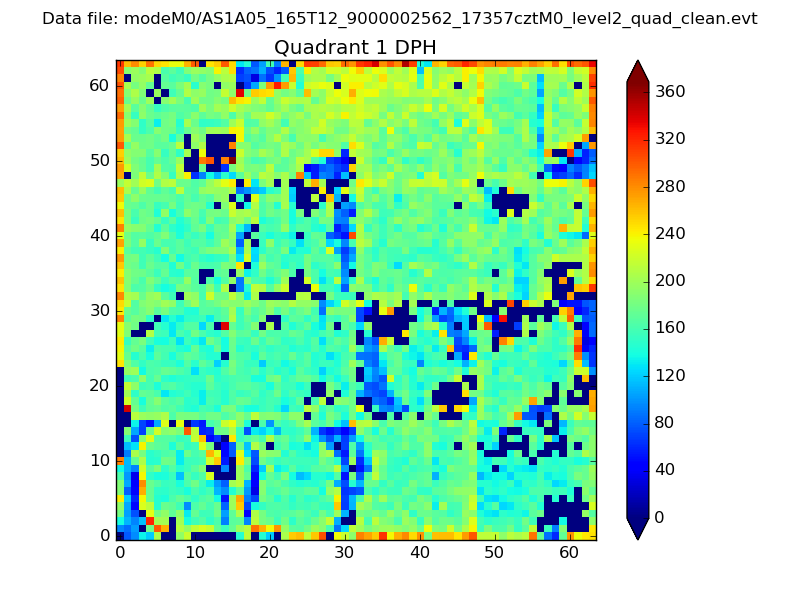
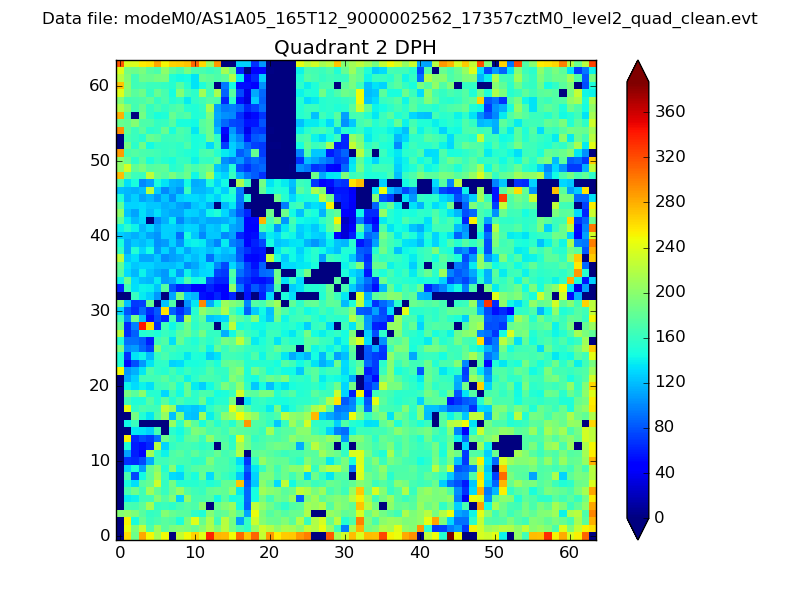
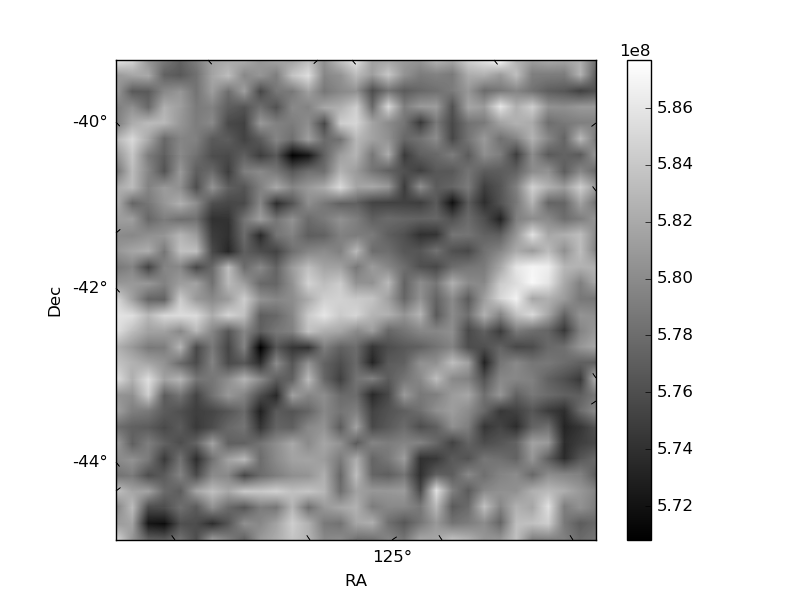
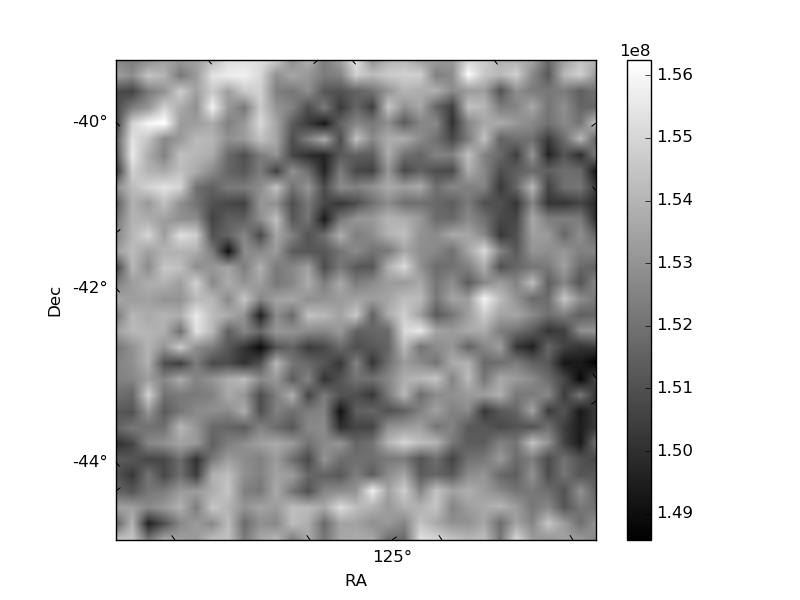
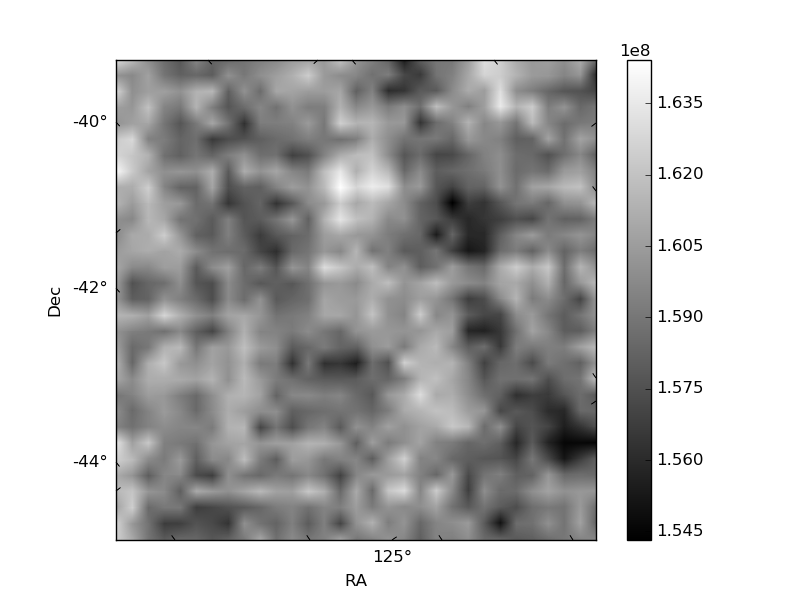
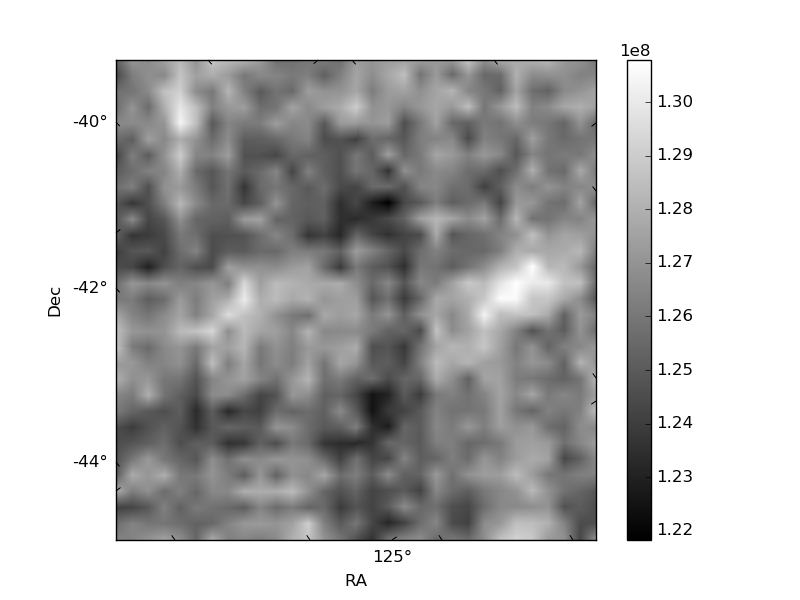
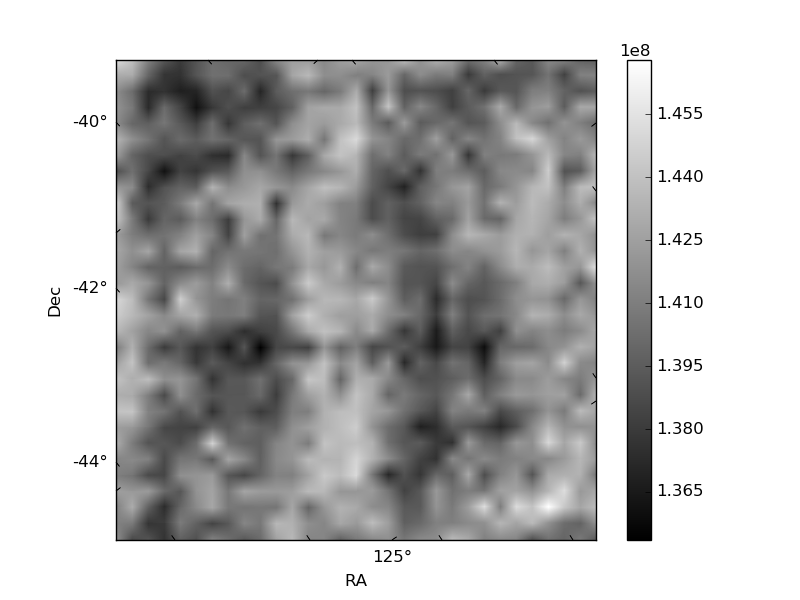
Histogram calculated using DETX and DETY for each event in the final _common_clean file
| Quadrant A | 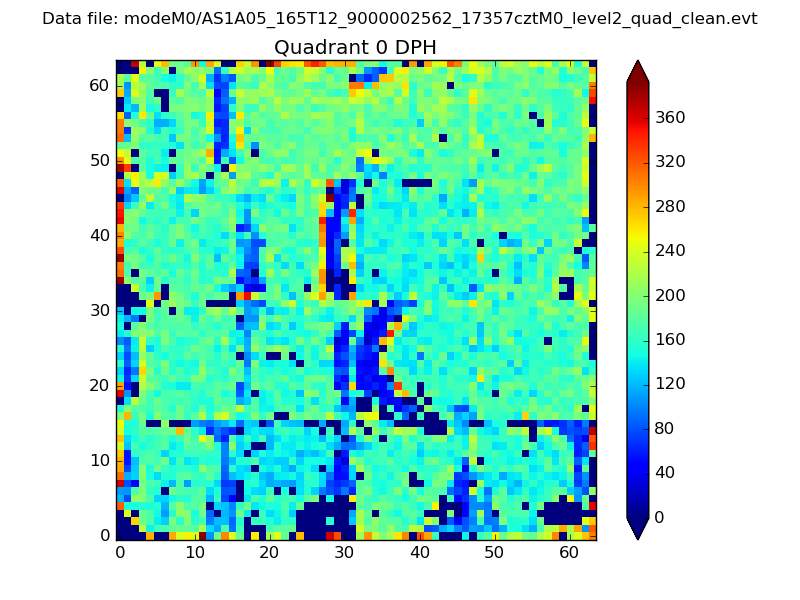 |
 |
Quadrant B |
|---|---|---|---|
| Quadrant D | 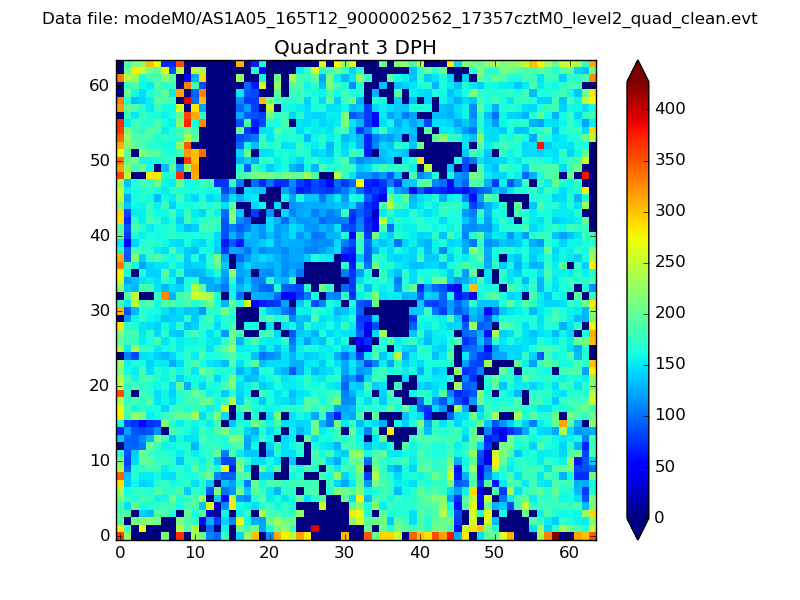 |
 |
Quadrant C |
| Plot type | Count rate plots | Images |
|---|---|---|
| Comparison with Poisson distribution Blue bars denote a histogram of data divided into 1 sec bins. Red curve is a Poisson curve with rate = median count rate of data. |
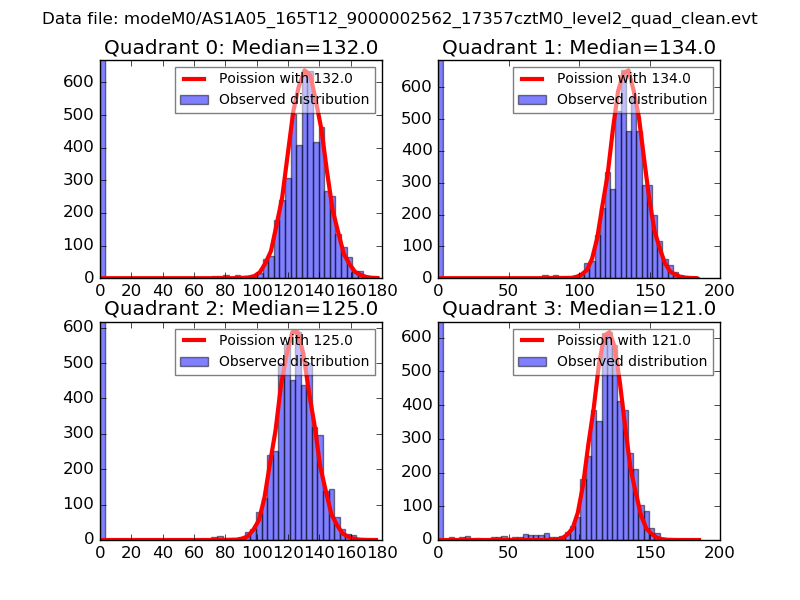 |
 |
| Quadrant-wise count rates Data is divided into 100 sec bins |
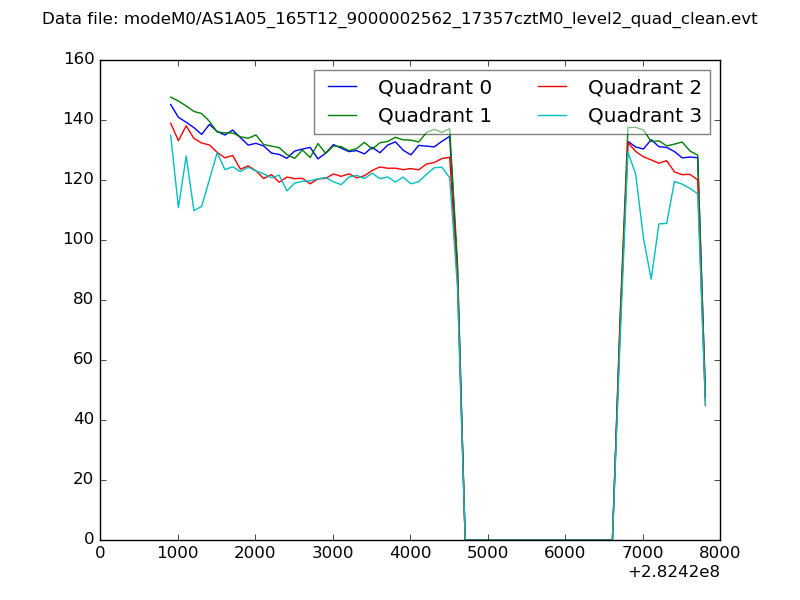 |
|
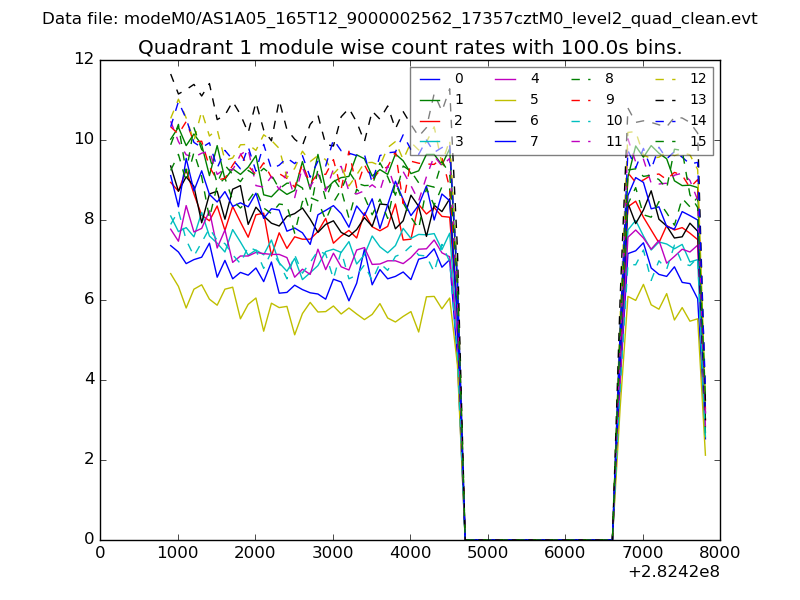
| Module-wise count rates for Quadrant A Data is divided into 100 sec bins |
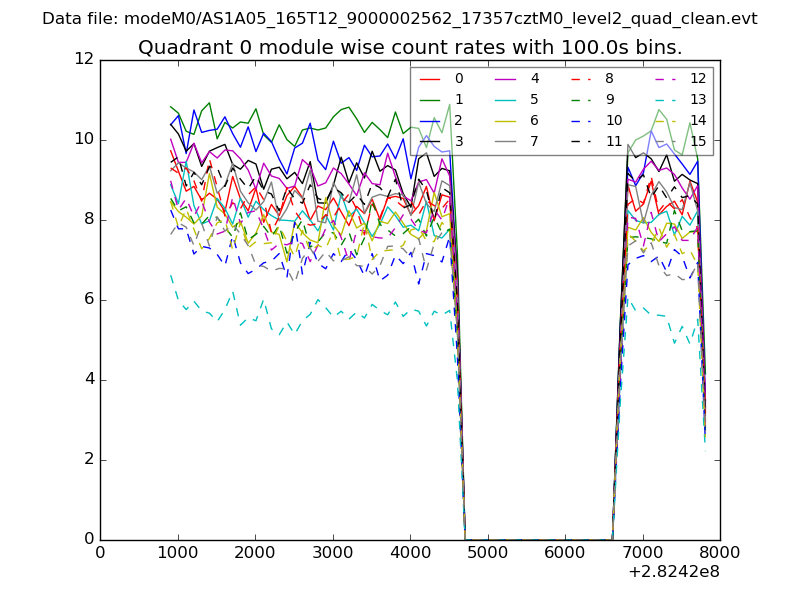 |
 |
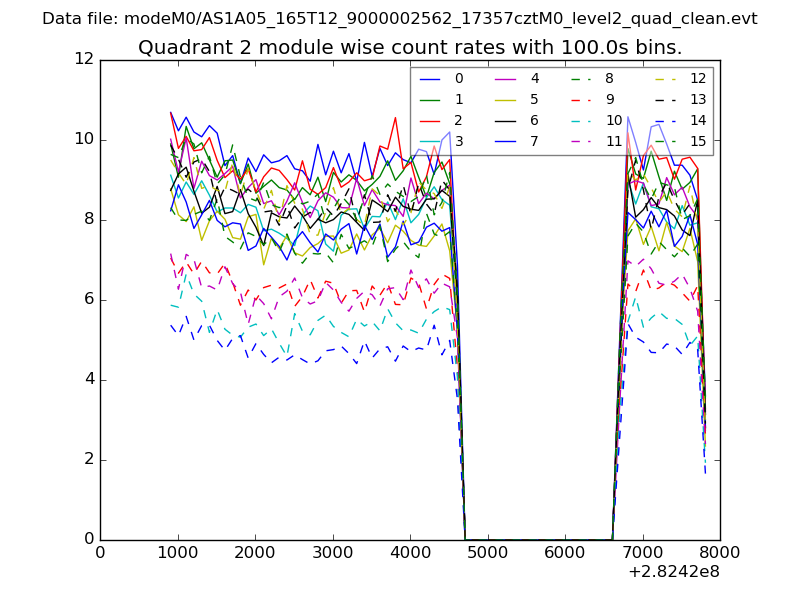
| Module-wise count rates for Quadrant B Data is divided into 100 sec bins |
 |
 |
| Module-wise count rates for Quadrant C Data is divided into 100 sec bins |
 |
 |
| Module-wise count rates for Quadrant D Data is divided into 100 sec bins |
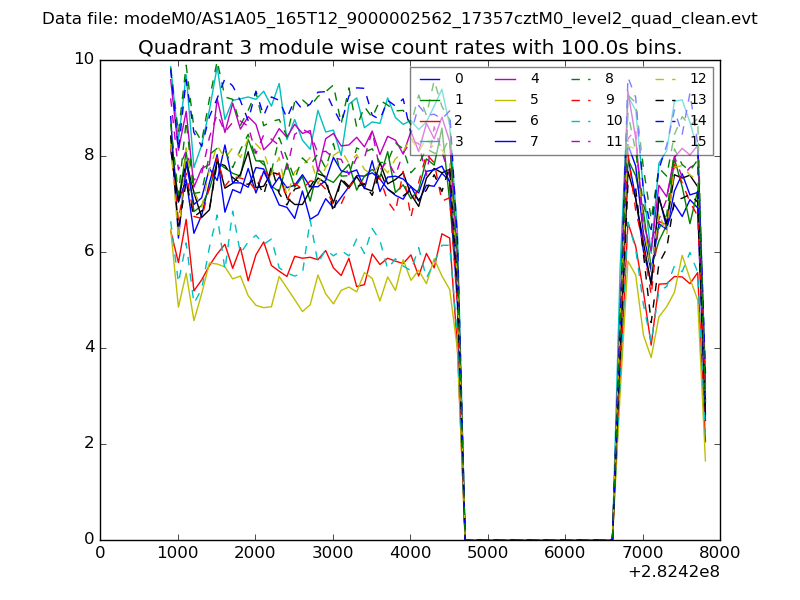 |
 |
| Parameter | Plot |
|---|---|
| CZT HV Monitor | 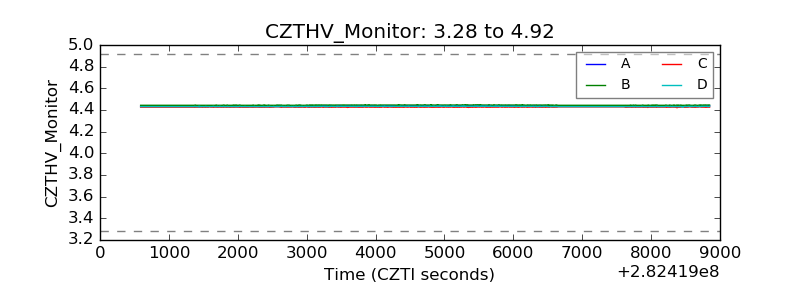 |
| D_VDD | 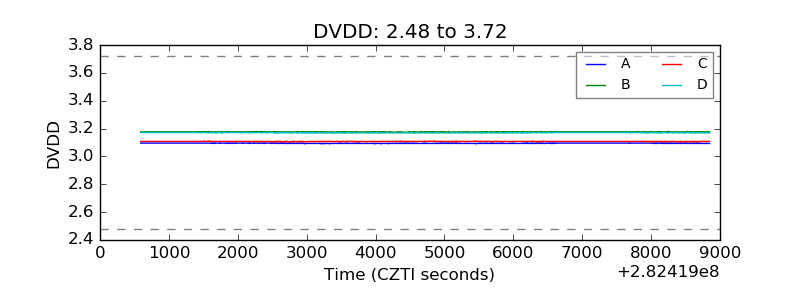 |
| Temperature 1 | 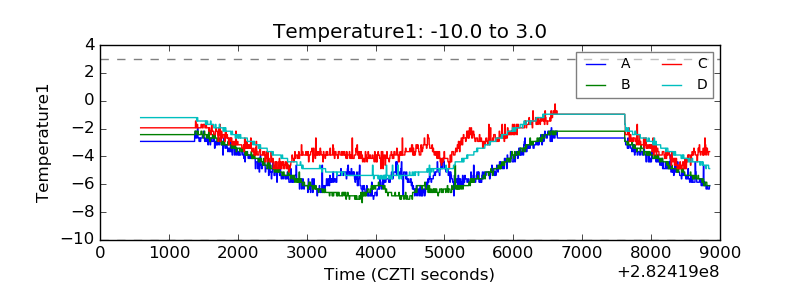 |
| Veto HV Monitor | 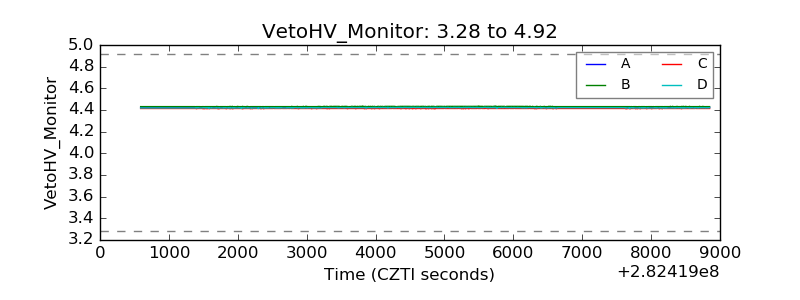 |
| Veto LLD |  |
| Alpha Counter | 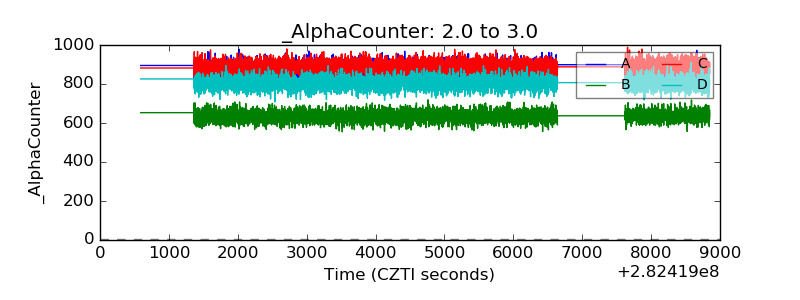 |
| _CPM_Rate | 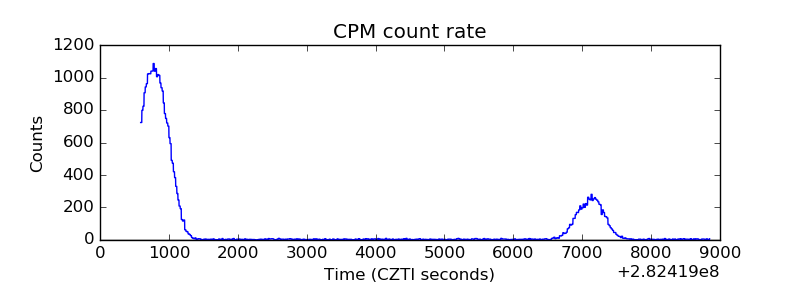 |
| CZT Counter | 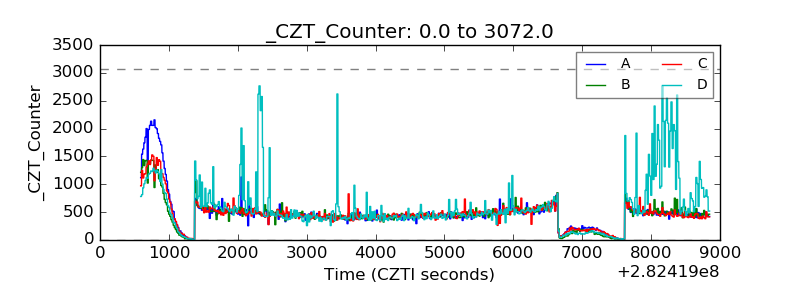 |
| +2.5 Volts monitor |  |
| +5 Volts monitor |  |
| _ROLL_ROT | 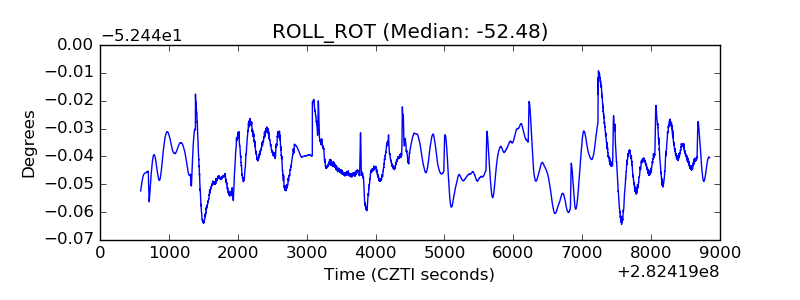 |
| _Roll_DEC | 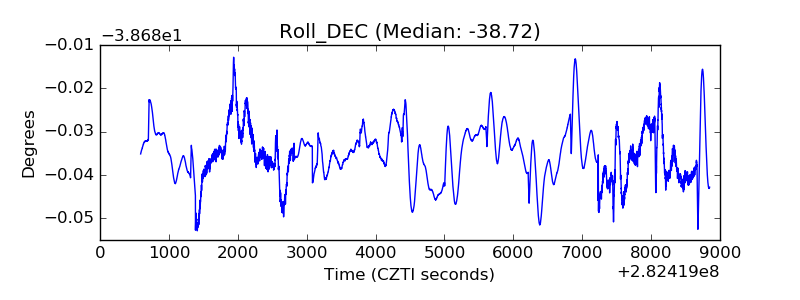 |
| _Roll_RA | 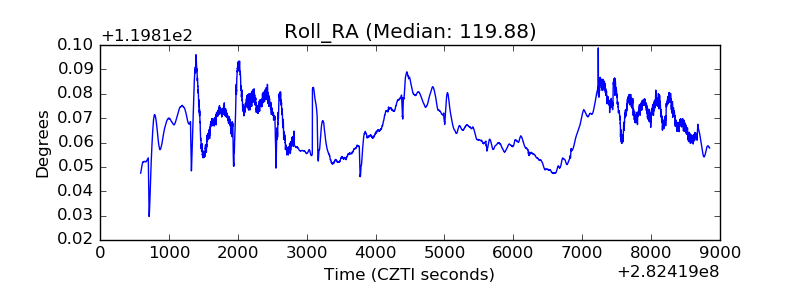 |
| Veto Counter | 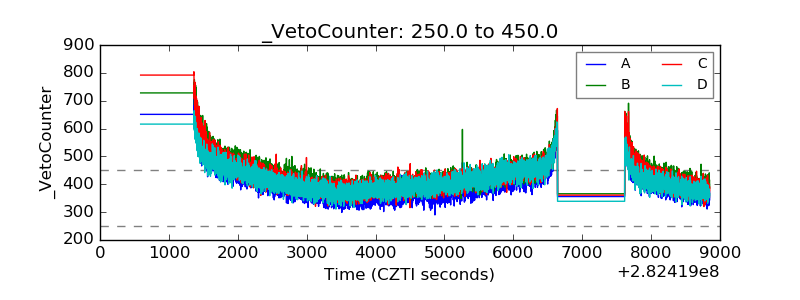 |