| Param | Original file | Final file |
|---|---|---|
| Filename | modeM0/AS1A05_165T12_9000002562_17358cztM0_level2.evt | modeM0/AS1A05_165T12_9000002562_17358cztM0_level2_quad_clean.evt |
| Size (bytes) | 593,536,320 | 104,382,720 |
| Size | 566.0 MB | 99.5 MB |
| Events in quadrant A | 3,796,167 | 670,008 |
| Events in quadrant B | 3,895,122 | 680,501 |
| Events in quadrant C | 3,835,208 | 640,344 |
| Events in quadrant D | 5,901,177 | 608,871 |
| Mode M9 | |||
|---|---|---|---|
| Quadrant | BADHDUFLAG | Total packets | Discarded packets |
| A | 0 | 15 | 0 |
| B | 0 | 15 | 0 |
| C | 0 | 15 | 0 |
| D | 0 | 15 | 0 |
| Mode M0 | |||
|---|---|---|---|
| Quadrant | BADHDUFLAG | Total packets | Discarded packets |
| A | 0 | 16692 | 2 |
| B | 0 | 16848 | 2 |
| C | 0 | 16656 | 3 |
| D | 0 | 23017 | 2 |
| Mode SS | |||
|---|---|---|---|
| Quadrant | BADHDUFLAG | Total packets | Discarded packets |
| A | 0 | 166 | 0 |
| B | 0 | 166 | 0 |
| C | 0 | 166 | 0 |
| D | 0 | 166 | 0 |
| Quadrant | Total seconds | Saturated seconds | Saturation percentage |
|---|---|---|---|
| A | 8074 | 49 | 0.606886% |
| B | 8075 | 69 | 0.854489% |
| C | 8074 | 75 | 0.928908% |
| D | 8074 | 374 | 4.632153% |
Noise dominated data is calculated using 1-second bins in cleaned event files. If a bin has >2000 counts, and if more than 50% of those come from <1% of pixels, then it is considered to be noise-dominated and hence unusable.
| Quadrant | # 1 sec bins | Bins with >0 counts | Bins with >2000 counts | High rate bins dominated by noise | Noise dominated (total time) | Noise dominated (detector-on time) | Marked lightcurve |
|---|---|---|---|---|---|---|---|
| A | 9564 | 8076 | 0 | 0 | 0.00% | 0.00% | 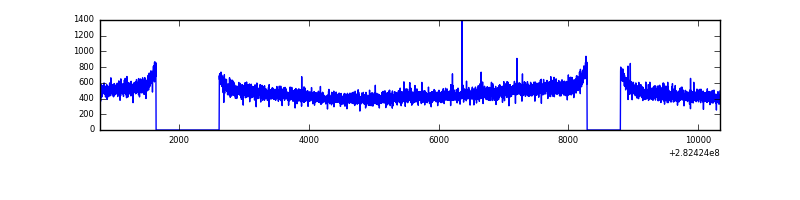 |
| B | 9565 | 8077 | 2 | 2 | 0.02% | 0.02% | 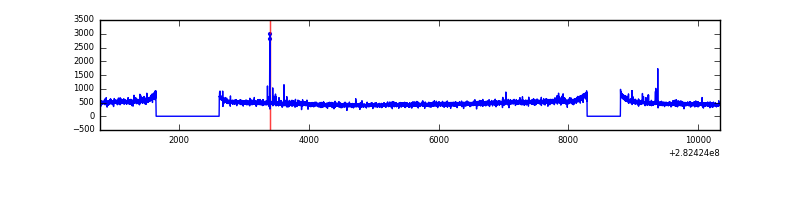 |
| C | 9564 | 8076 | 0 | 0 | 0.00% | 0.00% |  |
| D | 9564 | 8076 | 297 | 297 | 3.11% | 3.68% | 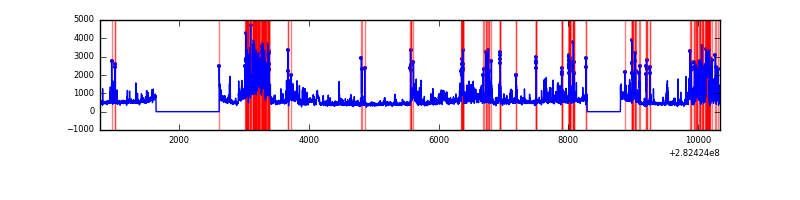 |
Top three noisy pixels from each quadrant. If the there are fewer than three noisy pixels in the level2.evt file, extra rows are filled as -1
| Pixel properties | Quadrant properties | ||||||
|---|---|---|---|---|---|---|---|
| Quadrant | DetID | PixID | Counts | Sigma | Mean | Median | Sigma |
| A | 0 | 226 | 8569 | 38.44 | 986 | 967 | 197.8 |
| A | 3 | 137 | 7436 | 32.71 | 986 | 967 | 197.8 |
| A | 12 | 194 | 7118 | 31.1 | 986 | 967 | 197.8 |
| B | 12 | 111 | 22383 | 113.73 | 987 | 962 | 188.3 |
| B | 11 | 111 | 19369 | 97.73 | 987 | 962 | 188.3 |
| B | 14 | 111 | 16327 | 81.58 | 987 | 962 | 188.3 |
| C | 14 | 238 | 144570 | 653.77 | 941 | 946 | 219.7 |
| C | 3 | 233 | 17937 | 77.34 | 941 | 946 | 219.7 |
| C | 13 | 61 | 6578 | 25.64 | 941 | 946 | 219.7 |
| D | 5 | 222 | 687014 | 3038.21 | 931 | 904 | 225.8 |
| D | 13 | 189 | 515140 | 2277.12 | 931 | 904 | 225.8 |
| D | 13 | 232 | 422951 | 1868.89 | 931 | 904 | 225.8 |
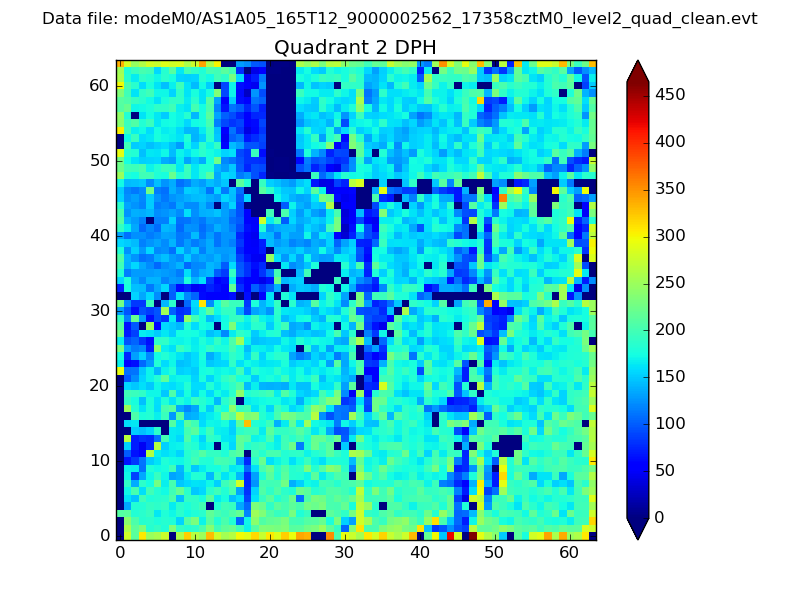
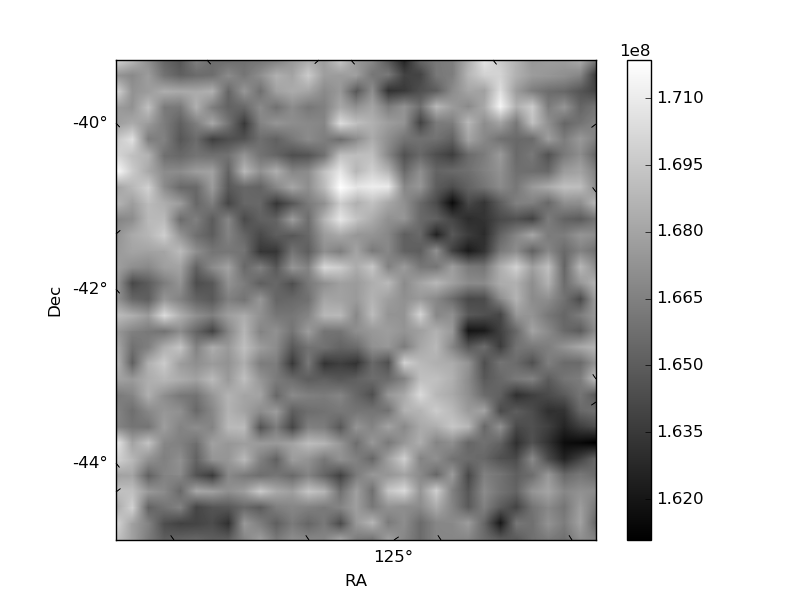
Histogram calculated using DETX and DETY for each event in the final _common_clean file
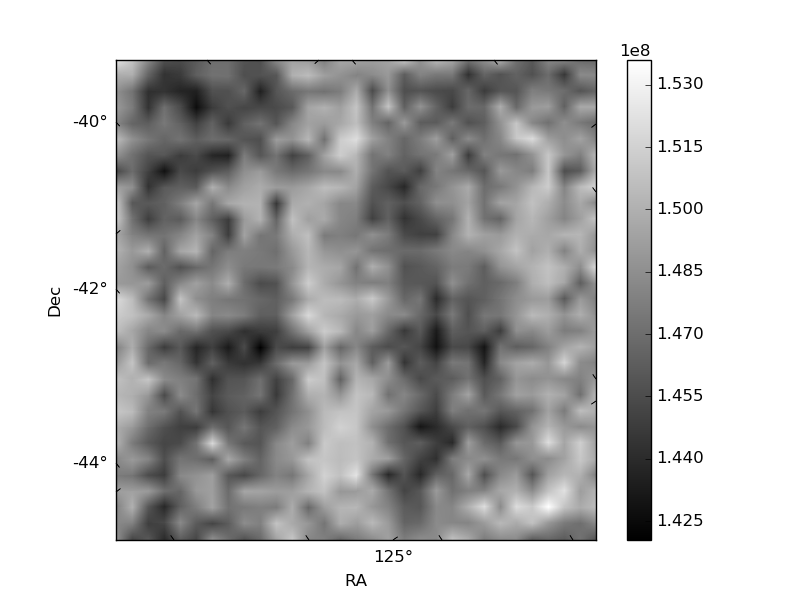
| Quadrant A | 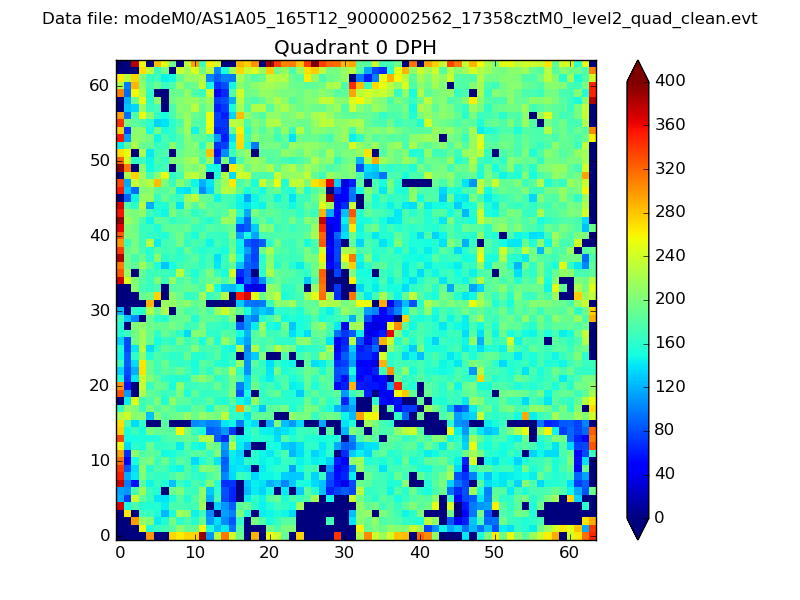 |
 |
Quadrant B |
|---|---|---|---|
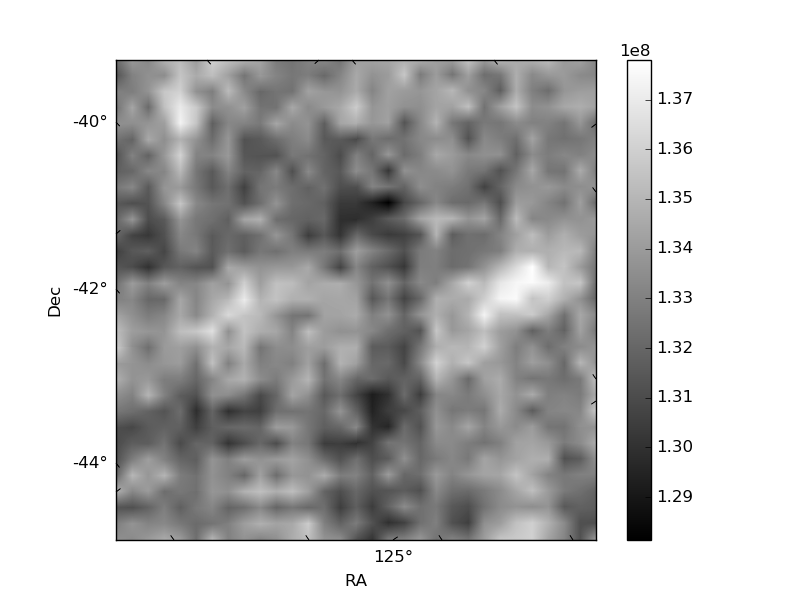
| Quadrant D | 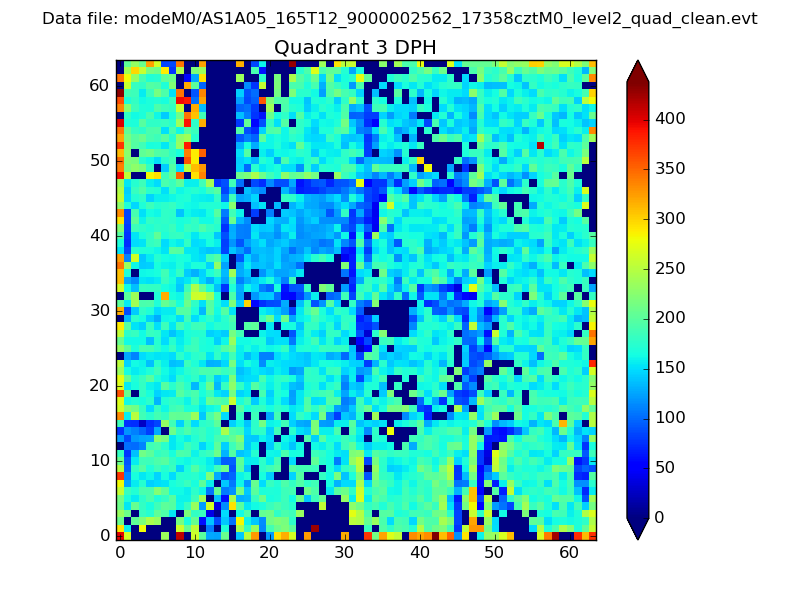 |
 |
Quadrant C |
| Plot type | Count rate plots | Images |
|---|---|---|
| Comparison with Poisson distribution Blue bars denote a histogram of data divided into 1 sec bins. Red curve is a Poisson curve with rate = median count rate of data. |
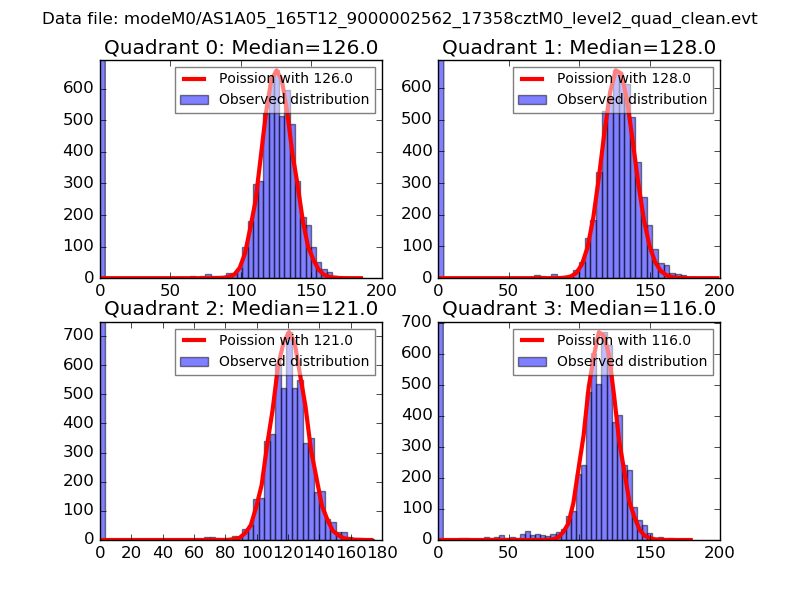 |
 |
| Quadrant-wise count rates Data is divided into 100 sec bins |
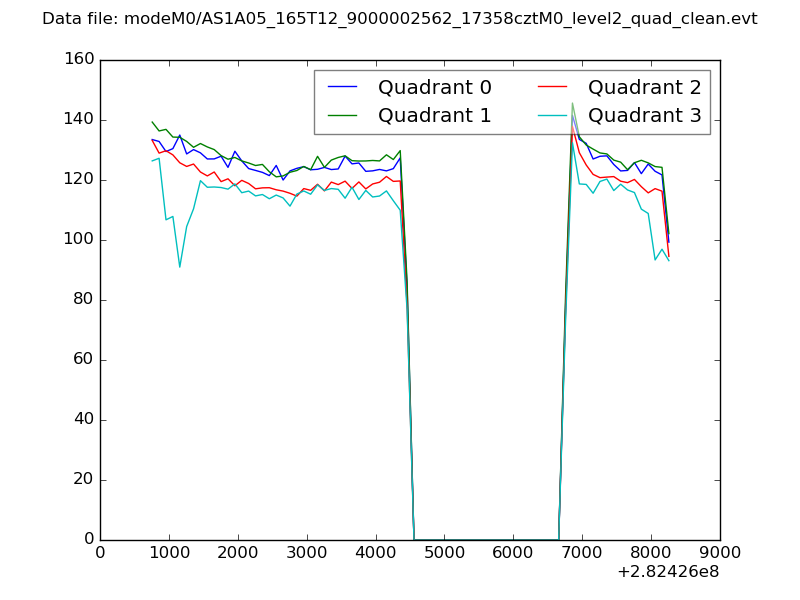 |
|
| Module-wise count rates for Quadrant A Data is divided into 100 sec bins |
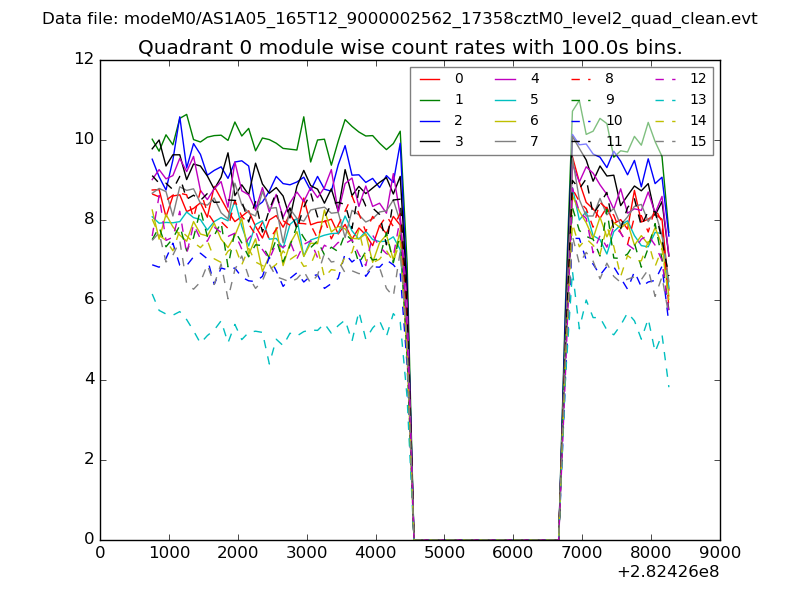 |
 |
| Module-wise count rates for Quadrant B Data is divided into 100 sec bins |
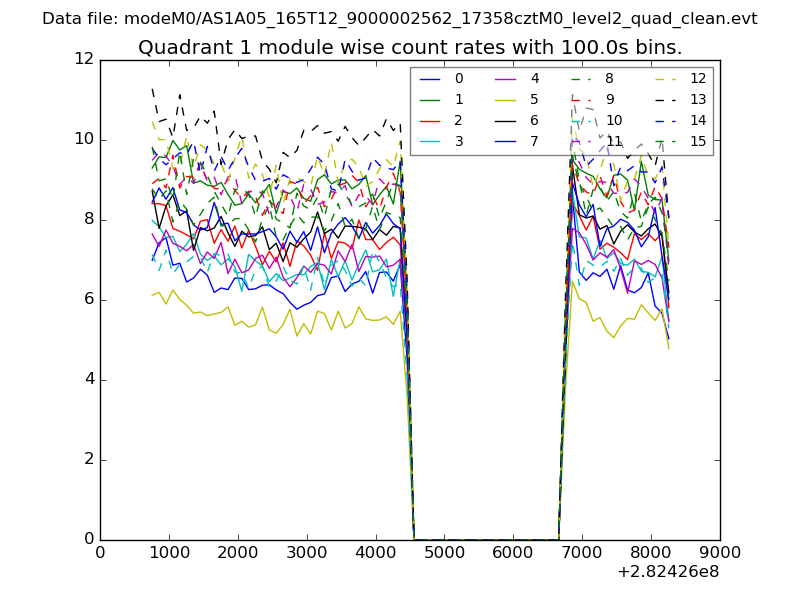 |
 |
| Module-wise count rates for Quadrant C Data is divided into 100 sec bins |
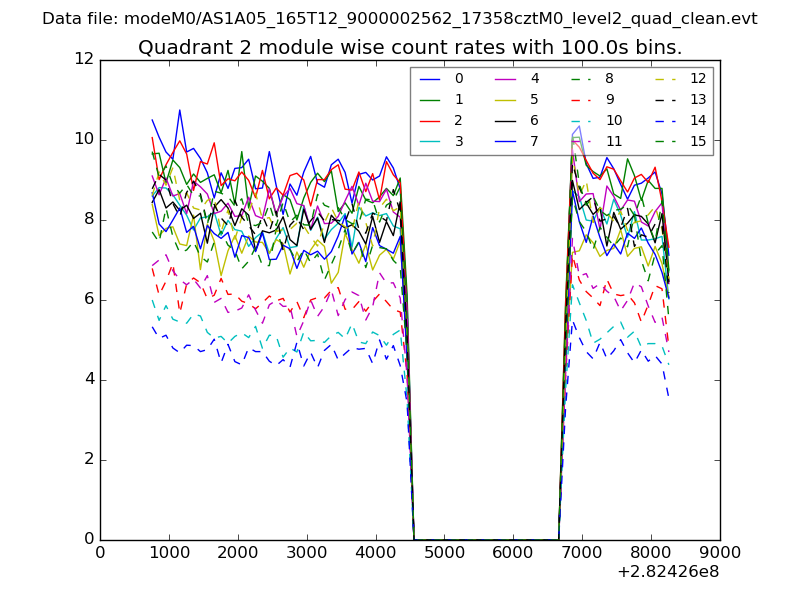 |
 |
| Module-wise count rates for Quadrant D Data is divided into 100 sec bins |
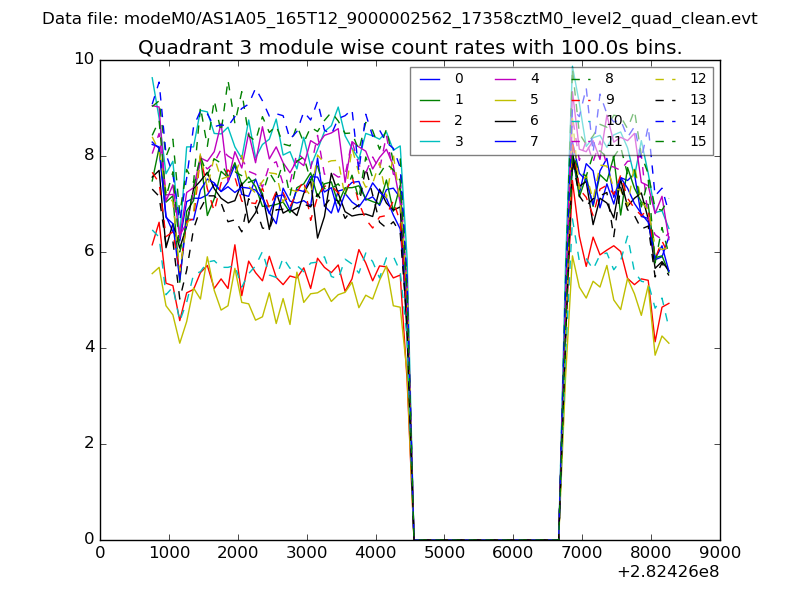 |
 |
| Parameter | Plot |
|---|---|
| CZT HV Monitor | 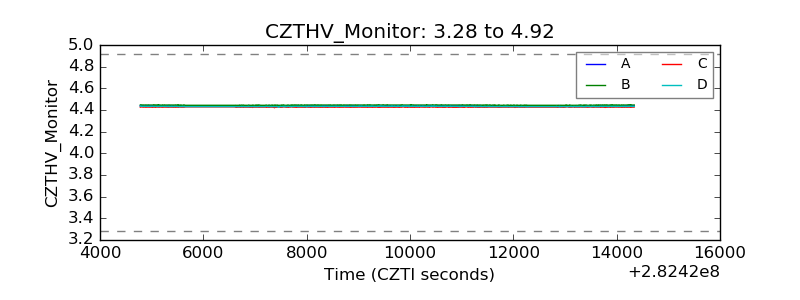 |
| D_VDD | 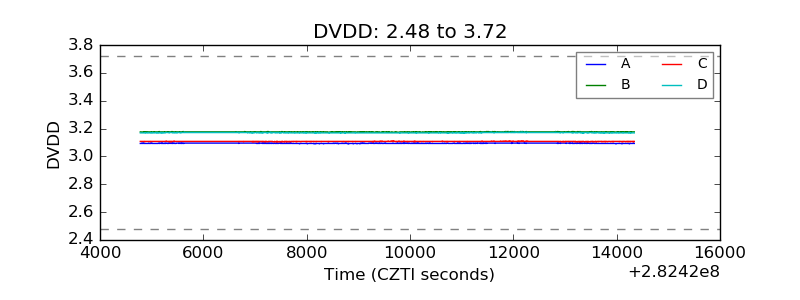 |
| Temperature 1 | 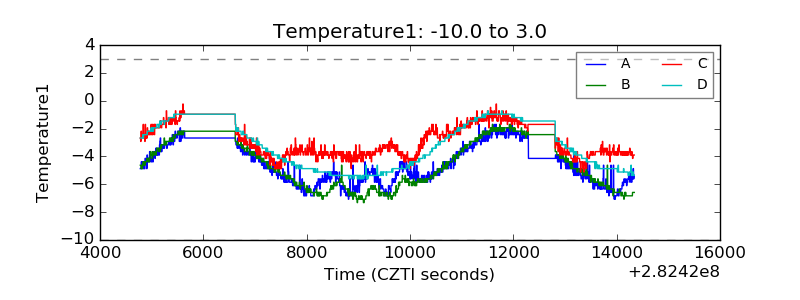 |
| Veto HV Monitor | 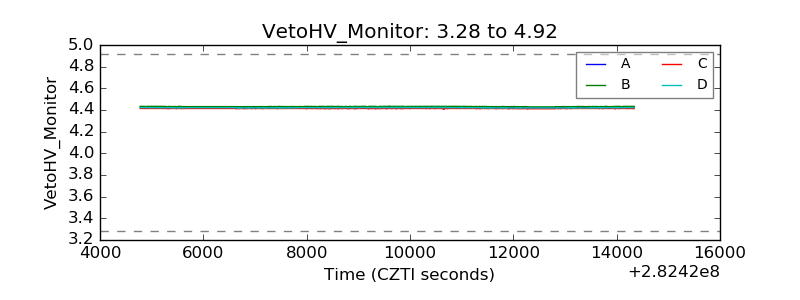 |
| Veto LLD | 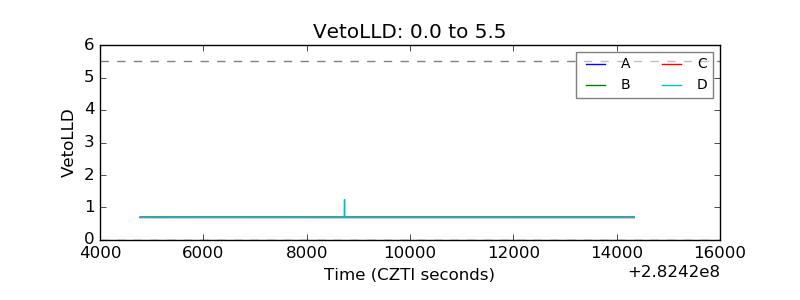 |
| Alpha Counter | 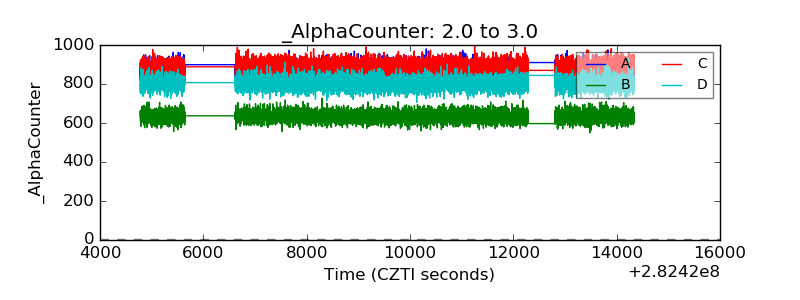 |
| _CPM_Rate | 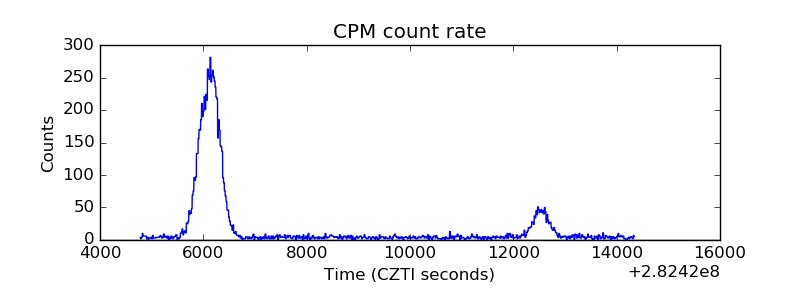 |
| CZT Counter | 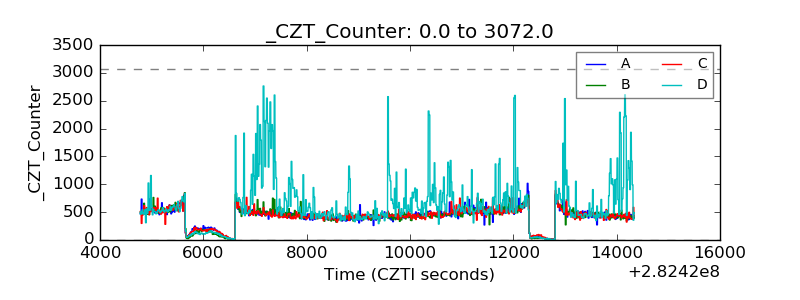 |
| +2.5 Volts monitor |  |
| +5 Volts monitor | 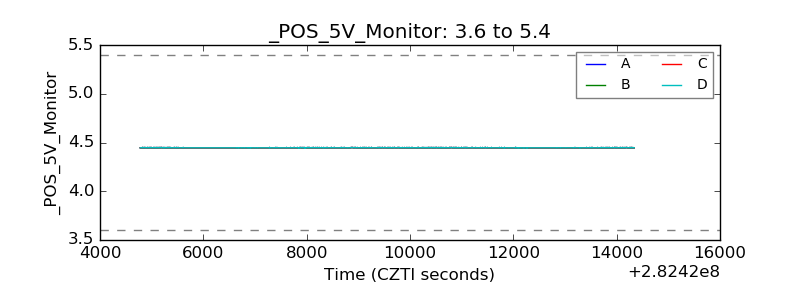 |
| _ROLL_ROT | 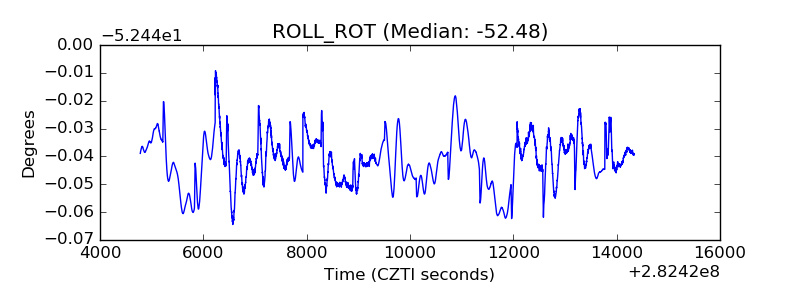 |
| _Roll_DEC | 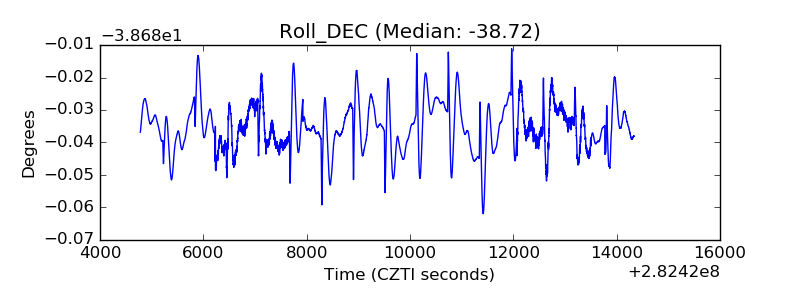 |
| _Roll_RA | 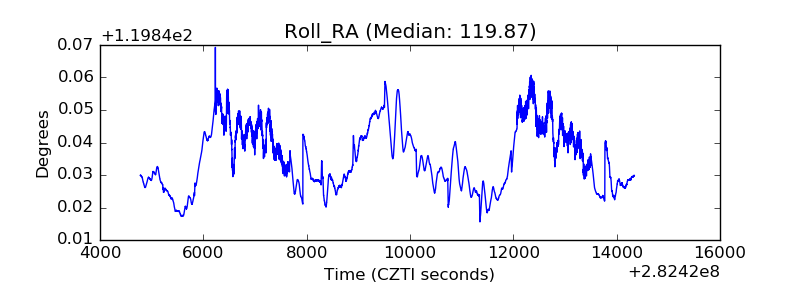 |
| Veto Counter | 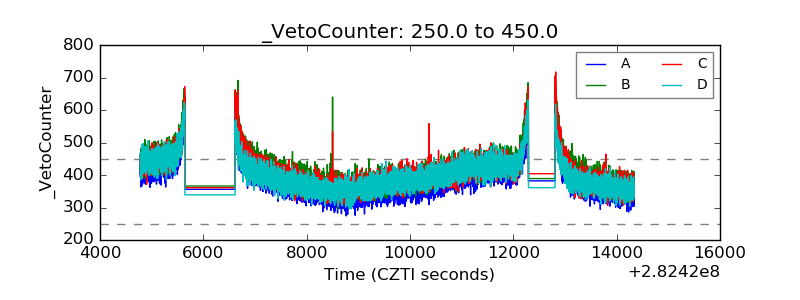 |