| Param | Original file | Final file |
|---|---|---|
| Filename | modeM0/AS1A05_165T12_9000002562_17359cztM0_level2.evt | modeM0/AS1A05_165T12_9000002562_17359cztM0_level2_quad_clean.evt |
| Size (bytes) | 645,612,480 | 111,421,440 |
| Size | 615.7 MB | 106.3 MB |
| Events in quadrant A | 3,865,150 | 721,239 |
| Events in quadrant B | 3,986,773 | 730,132 |
| Events in quadrant C | 3,943,913 | 689,673 |
| Events in quadrant D | 7,189,594 | 651,746 |
| Mode M9 | |||
|---|---|---|---|
| Quadrant | BADHDUFLAG | Total packets | Discarded packets |
| A | 0 | 7 | 0 |
| B | 0 | 7 | 0 |
| C | 0 | 7 | 0 |
| D | 0 | 7 | 0 |
| Mode M0 | |||
|---|---|---|---|
| Quadrant | BADHDUFLAG | Total packets | Discarded packets |
| A | 0 | 17300 | 2 |
| B | 0 | 17499 | 2 |
| C | 0 | 17289 | 3 |
| D | 0 | 27186 | 2 |
| Mode SS | |||
|---|---|---|---|
| Quadrant | BADHDUFLAG | Total packets | Discarded packets |
| A | 0 | 172 | 0 |
| B | 0 | 172 | 0 |
| C | 0 | 172 | 0 |
| D | 0 | 172 | 0 |
| Quadrant | Total seconds | Saturated seconds | Saturation percentage |
|---|---|---|---|
| A | 8368 | 35 | 0.418260% |
| B | 8369 | 78 | 0.932011% |
| C | 8368 | 82 | 0.979924% |
| D | 8368 | 561 | 6.704111% |
Noise dominated data is calculated using 1-second bins in cleaned event files. If a bin has >2000 counts, and if more than 50% of those come from <1% of pixels, then it is considered to be noise-dominated and hence unusable.
| Quadrant | # 1 sec bins | Bins with >0 counts | Bins with >2000 counts | High rate bins dominated by noise | Noise dominated (total time) | Noise dominated (detector-on time) | Marked lightcurve |
|---|---|---|---|---|---|---|---|
| A | 9123 | 8370 | 0 | 0 | 0.00% | 0.00% | 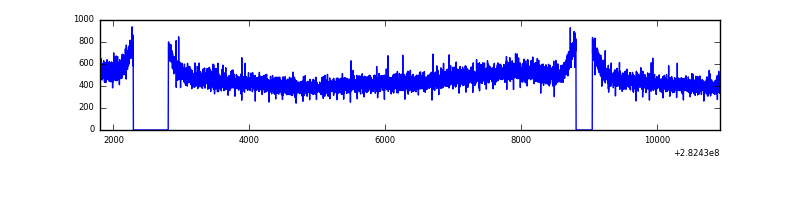 |
| B | 9124 | 8371 | 0 | 0 | 0.00% | 0.00% | 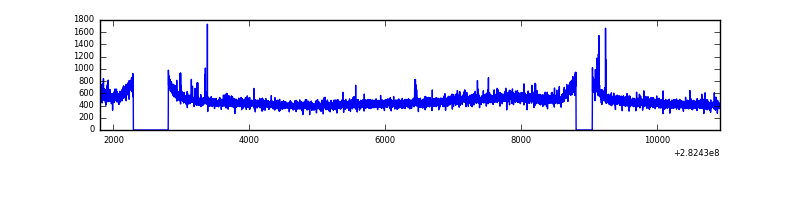 |
| C | 9123 | 8370 | 0 | 0 | 0.00% | 0.00% | 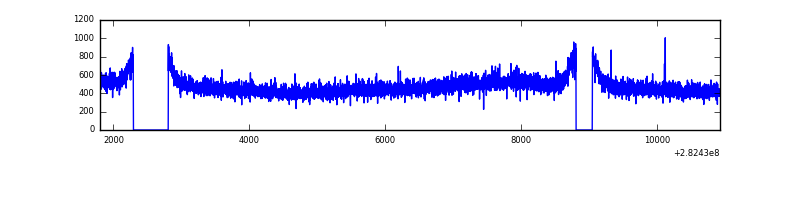 |
| D | 9123 | 8370 | 479 | 479 | 5.25% | 5.72% | 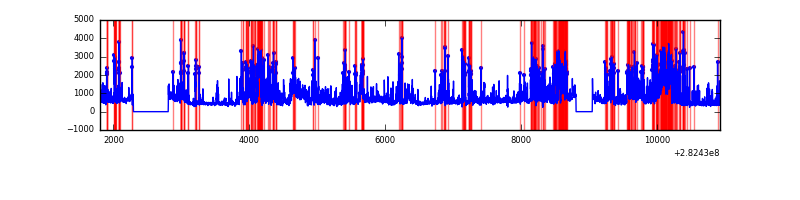 |
Top three noisy pixels from each quadrant. If the there are fewer than three noisy pixels in the level2.evt file, extra rows are filled as -1
| Pixel properties | Quadrant properties | ||||||
|---|---|---|---|---|---|---|---|
| Quadrant | DetID | PixID | Counts | Sigma | Mean | Median | Sigma |
| A | 0 | 226 | 8926 | 38.79 | 1005 | 984 | 204.8 |
| A | 3 | 137 | 7573 | 32.18 | 1005 | 984 | 204.8 |
| A | 12 | 194 | 7158 | 30.15 | 1005 | 984 | 204.8 |
| B | 12 | 111 | 23298 | 114.69 | 1009 | 982 | 194.6 |
| B | 11 | 111 | 20062 | 98.06 | 1009 | 982 | 194.6 |
| B | 4 | 216 | 17573 | 85.27 | 1009 | 982 | 194.6 |
| C | 14 | 238 | 148813 | 651.69 | 963 | 967 | 226.9 |
| C | 3 | 233 | 26709 | 113.47 | 963 | 967 | 226.9 |
| C | 0 | 79 | 7611 | 29.28 | 963 | 967 | 226.9 |
| D | 5 | 222 | 1736951 | 7485.74 | 945 | 917 | 231.9 |
| D | 13 | 232 | 1243020 | 5355.92 | 945 | 917 | 231.9 |
| D | 13 | 189 | 270028 | 1160.4 | 945 | 917 | 231.9 |
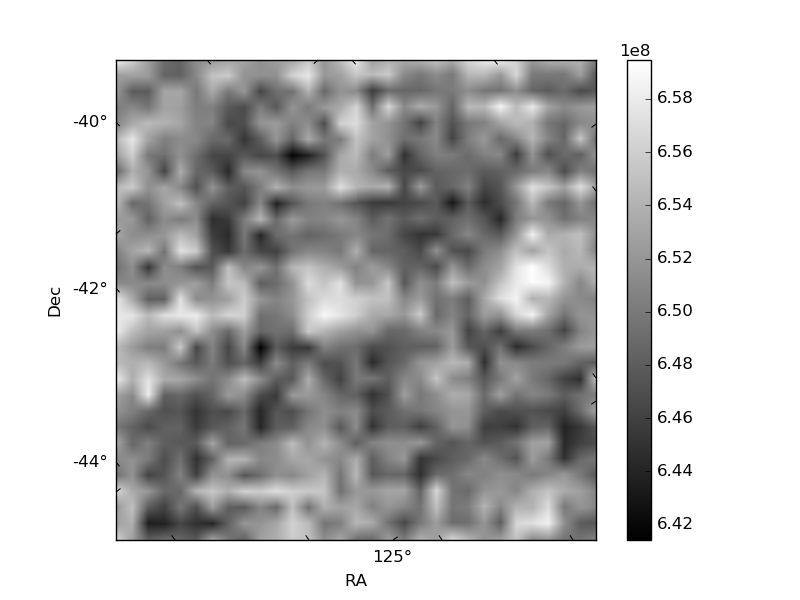
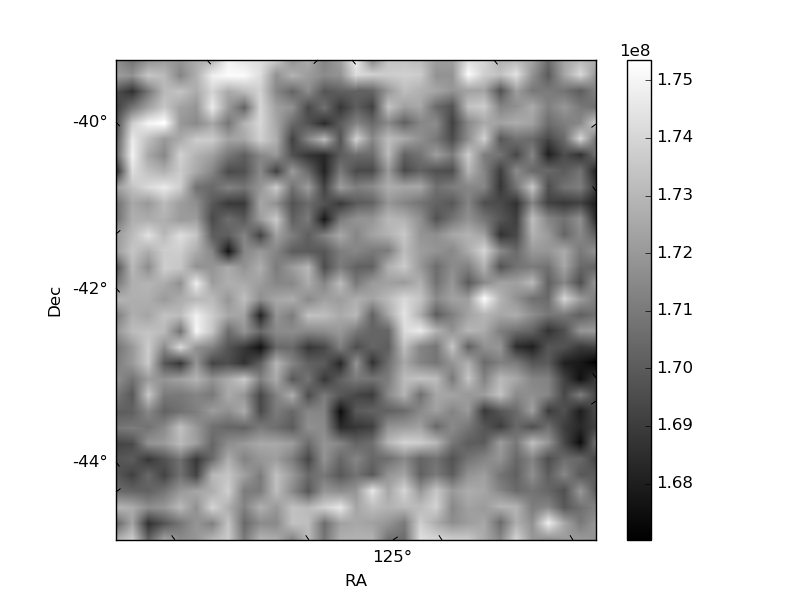
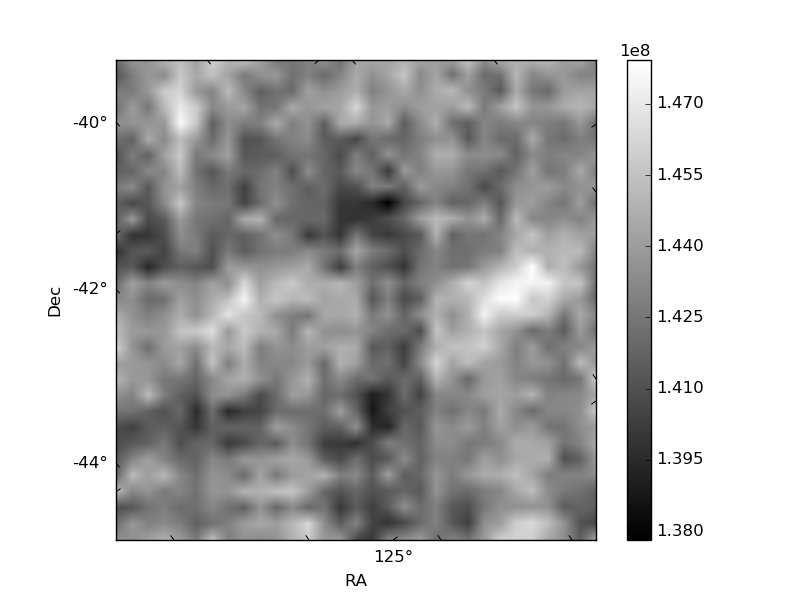
Histogram calculated using DETX and DETY for each event in the final _common_clean file
| Quadrant A | 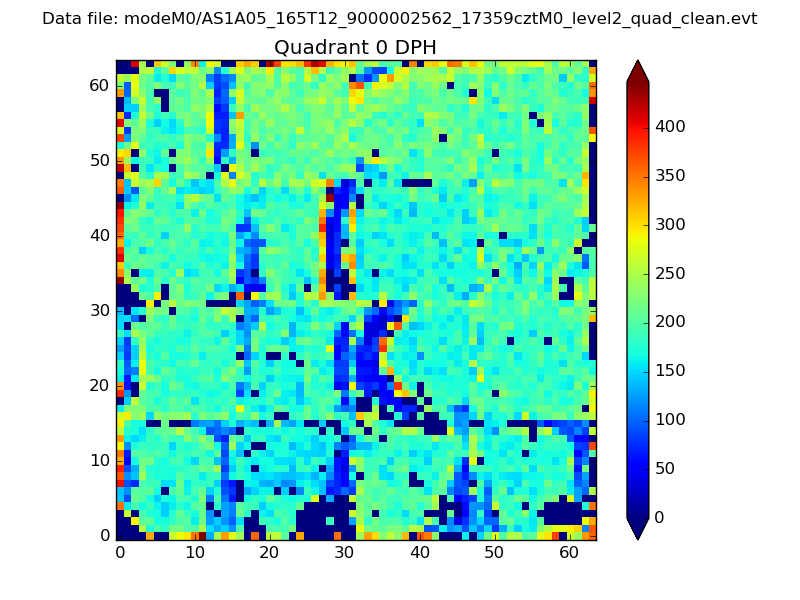 |
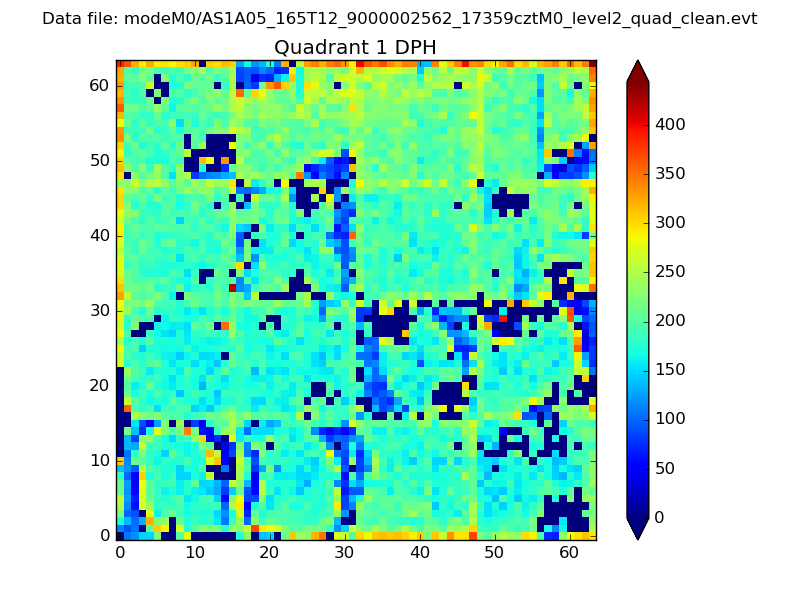 |
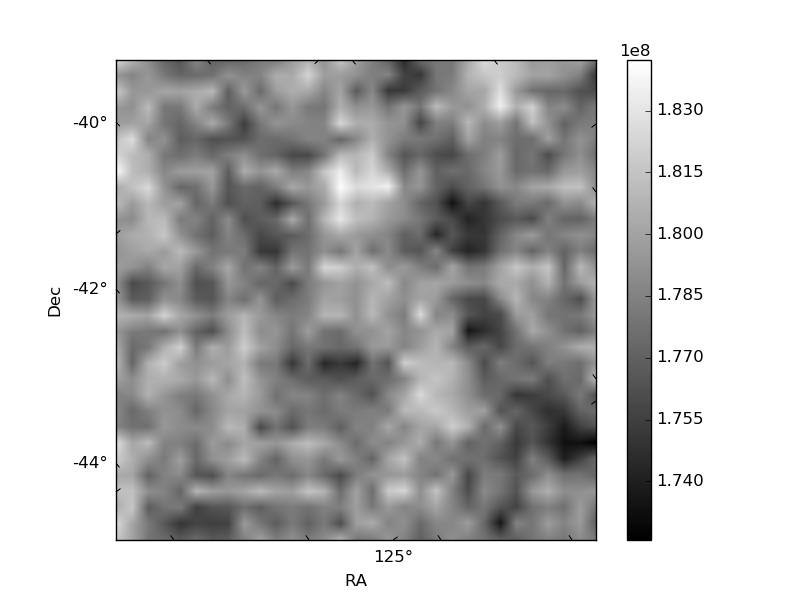
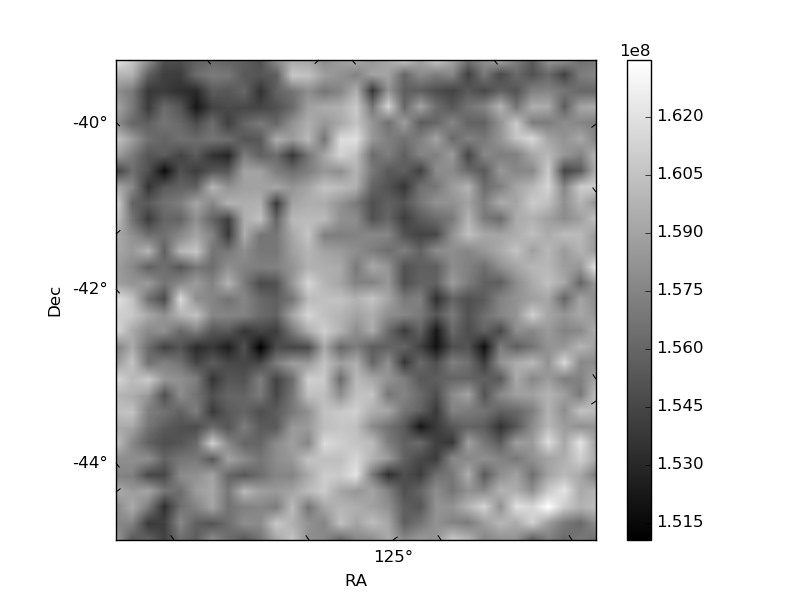
Quadrant B |
|---|---|---|---|
| Quadrant D | 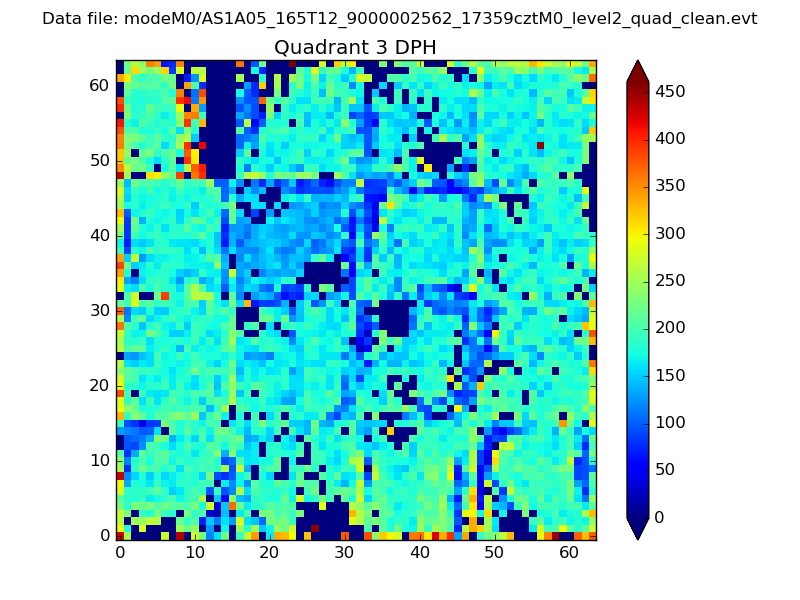 |
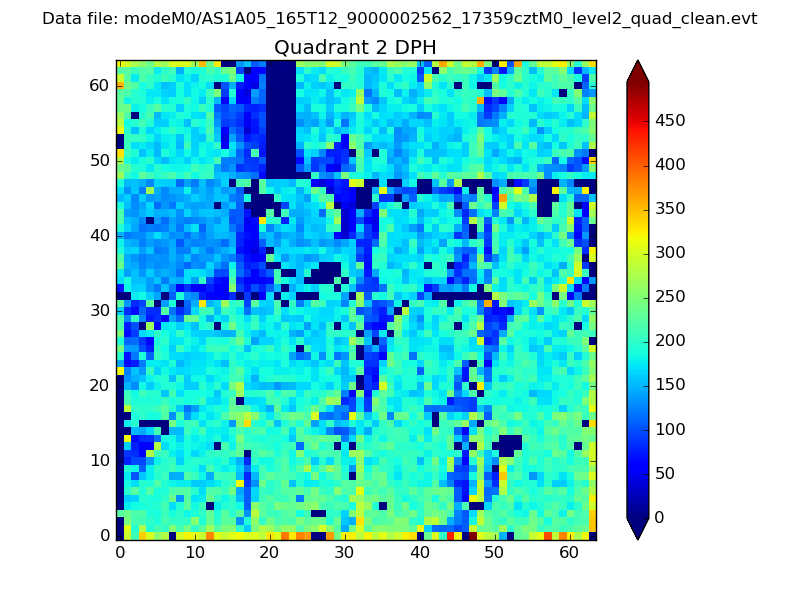 |
Quadrant C |
| Plot type | Count rate plots | Images |
|---|---|---|
| Comparison with Poisson distribution Blue bars denote a histogram of data divided into 1 sec bins. Red curve is a Poisson curve with rate = median count rate of data. |
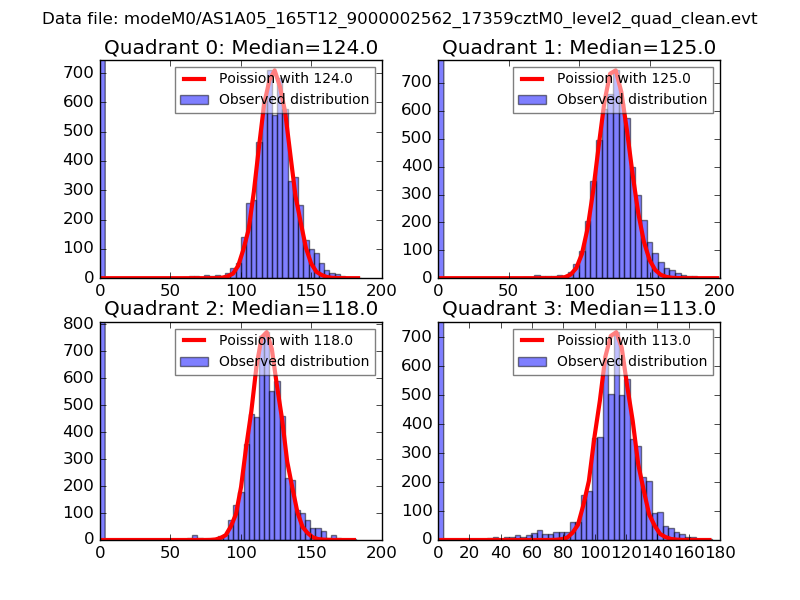 |
 |
| Quadrant-wise count rates Data is divided into 100 sec bins |
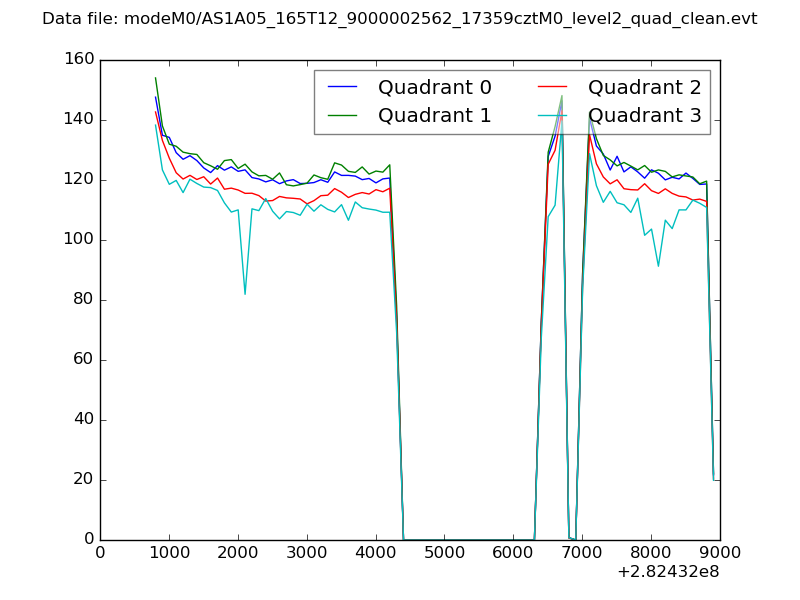 |
|
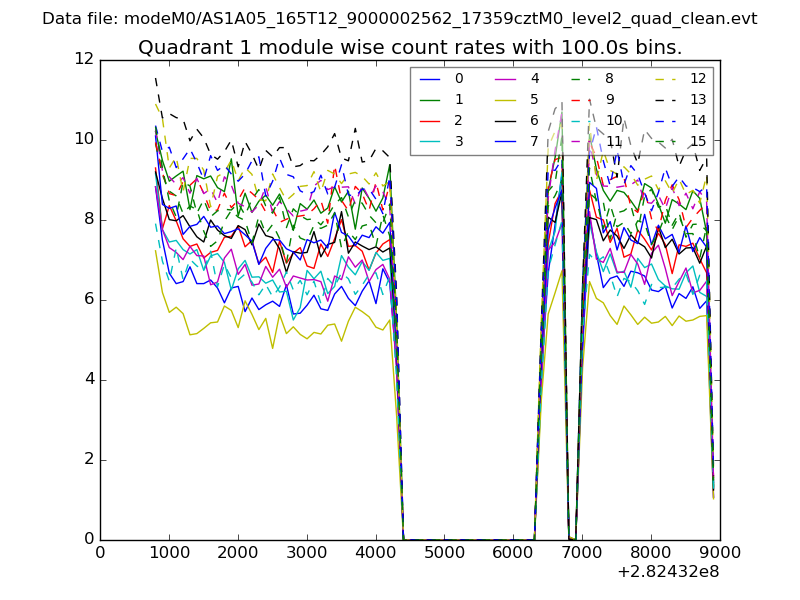
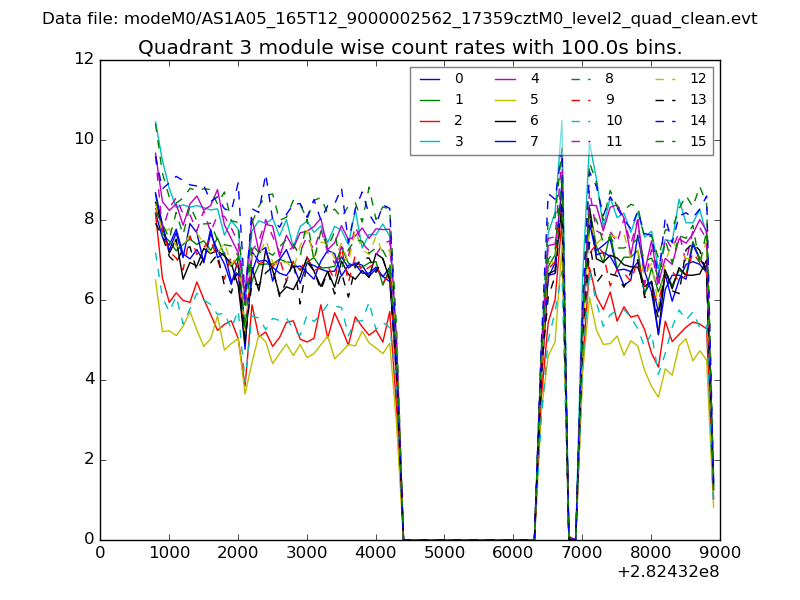
| Module-wise count rates for Quadrant A Data is divided into 100 sec bins |
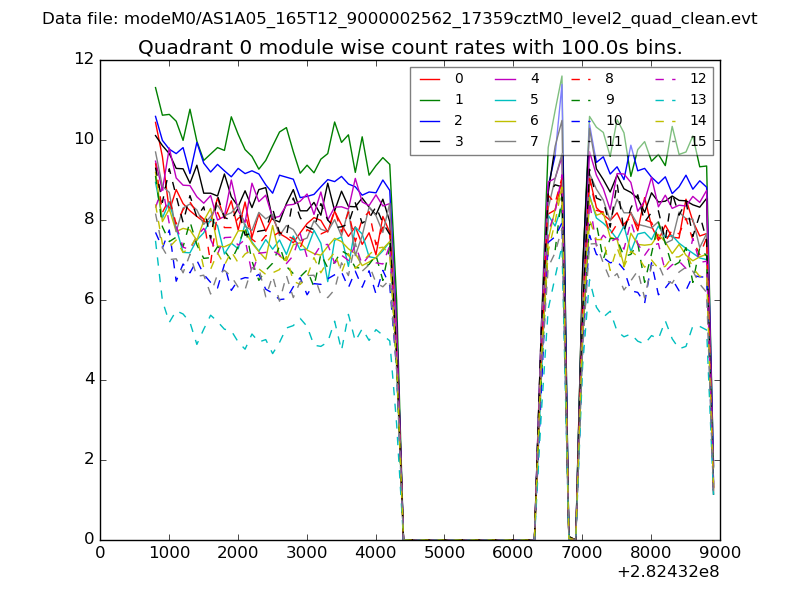 |
 |
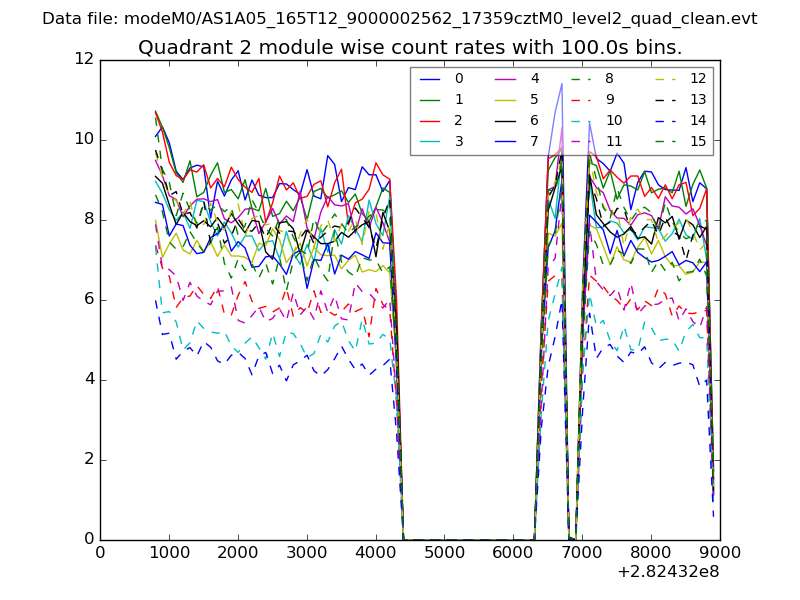
| Module-wise count rates for Quadrant B Data is divided into 100 sec bins |
 |
 |
| Module-wise count rates for Quadrant C Data is divided into 100 sec bins |
 |
 |
| Module-wise count rates for Quadrant D Data is divided into 100 sec bins |
 |
 |
| Parameter | Plot |
|---|---|
| CZT HV Monitor | 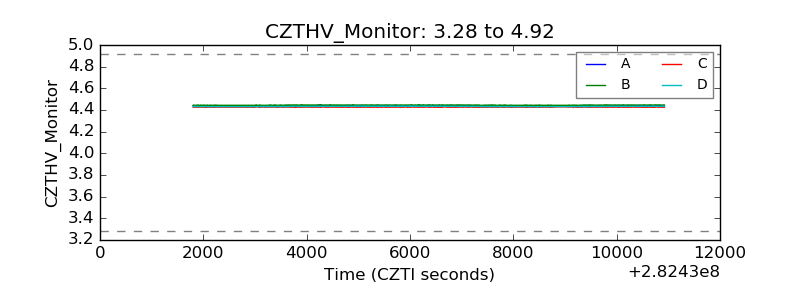 |
| D_VDD | 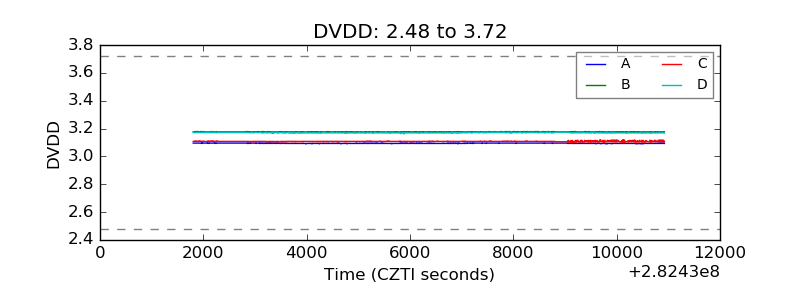 |
| Temperature 1 | 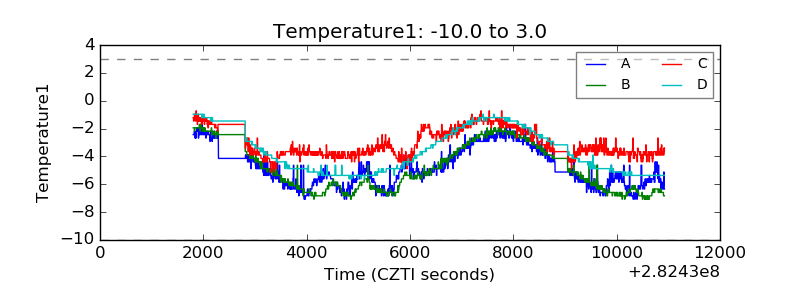 |
| Veto HV Monitor | 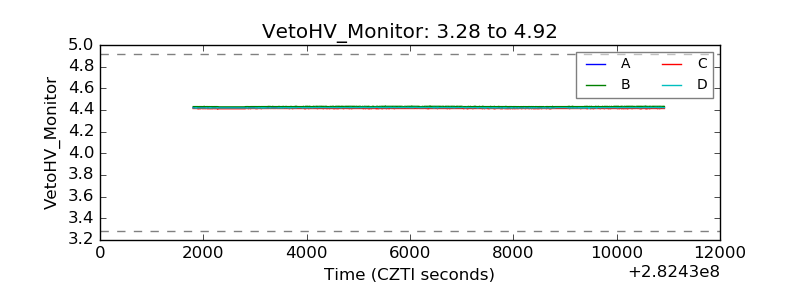 |
| Veto LLD | 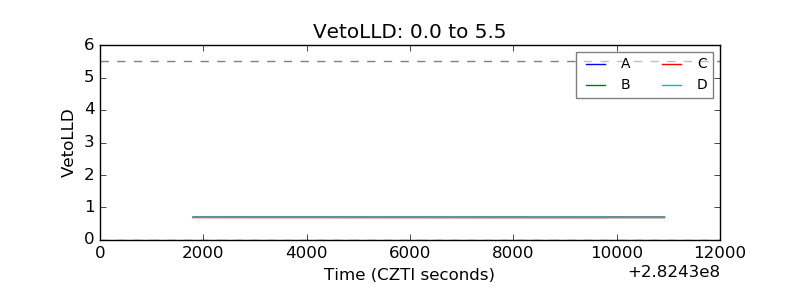 |
| Alpha Counter | 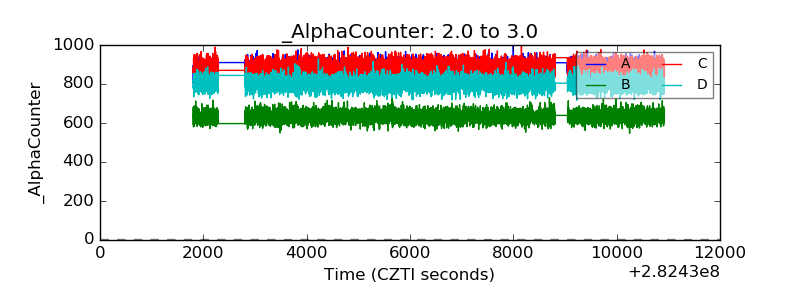 |
| _CPM_Rate | 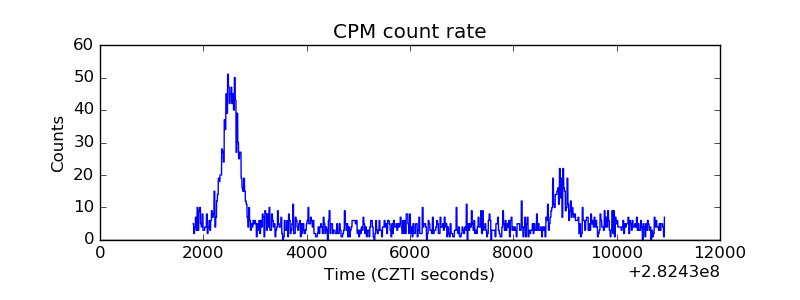 |
| CZT Counter | 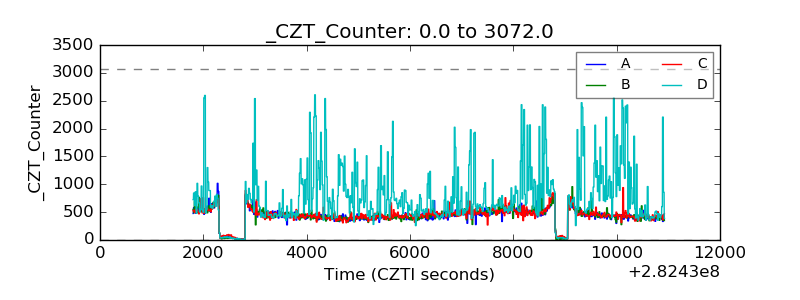 |
| +2.5 Volts monitor |  |
| +5 Volts monitor |  |
| _ROLL_ROT | 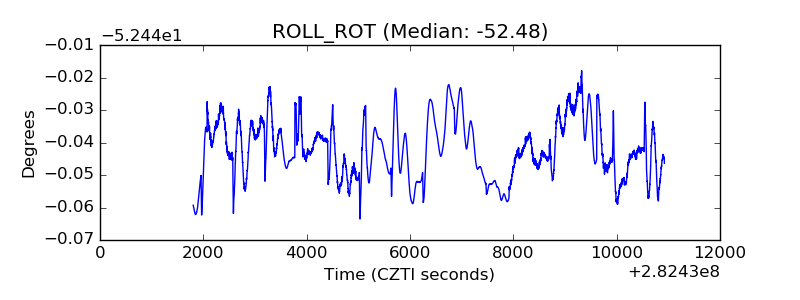 |
| _Roll_DEC | 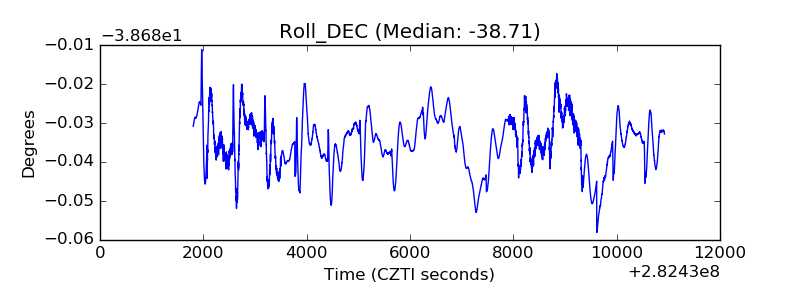 |
| _Roll_RA | 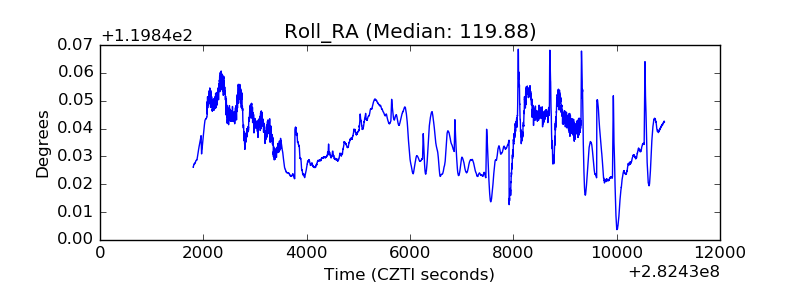 |
| Veto Counter | 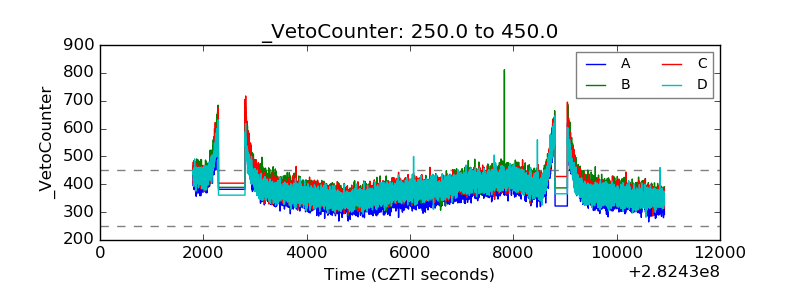 |