| Param | Original file | Final file |
|---|---|---|
| Filename | modeM0/AS1A05_165T12_9000002562_17360cztM0_level2.evt | modeM0/AS1A05_165T12_9000002562_17360cztM0_level2_quad_clean.evt |
| Size (bytes) | 617,273,280 | 116,432,640 |
| Size | 588.7 MB | 111.0 MB |
| Events in quadrant A | 3,851,858 | 756,873 |
| Events in quadrant B | 3,950,530 | 765,557 |
| Events in quadrant C | 3,950,027 | 724,899 |
| Events in quadrant D | 6,372,573 | 695,484 |
| Mode M9 | |||
|---|---|---|---|
| Quadrant | BADHDUFLAG | Total packets | Discarded packets |
| A | 0 | 5 | 0 |
| B | 0 | 5 | 0 |
| C | 0 | 5 | 0 |
| D | 0 | 5 | 0 |
| Mode M0 | |||
|---|---|---|---|
| Quadrant | BADHDUFLAG | Total packets | Discarded packets |
| A | 0 | 17261 | 2 |
| B | 0 | 17389 | 2 |
| C | 0 | 17302 | 2 |
| D | 0 | 24836 | 2 |
| Mode SS | |||
|---|---|---|---|
| Quadrant | BADHDUFLAG | Total packets | Discarded packets |
| A | 0 | 172 | 0 |
| B | 0 | 172 | 0 |
| C | 0 | 172 | 0 |
| D | 0 | 172 | 0 |
| Quadrant | Total seconds | Saturated seconds | Saturation percentage |
|---|---|---|---|
| A | 8395 | 35 | 0.416915% |
| B | 8396 | 85 | 1.012387% |
| C | 8396 | 99 | 1.179133% |
| D | 8396 | 440 | 5.240591% |
Noise dominated data is calculated using 1-second bins in cleaned event files. If a bin has >2000 counts, and if more than 50% of those come from <1% of pixels, then it is considered to be noise-dominated and hence unusable.
| Quadrant | # 1 sec bins | Bins with >0 counts | Bins with >2000 counts | High rate bins dominated by noise | Noise dominated (total time) | Noise dominated (detector-on time) | Marked lightcurve |
|---|---|---|---|---|---|---|---|
| A | 8915 | 8397 | 0 | 0 | 0.00% | 0.00% | 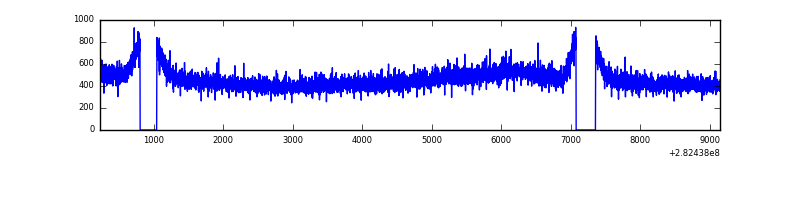 |
| B | 8916 | 8398 | 1 | 1 | 0.01% | 0.01% | 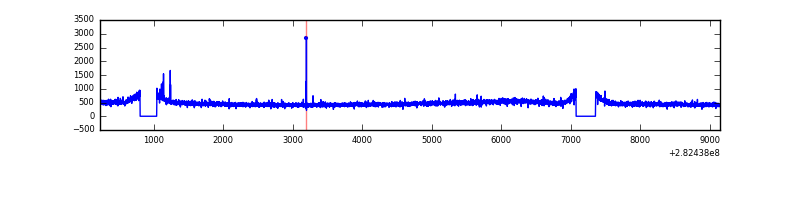 |
| C | 8916 | 8398 | 0 | 0 | 0.00% | 0.00% | 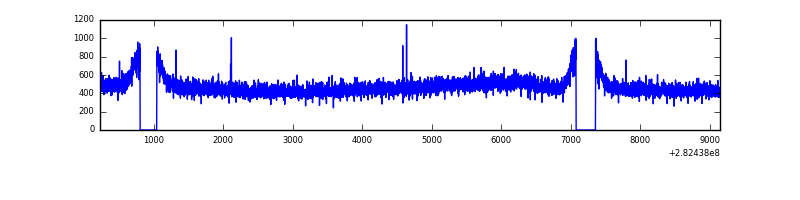 |
| D | 8916 | 8398 | 350 | 350 | 3.93% | 4.17% | 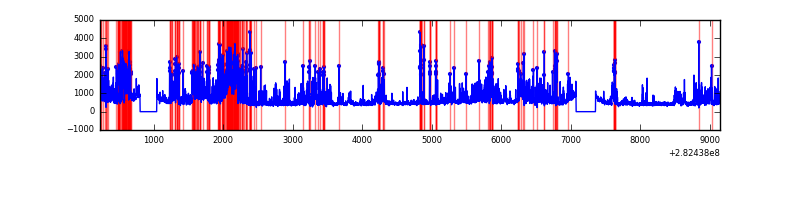 |
Top three noisy pixels from each quadrant. If the there are fewer than three noisy pixels in the level2.evt file, extra rows are filled as -1
| Pixel properties | Quadrant properties | ||||||
|---|---|---|---|---|---|---|---|
| Quadrant | DetID | PixID | Counts | Sigma | Mean | Median | Sigma |
| A | 0 | 226 | 8627 | 37.59 | 1001 | 977 | 203.5 |
| A | 3 | 137 | 7649 | 32.79 | 1001 | 977 | 203.5 |
| A | 12 | 194 | 7284 | 30.99 | 1001 | 977 | 203.5 |
| B | 12 | 111 | 23735 | 117.96 | 1005 | 978 | 192.9 |
| B | 11 | 111 | 20186 | 99.57 | 1005 | 978 | 192.9 |
| B | 14 | 111 | 17564 | 85.98 | 1005 | 978 | 192.9 |
| C | 14 | 238 | 146659 | 639.86 | 963 | 970 | 227.7 |
| C | 3 | 233 | 24689 | 104.17 | 963 | 970 | 227.7 |
| C | 8 | 128 | 12901 | 52.4 | 963 | 970 | 227.7 |
| D | 5 | 222 | 1249659 | 5349.64 | 954 | 925 | 233.4 |
| D | 13 | 232 | 964305 | 4127.17 | 954 | 925 | 233.4 |
| D | 1 | 52 | 230310 | 982.7 | 954 | 925 | 233.4 |
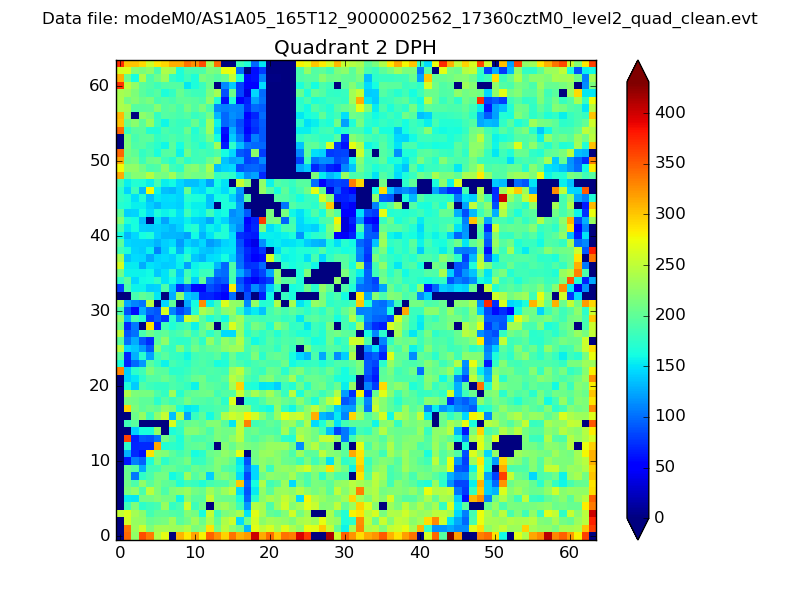
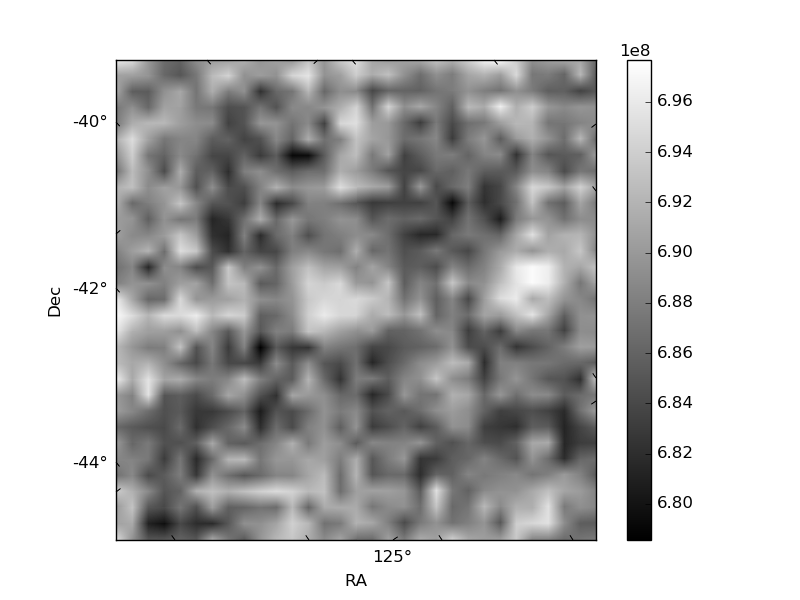
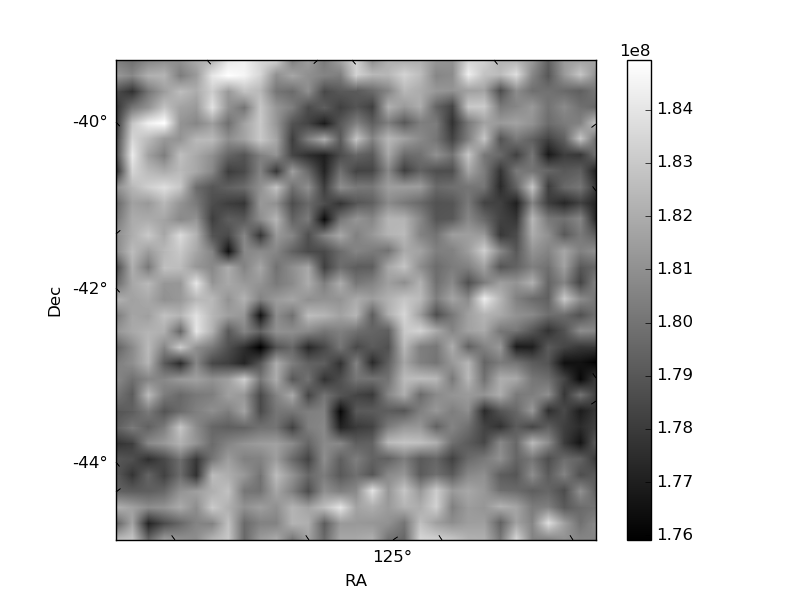
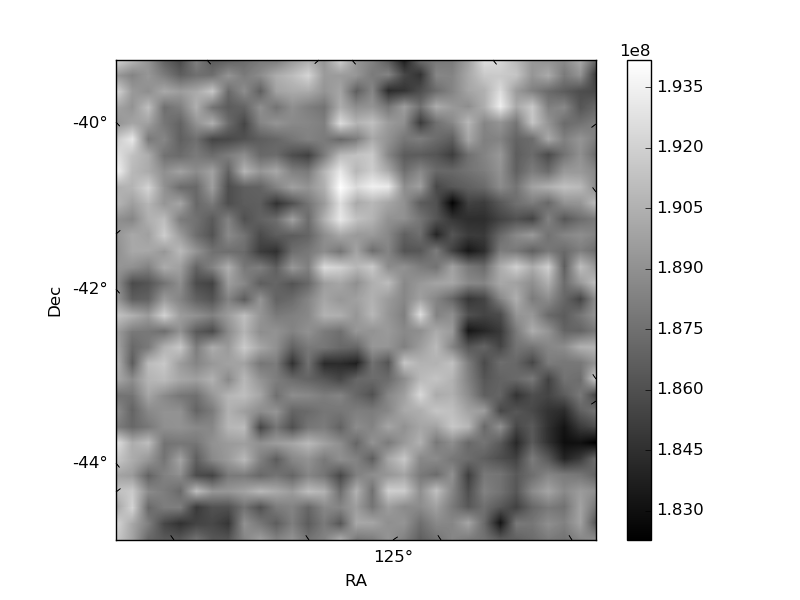
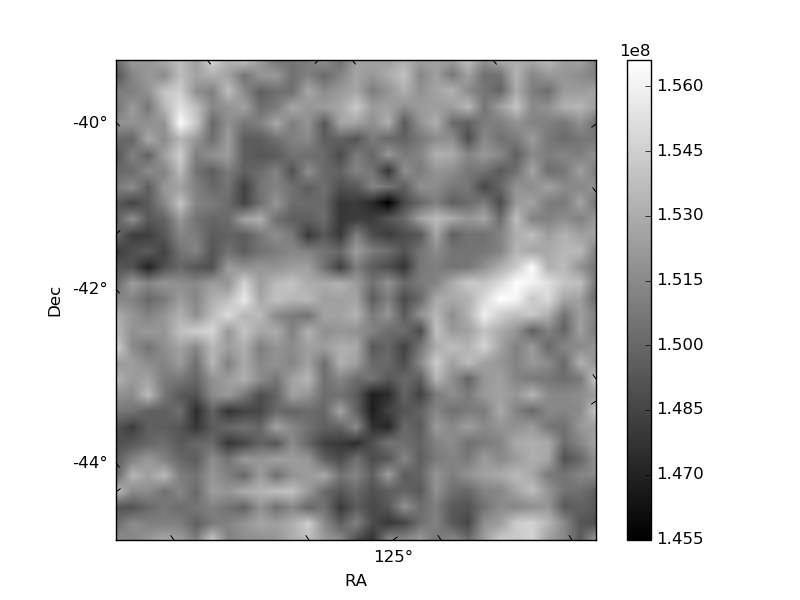
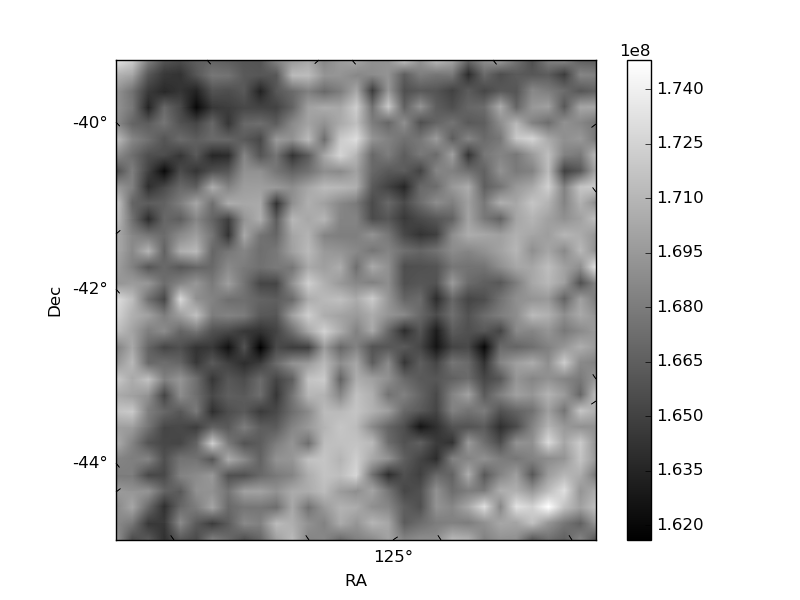
Histogram calculated using DETX and DETY for each event in the final _common_clean file
| Quadrant A | 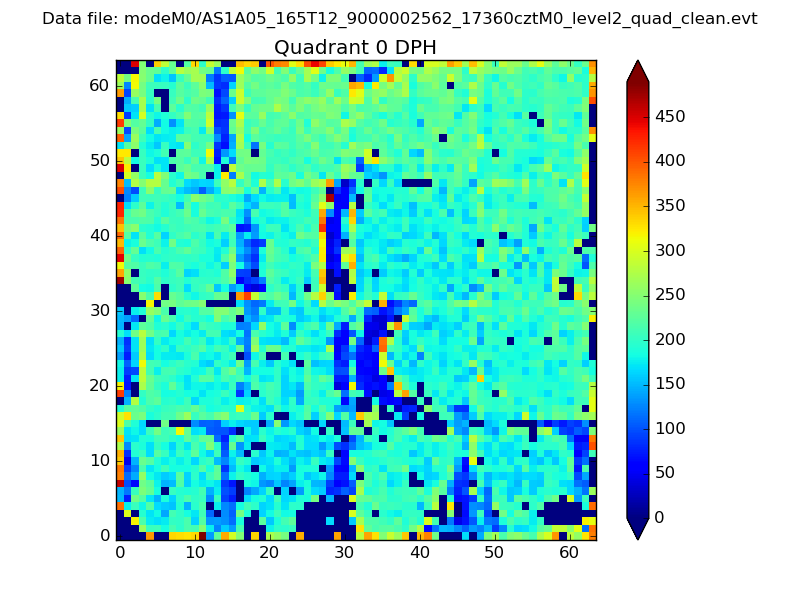 |
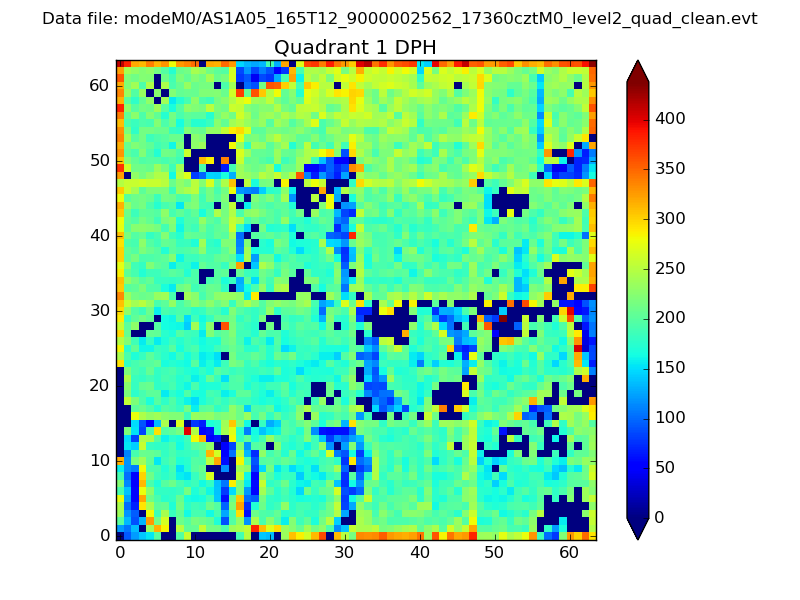 |
Quadrant B |
|---|---|---|---|
| Quadrant D | 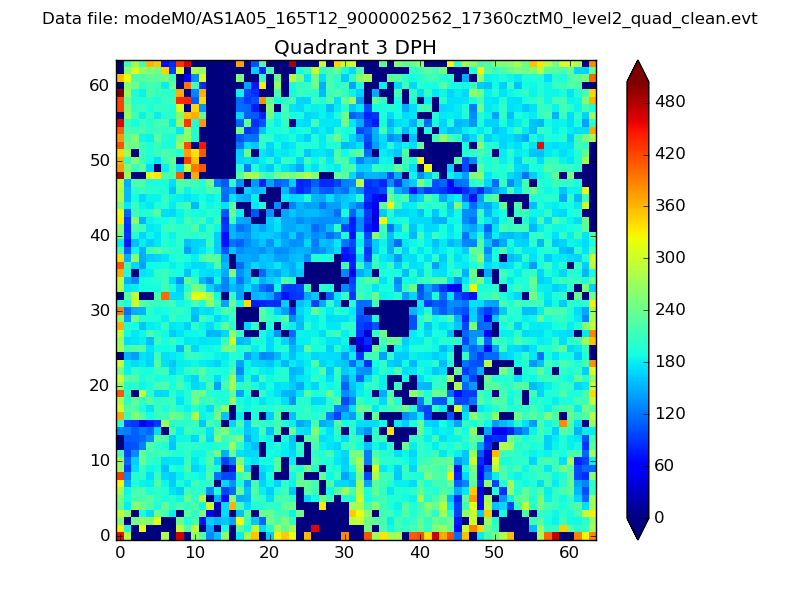 |
 |
Quadrant C |
| Plot type | Count rate plots | Images |
|---|---|---|
| Comparison with Poisson distribution Blue bars denote a histogram of data divided into 1 sec bins. Red curve is a Poisson curve with rate = median count rate of data. |
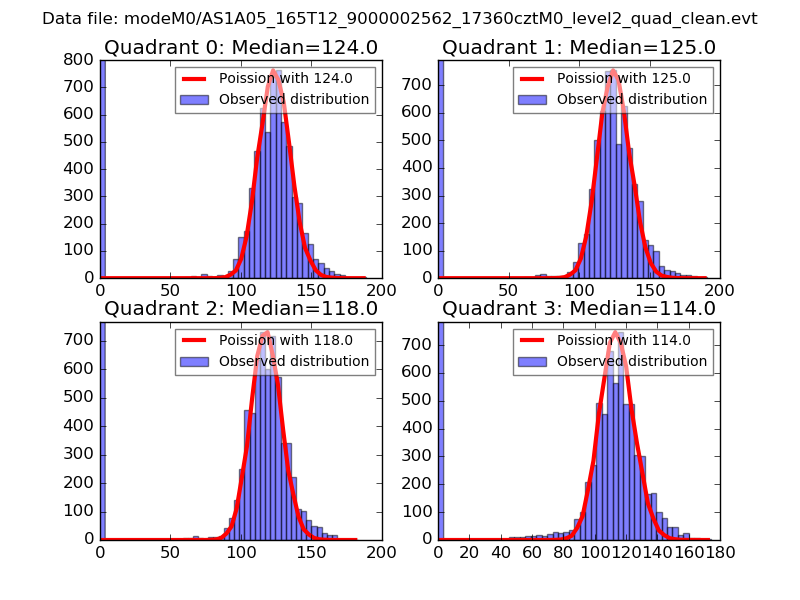 |
 |
| Quadrant-wise count rates Data is divided into 100 sec bins |
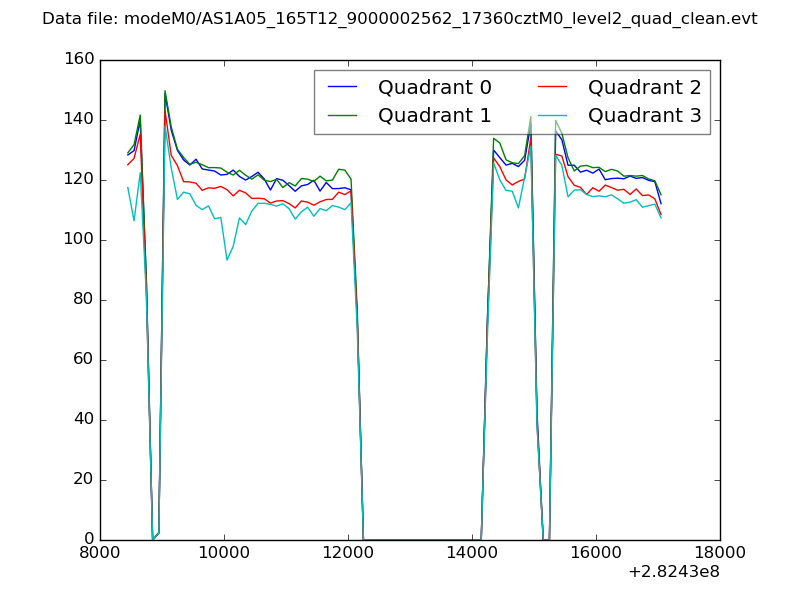 |
|
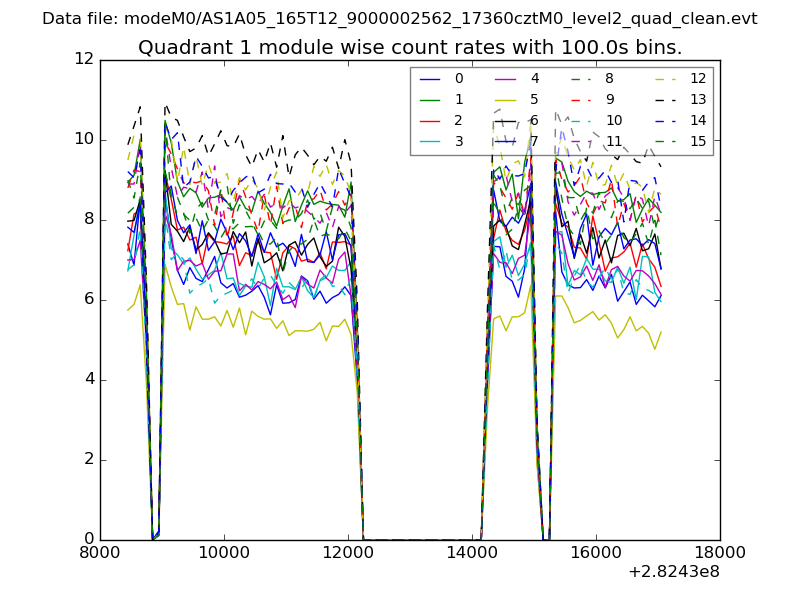
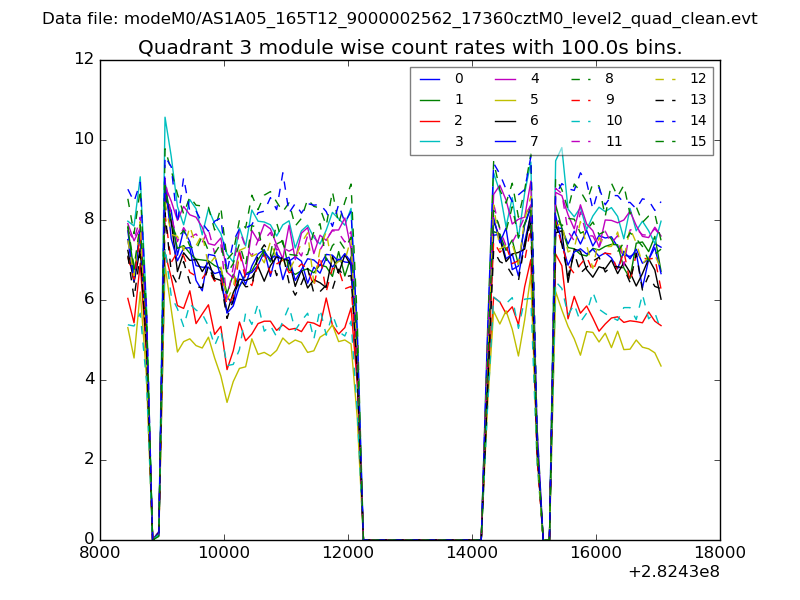
| Module-wise count rates for Quadrant A Data is divided into 100 sec bins |
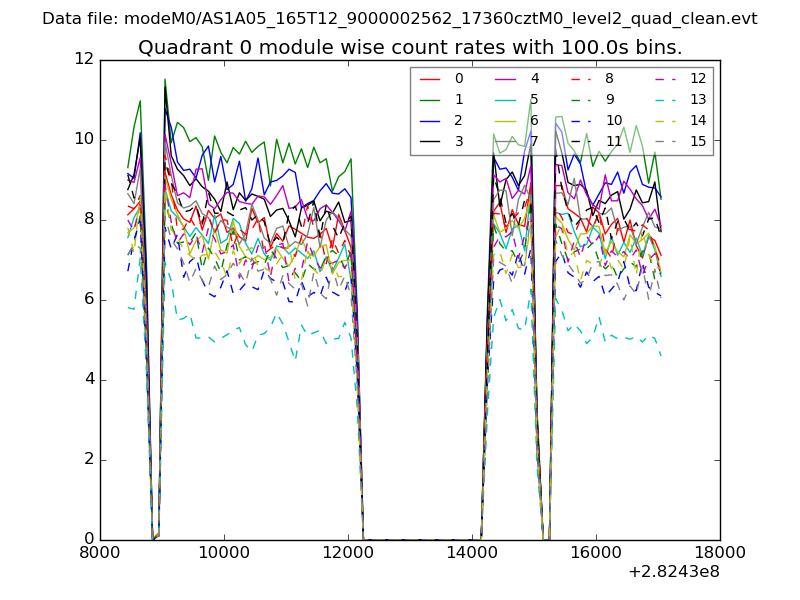 |
 |
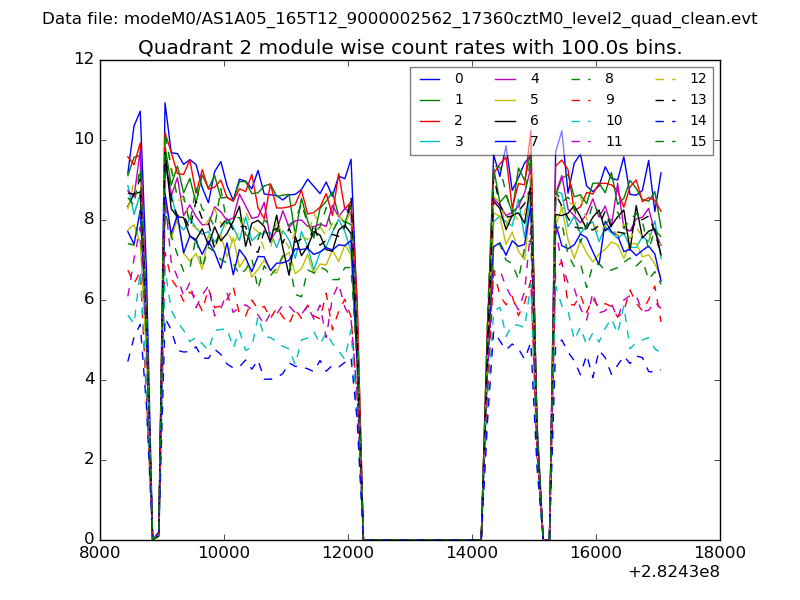
| Module-wise count rates for Quadrant B Data is divided into 100 sec bins |
 |
 |
| Module-wise count rates for Quadrant C Data is divided into 100 sec bins |
 |
 |
| Module-wise count rates for Quadrant D Data is divided into 100 sec bins |
 |
 |
| Parameter | Plot |
|---|---|
| CZT HV Monitor | 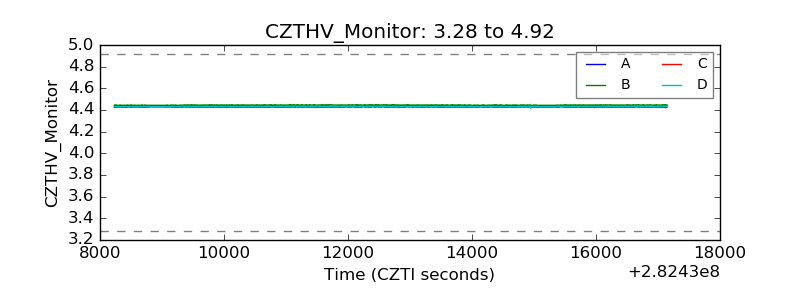 |
| D_VDD | 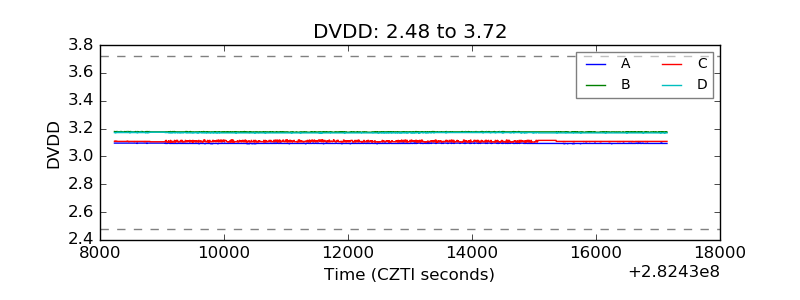 |
| Temperature 1 | 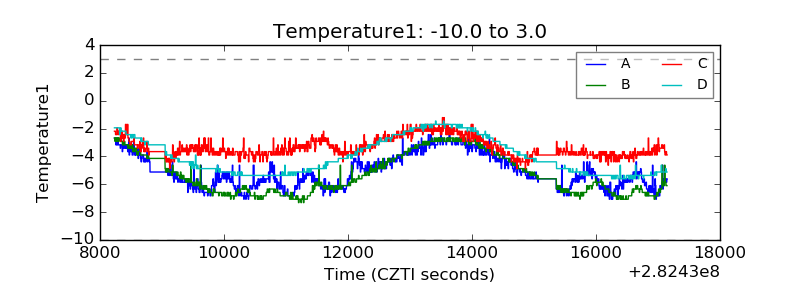 |
| Veto HV Monitor | 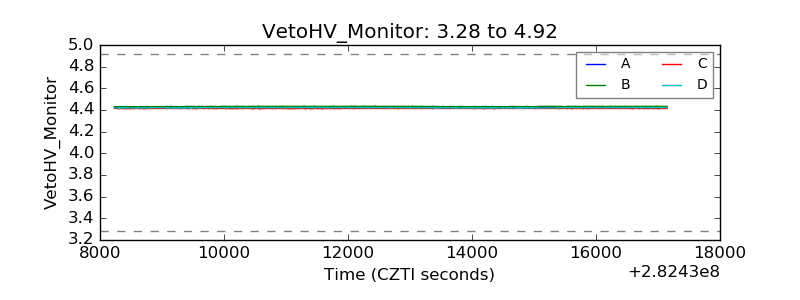 |
| Veto LLD | 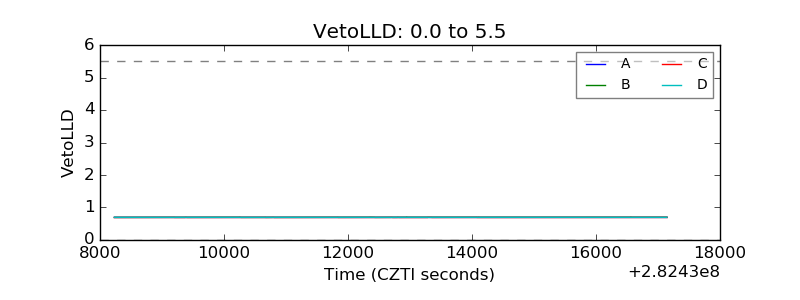 |
| Alpha Counter | 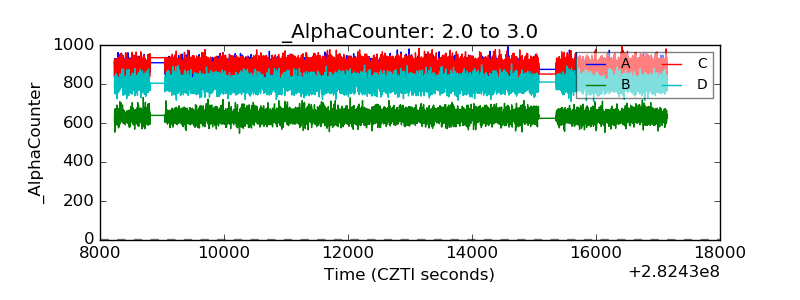 |
| _CPM_Rate | 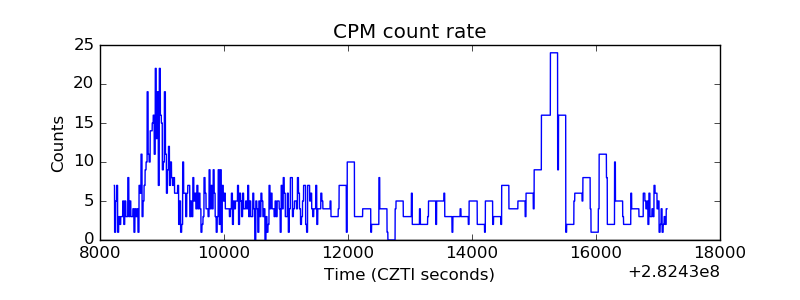 |
| CZT Counter | 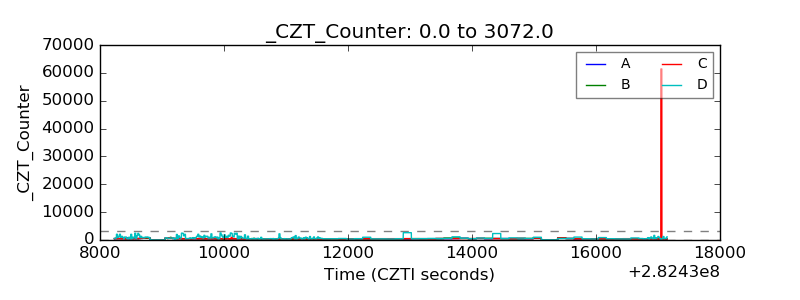 |
| +2.5 Volts monitor |  |
| +5 Volts monitor |  |
| _ROLL_ROT | 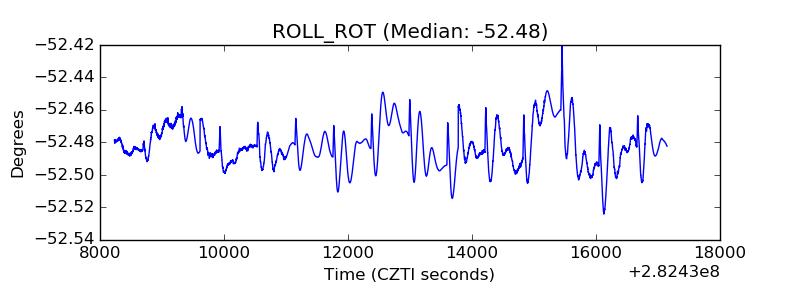 |
| _Roll_DEC | 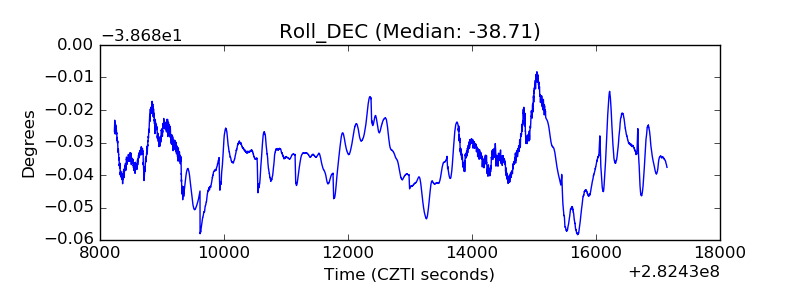 |
| _Roll_RA | 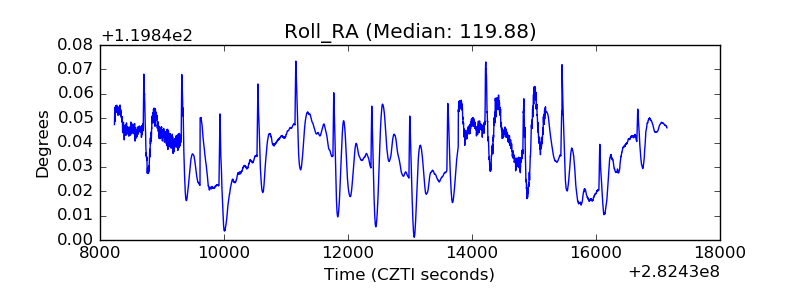 |
| Veto Counter | 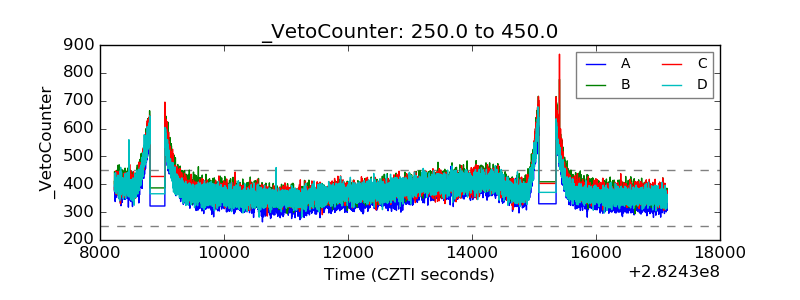 |