| Param | Original file | Final file |
|---|---|---|
| Filename | modeM0/AS1A05_165T12_9000002562_17363cztM0_level2.evt | modeM0/AS1A05_165T12_9000002562_17363cztM0_level2_quad_clean.evt |
| Size (bytes) | 1,263,600,000 | 247,564,800 |
| Size | 1.2 GB | 236.1 MB |
| Events in quadrant A | 8,636,779 | 1,579,204 |
| Events in quadrant B | 8,803,446 | 1,603,296 |
| Events in quadrant C | 8,840,166 | 1,516,776 |
| Events in quadrant D | 10,699,785 | 1,486,884 |
| Mode M9 | |||
|---|---|---|---|
| Quadrant | BADHDUFLAG | Total packets | Discarded packets |
| A | 0 | 23 | 0 |
| B | 0 | 23 | 0 |
| C | 0 | 23 | 0 |
| D | 0 | 23 | 0 |
| Mode M0 | |||
|---|---|---|---|
| Quadrant | BADHDUFLAG | Total packets | Discarded packets |
| A | 0 | 38627 | 4 |
| B | 0 | 38753 | 4 |
| C | 0 | 38694 | 4 |
| D | 0 | 44579 | 4 |
| Mode SS | |||
|---|---|---|---|
| Quadrant | BADHDUFLAG | Total packets | Discarded packets |
| A | 0 | 388 | 0 |
| B | 0 | 388 | 0 |
| C | 0 | 388 | 0 |
| D | 0 | 388 | 0 |
| Quadrant | Total seconds | Saturated seconds | Saturation percentage |
|---|---|---|---|
| A | 19046 | 71 | 0.372782% |
| B | 19045 | 135 | 0.708847% |
| C | 19045 | 202 | 1.060646% |
| D | 19046 | 253 | 1.328363% |
Noise dominated data is calculated using 1-second bins in cleaned event files. If a bin has >2000 counts, and if more than 50% of those come from <1% of pixels, then it is considered to be noise-dominated and hence unusable.
| Quadrant | # 1 sec bins | Bins with >0 counts | Bins with >2000 counts | High rate bins dominated by noise | Noise dominated (total time) | Noise dominated (detector-on time) | Marked lightcurve |
|---|---|---|---|---|---|---|---|
| A | 21306 | 19050 | 0 | 0 | 0.00% | 0.00% | 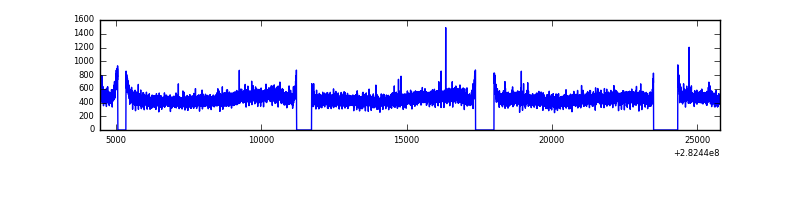 |
| B | 21305 | 19049 | 3 | 3 | 0.01% | 0.02% | 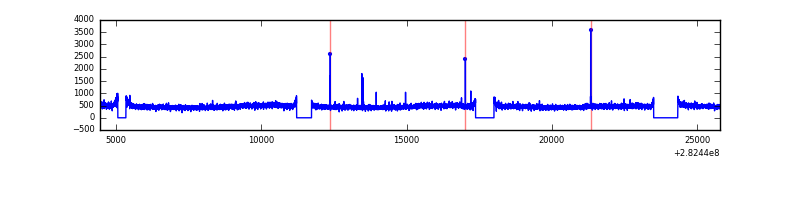 |
| C | 21305 | 19049 | 0 | 0 | 0.00% | 0.00% | 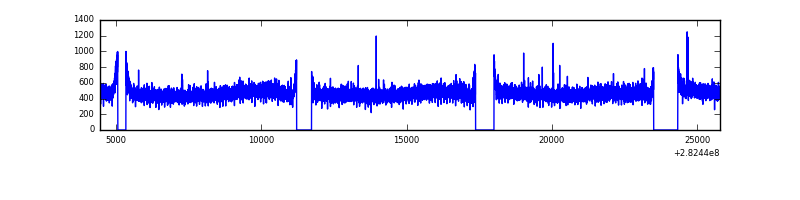 |
| D | 21306 | 19050 | 121 | 121 | 0.57% | 0.64% | 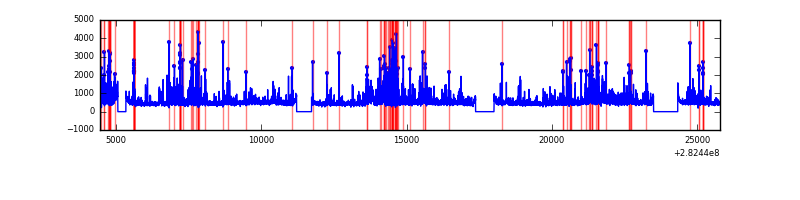 |
Top three noisy pixels from each quadrant. If the there are fewer than three noisy pixels in the level2.evt file, extra rows are filled as -1
| Pixel properties | Quadrant properties | ||||||
|---|---|---|---|---|---|---|---|
| Quadrant | DetID | PixID | Counts | Sigma | Mean | Median | Sigma |
| A | 0 | 226 | 19520 | 38.33 | 2244 | 2193 | 452.0 |
| A | 3 | 137 | 17583 | 34.05 | 2244 | 2193 | 452.0 |
| A | 12 | 194 | 16040 | 30.63 | 2244 | 2193 | 452.0 |
| B | 12 | 111 | 53507 | 119.69 | 2245 | 2186 | 428.8 |
| B | 11 | 111 | 45983 | 102.15 | 2245 | 2186 | 428.8 |
| B | 14 | 111 | 40060 | 88.33 | 2245 | 2186 | 428.8 |
| C | 14 | 238 | 333524 | 653.05 | 2166 | 2178 | 507.4 |
| C | 3 | 233 | 33136 | 61.01 | 2166 | 2178 | 507.4 |
| C | 8 | 128 | 16357 | 27.94 | 2166 | 2178 | 507.4 |
| D | 5 | 222 | 1048232 | 1979.23 | 2181 | 2120 | 528.5 |
| D | 13 | 232 | 572562 | 1079.27 | 2181 | 2120 | 528.5 |
| D | 1 | 52 | 428386 | 806.49 | 2181 | 2120 | 528.5 |
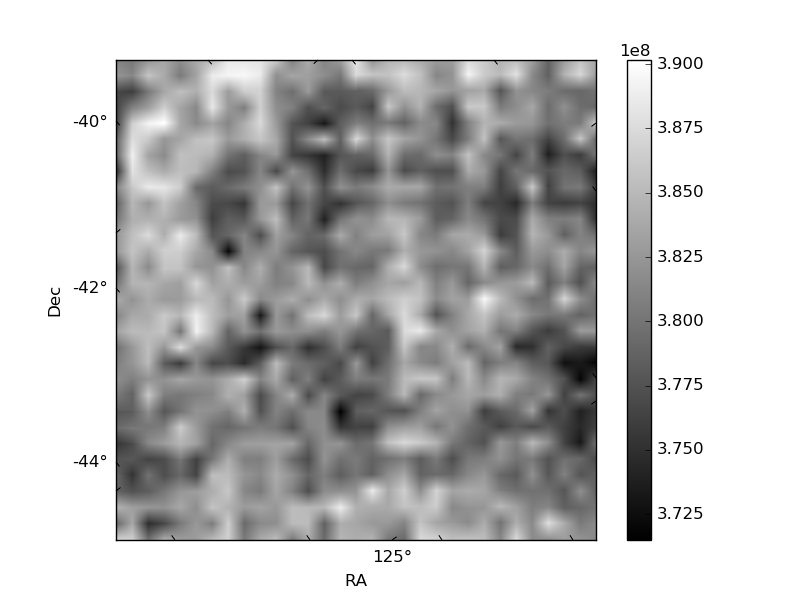
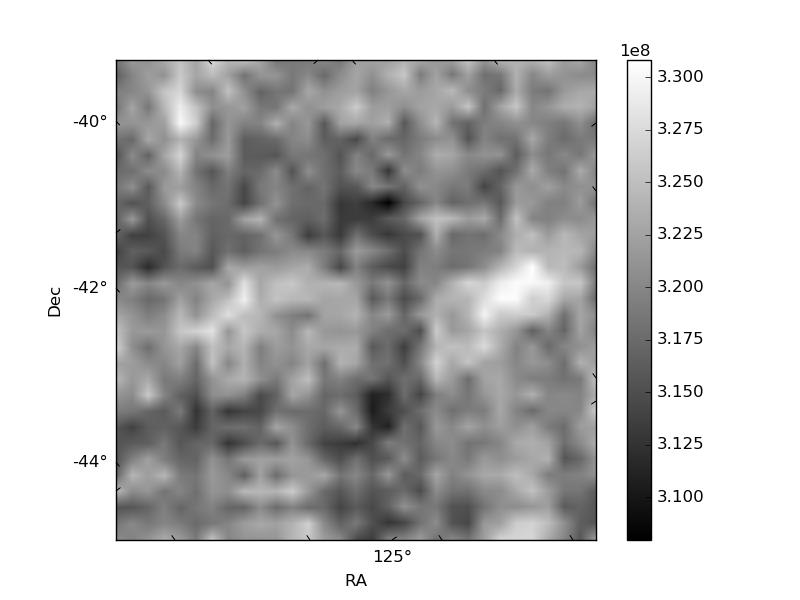
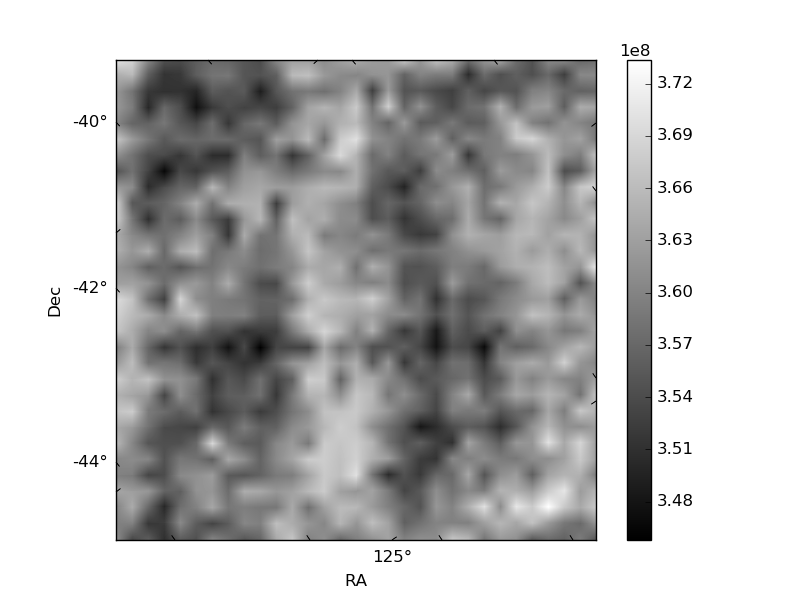
Histogram calculated using DETX and DETY for each event in the final _common_clean file
| Quadrant A |  |
 |
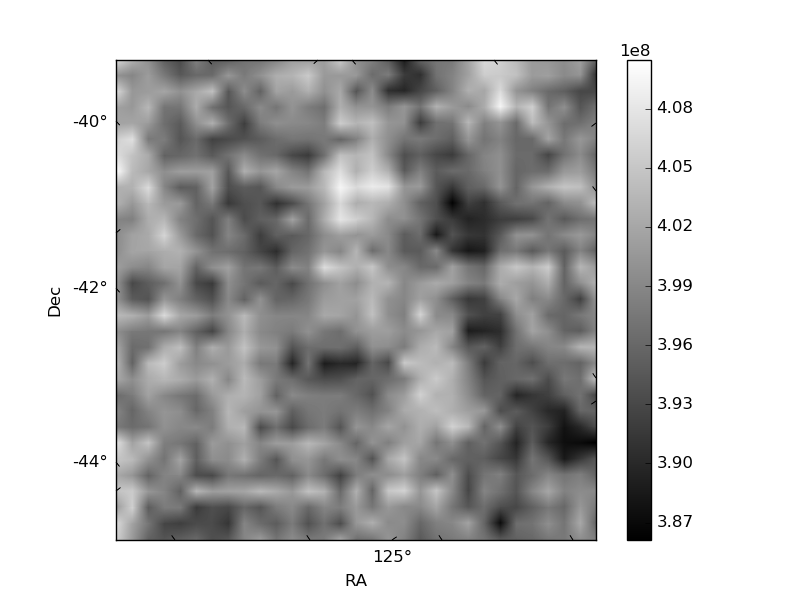
Quadrant B |
|---|---|---|---|
| Quadrant D |  |
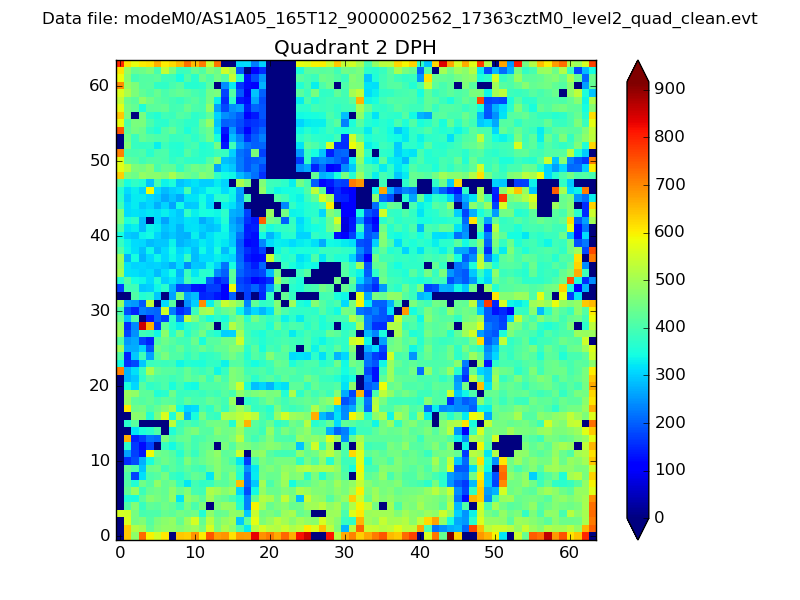 |
Quadrant C |
| Plot type | Count rate plots | Images |
|---|---|---|
| Comparison with Poisson distribution Blue bars denote a histogram of data divided into 1 sec bins. Red curve is a Poisson curve with rate = median count rate of data. |
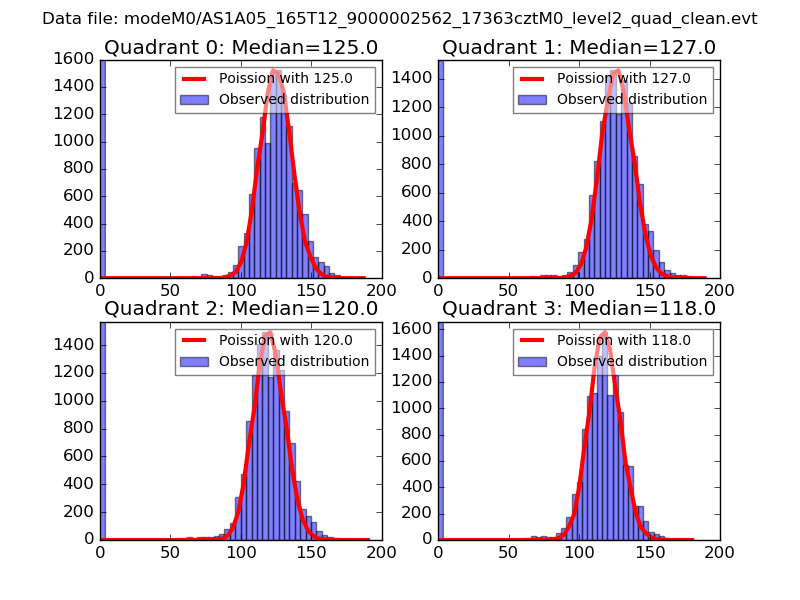 |
 |
| Quadrant-wise count rates Data is divided into 100 sec bins |
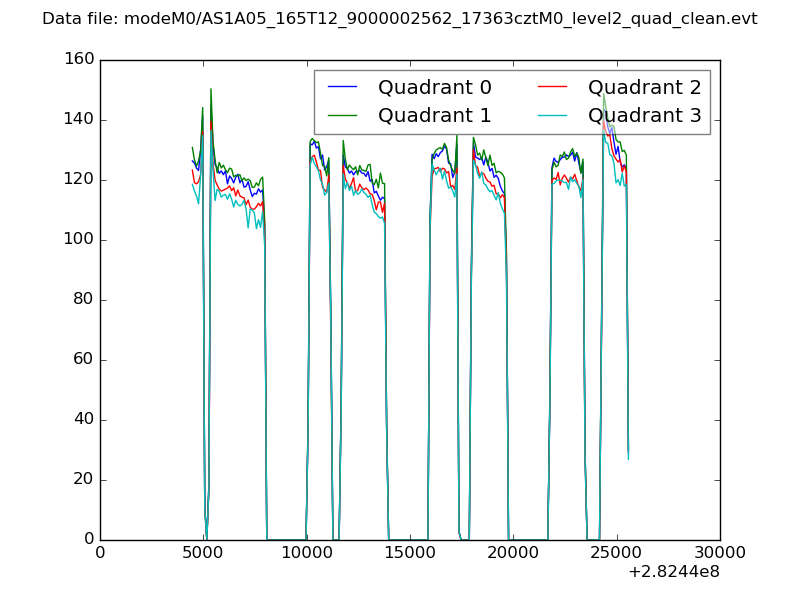 |
|
| Module-wise count rates for Quadrant A Data is divided into 100 sec bins |
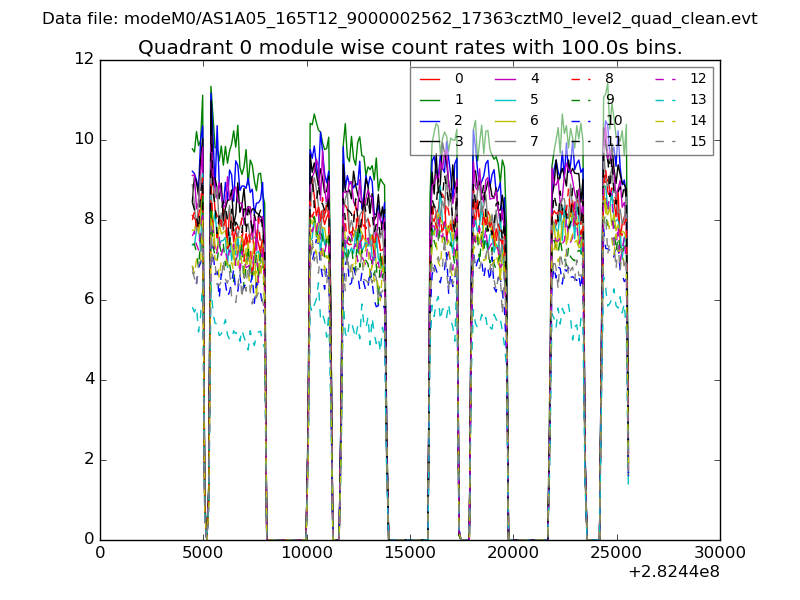 |
 |
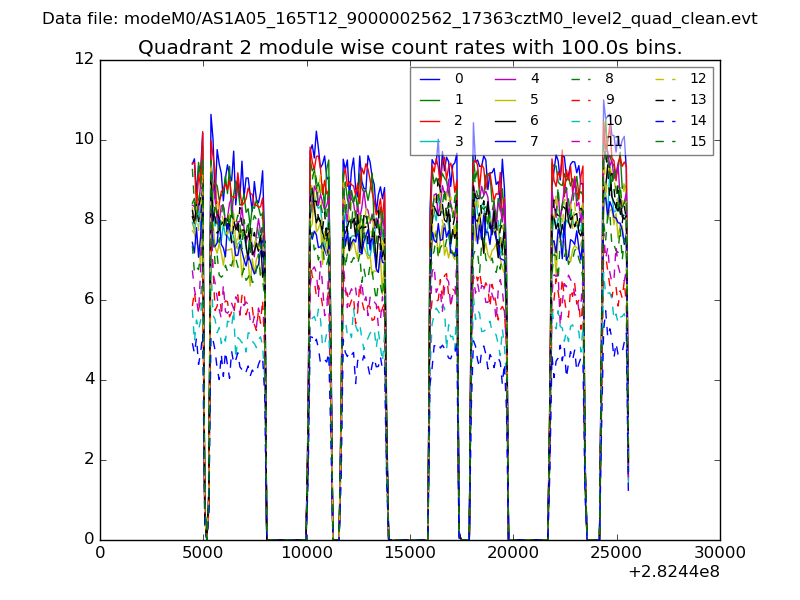
| Module-wise count rates for Quadrant B Data is divided into 100 sec bins |
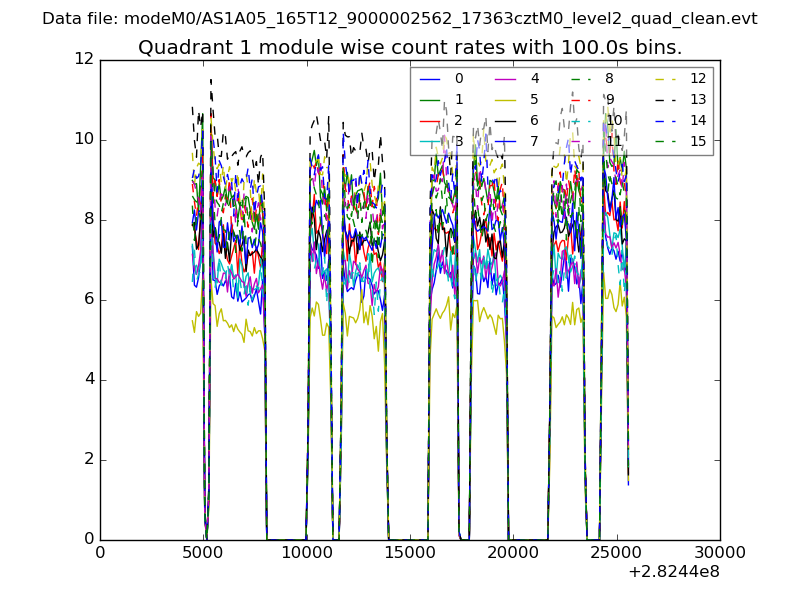 |
 |
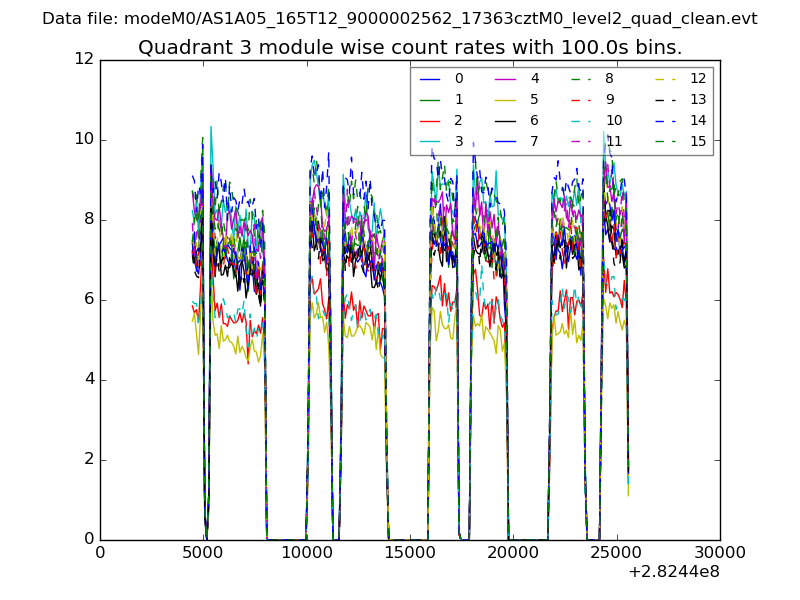
| Module-wise count rates for Quadrant C Data is divided into 100 sec bins |
 |
 |
| Module-wise count rates for Quadrant D Data is divided into 100 sec bins |
 |
 |
| Parameter | Plot |
|---|---|
| CZT HV Monitor | 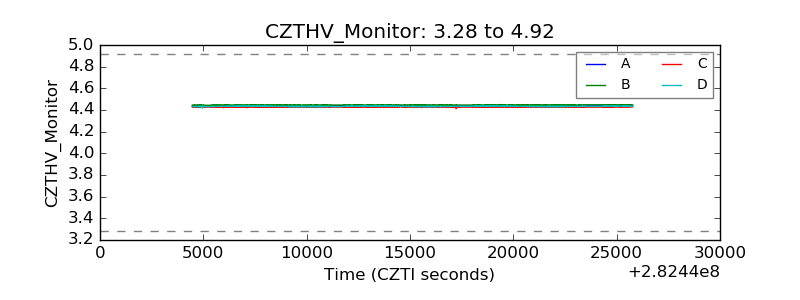 |
| D_VDD | 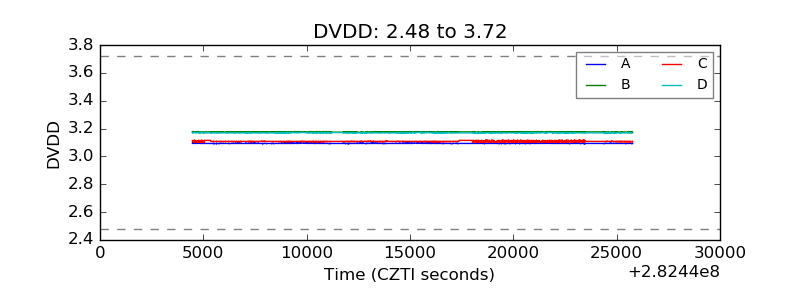 |
| Temperature 1 | 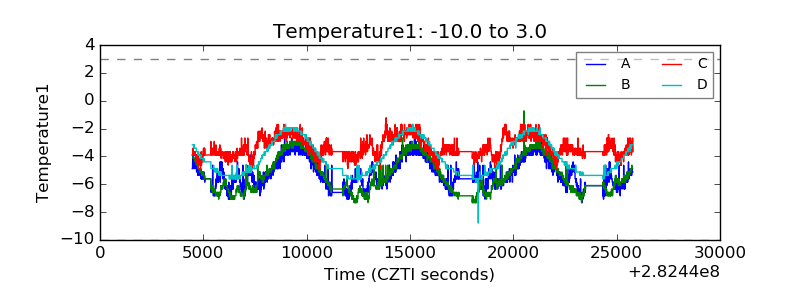 |
| Veto HV Monitor | 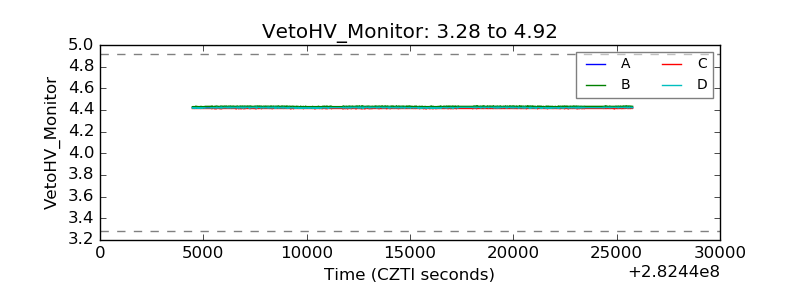 |
| Veto LLD | 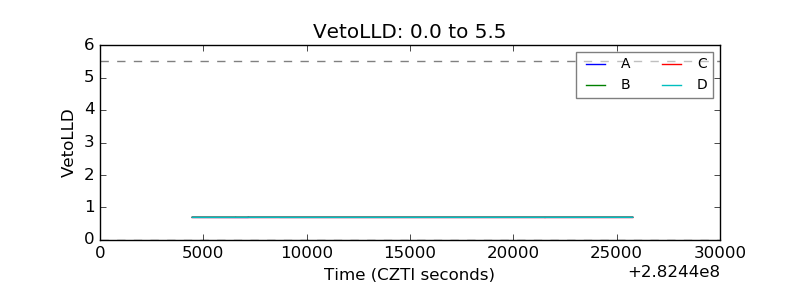 |
| Alpha Counter | 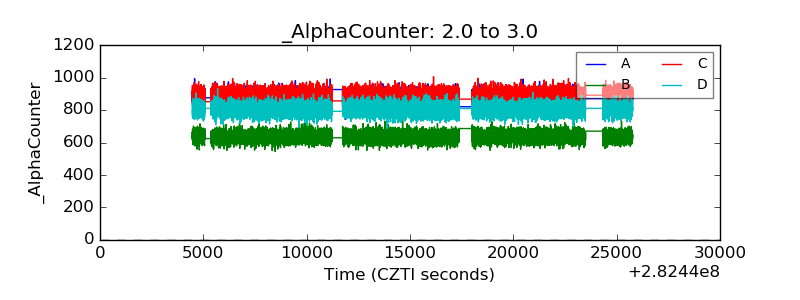 |
| _CPM_Rate | 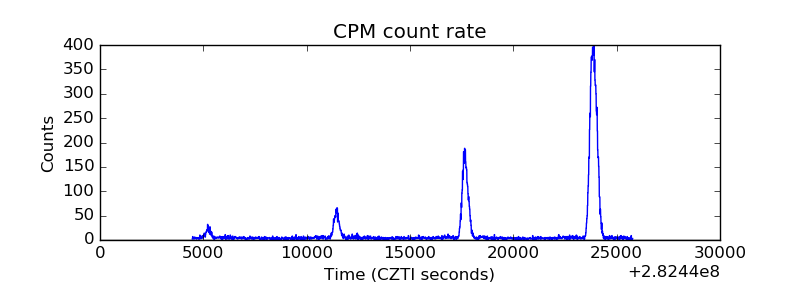 |
| CZT Counter | 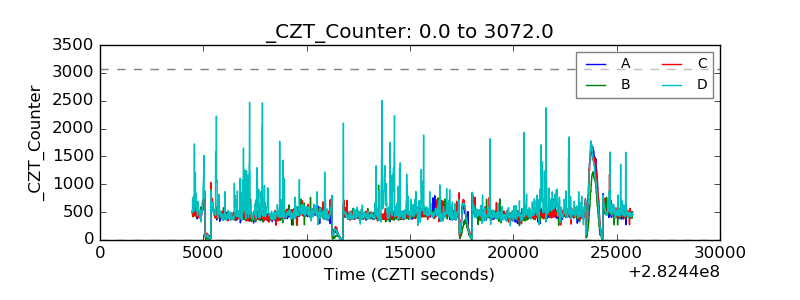 |
| +2.5 Volts monitor |  |
| +5 Volts monitor |  |
| _ROLL_ROT | 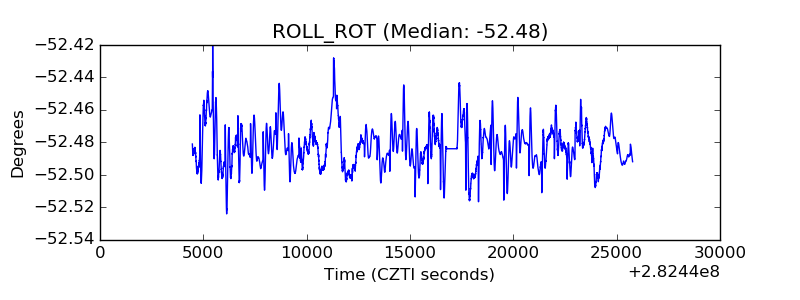 |
| _Roll_DEC | 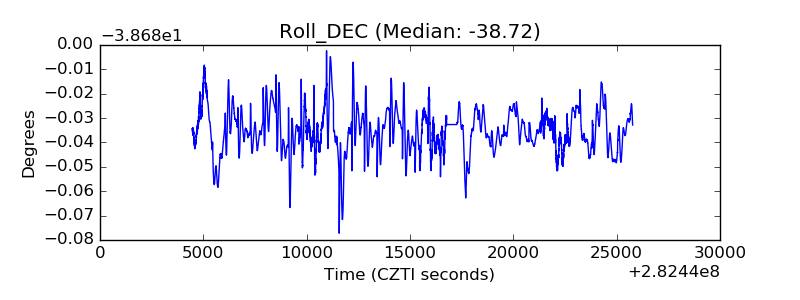 |
| _Roll_RA | 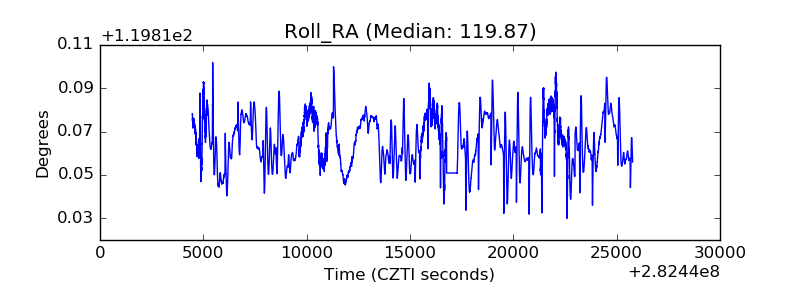 |
| Veto Counter | 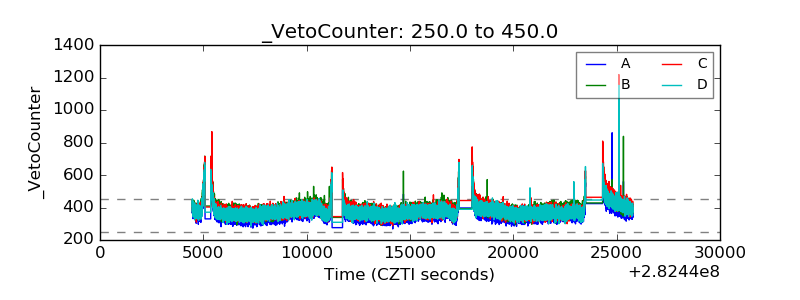 |