| Param | Original file | Final file |
|---|---|---|
| Filename | modeM0/AS1A05_012T02_9000002566cztM0_level2.fits | modeM0/AS1A05_012T02_9000002566cztM0_level2_quad_clean.evt |
| Size (bytes) | 131,368,320 | 131,762,880 |
| Size | 125.3 MB | 125.7 MB |
| Events in quadrant A | 843,346 | 860,234 |
| Events in quadrant B | 806,139 | 851,687 |
| Events in quadrant C | 822,464 | 807,992 |
| Events in quadrant D | 627,022 | 591,697 |
| Mode M9 | |||
|---|---|---|---|
| Quadrant | BADHDUFLAG | Total packets | Discarded packets |
| A | 0 | 44 | 0 |
| B | 0 | 44 | 0 |
| C | 0 | 44 | 0 |
| D | 0 | 44 | 0 |
| Mode SS | |||
|---|---|---|---|
| Quadrant | BADHDUFLAG | Total packets | Discarded packets |
| A | 0 | 358 | 0 |
| B | 0 | 260 | 0 |
| C | 0 | 358 | 0 |
| D | 0 | 260 | 0 |
| Mode M0 | |||
|---|---|---|---|
| Quadrant | BADHDUFLAG | Total packets | Discarded packets |
| A | 0 | 26888 | 0 |
| B | 0 | 27487 | 0 |
| C | 0 | 27636 | 0 |
| D | 0 | 53810 | 0 |
| Quadrant | Total seconds | Saturated seconds | Saturation percentage |
|---|---|---|---|
| A | 12543 | 259 | 2.064897% |
| B | 12546 | 307 | 2.446995% |
| C | 12530 | 372 | 2.968875% |
| D | 12537 | 3233 | 25.787669% |
Noise dominated data is calculated using 1-second bins in cleaned event files. If a bin has >2000 counts, and if more than 50% of those come from <1% of pixels, then it is considered to be noise-dominated and hence unusable.
| Quadrant | # 1 sec bins | Bins with >0 counts | Bins with >2000 counts | High rate bins dominated by noise | Noise dominated (total time) | Noise dominated (detector-on time) | Marked lightcurve |
|---|---|---|---|---|---|---|---|
| A | 16233 | 12523 | 0 | 0 | 0.00% | 0.00% |  |
| B | 16233 | 12523 | 0 | 0 | 0.00% | 0.00% |  |
| C | 16232 | 12521 | 0 | 0 | 0.00% | 0.00% |  |
| D | 16232 | 12508 | 0 | 0 | 0.00% | 0.00% |  |
Top three noisy pixels from each quadrant. If the there are fewer than three noisy pixels in the level2.evt file, extra rows are filled as -1
| Pixel properties | Quadrant properties | ||||||
|---|---|---|---|---|---|---|---|
| Quadrant | DetID | PixID | Counts | Sigma | Mean | Median | Sigma |
| A | 0 | 29 | 787 | 10.38 | 219 | 207 | 55.9 |
| A | 7 | 110 | 624 | 7.46 | 219 | 207 | 55.9 |
| A | 0 | 30 | 619 | 7.37 | 219 | 207 | 55.9 |
| B | 2 | 9 | 649 | 10.09 | 213 | 205 | 44.0 |
| B | 3 | 80 | 566 | 8.21 | 213 | 205 | 44.0 |
| B | 2 | 8 | 545 | 7.73 | 213 | 205 | 44.0 |
| C | 1 | 81 | 645 | 8.02 | 217 | 205 | 54.8 |
| C | 1 | 80 | 623 | 7.62 | 217 | 205 | 54.8 |
| C | 3 | 126 | 604 | 7.28 | 217 | 205 | 54.8 |
| D | 10 | 189 | 456 | 6.06 | 179 | 164 | 48.2 |
| D | 15 | 142 | 449 | 5.92 | 179 | 164 | 48.2 |
| D | 7 | 3 | 443 | 5.79 | 179 | 164 | 48.2 |
Histogram calculated using DETX and DETY for each event in the final _common_clean file
| Quadrant A |  |
 |
Quadrant B |
|---|---|---|---|
| Quadrant D | 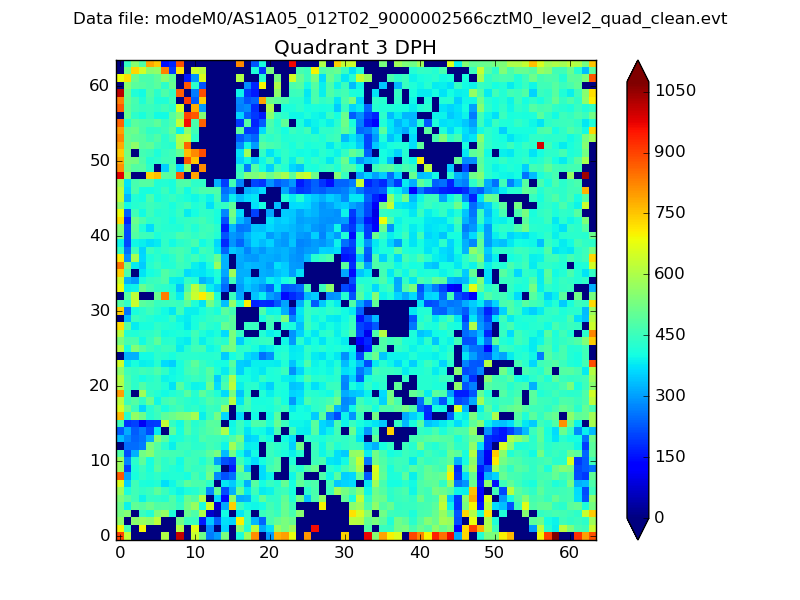 |
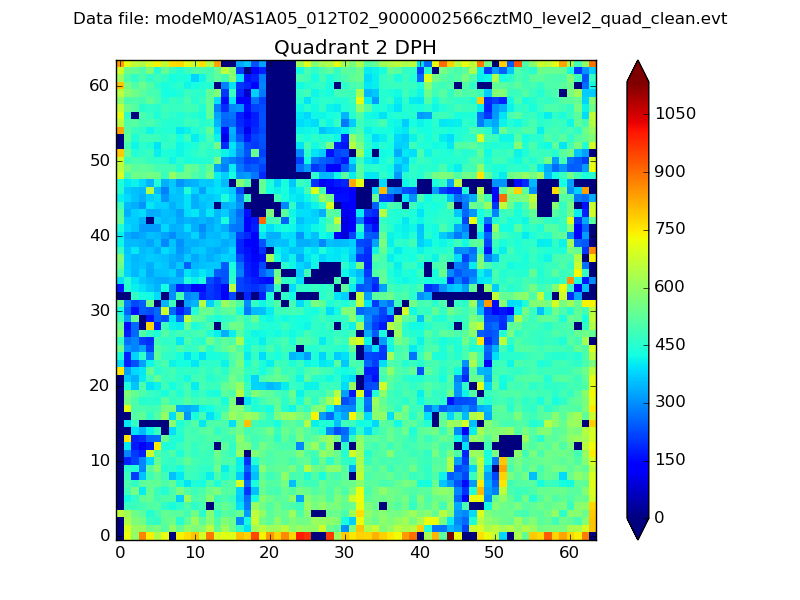 |
Quadrant C |
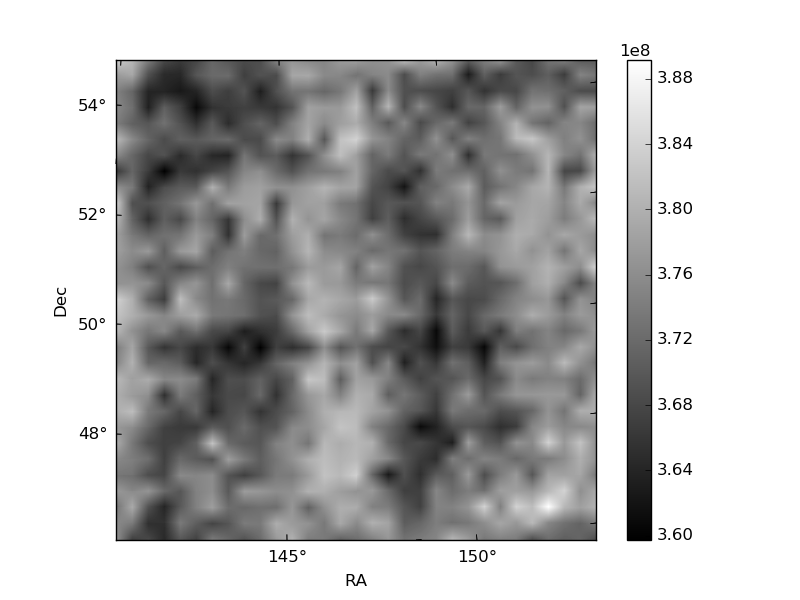
| Plot type | Count rate plots | Images |
|---|---|---|
| Comparison with Poisson distribution Blue bars denote a histogram of data divided into 1 sec bins. Red curve is a Poisson curve with rate = median count rate of data. |
 |
 |
| Quadrant-wise count rates Data is divided into 100 sec bins |
 |
|
| Module-wise count rates for Quadrant A Data is divided into 100 sec bins |
 |
 |
| Module-wise count rates for Quadrant B Data is divided into 100 sec bins |
 |
 |
| Module-wise count rates for Quadrant C Data is divided into 100 sec bins |
 |
 |
| Module-wise count rates for Quadrant D Data is divided into 100 sec bins |
 |
 |
| Parameter | Plot |
|---|---|
| CZT HV Monitor |  |
| D_VDD | 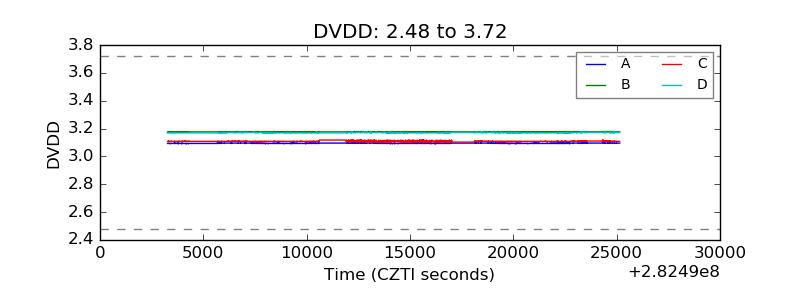 |
| Temperature 1 |  |
| Veto HV Monitor | 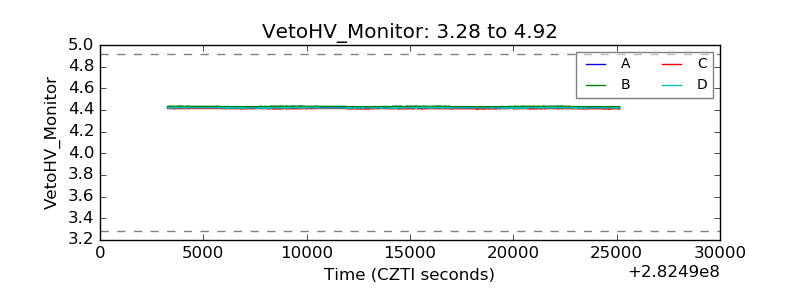 |
| Veto LLD |  |
| Alpha Counter |  |
| _CPM_Rate |  |
| CZT Counter |  |
| +2.5 Volts monitor |  |
| +5 Volts monitor |  |
| _ROLL_ROT |  |
| _Roll_DEC |  |
| _Roll_RA |  |
| Veto Counter |  |