| Param | Original file | Final file |
|---|---|---|
| Filename | modeM0/AS1A05_012T02_9000002566_17369cztM0_level2.evt | modeM0/AS1A05_012T02_9000002566_17369cztM0_level2_quad_clean.evt |
| Size (bytes) | 201,600,000 | 25,626,240 |
| Size | 192.3 MB | 24.4 MB |
| Events in quadrant A | 1,387,138 | 153,816 |
| Events in quadrant B | 1,398,707 | 153,637 |
| Events in quadrant C | 1,407,575 | 146,848 |
| Events in quadrant D | 1,743,672 | 144,949 |
| Mode M9 | |||
|---|---|---|---|
| Quadrant | BADHDUFLAG | Total packets | Discarded packets |
| A | 0 | 13 | 0 |
| B | 0 | 13 | 0 |
| C | 0 | 13 | 0 |
| D | 0 | 13 | 0 |
| Mode SS | |||
|---|---|---|---|
| Quadrant | BADHDUFLAG | Total packets | Discarded packets |
| A | 0 | 52 | 0 |
| B | 0 | 52 | 0 |
| C | 0 | 52 | 0 |
| D | 0 | 52 | 0 |
| Mode M0 | |||
|---|---|---|---|
| Quadrant | BADHDUFLAG | Total packets | Discarded packets |
| A | 0 | 5711 | 1 |
| B | 0 | 5752 | 1 |
| C | 0 | 5817 | 1 |
| D | 0 | 6929 | 1 |
| Quadrant | Total seconds | Saturated seconds | Saturation percentage |
|---|---|---|---|
| A | 2447 | 87 | 3.555374% |
| B | 2447 | 106 | 4.331835% |
| C | 2447 | 121 | 4.944830% |
| D | 2447 | 151 | 6.170821% |
Noise dominated data is calculated using 1-second bins in cleaned event files. If a bin has >2000 counts, and if more than 50% of those come from <1% of pixels, then it is considered to be noise-dominated and hence unusable.
| Quadrant | # 1 sec bins | Bins with >0 counts | Bins with >2000 counts | High rate bins dominated by noise | Noise dominated (total time) | Noise dominated (detector-on time) | Marked lightcurve |
|---|---|---|---|---|---|---|---|
| A | 3777 | 2448 | 0 | 0 | 0.00% | 0.00% |  |
| B | 3777 | 2448 | 0 | 0 | 0.00% | 0.00% |  |
| C | 3777 | 2447 | 0 | 0 | 0.00% | 0.00% |  |
| D | 3777 | 2448 | 36 | 36 | 0.95% | 1.47% |  |
Top three noisy pixels from each quadrant. If the there are fewer than three noisy pixels in the level2.evt file, extra rows are filled as -1
| Pixel properties | Quadrant properties | ||||||
|---|---|---|---|---|---|---|---|
| Quadrant | DetID | PixID | Counts | Sigma | Mean | Median | Sigma |
| A | 0 | 226 | 3061 | 37.13 | 361 | 353 | 72.9 |
| A | 12 | 194 | 2599 | 30.79 | 361 | 353 | 72.9 |
| A | 3 | 137 | 2478 | 29.13 | 361 | 353 | 72.9 |
| B | 12 | 111 | 7378 | 102.49 | 356 | 348 | 68.6 |
| B | 4 | 216 | 6901 | 95.54 | 356 | 348 | 68.6 |
| B | 11 | 111 | 6426 | 88.61 | 356 | 348 | 68.6 |
| C | 14 | 238 | 52749 | 653.08 | 342 | 344 | 80.2 |
| C | 3 | 233 | 17920 | 219.03 | 342 | 344 | 80.2 |
| C | 13 | 61 | 2469 | 26.48 | 342 | 344 | 80.2 |
| D | 13 | 232 | 248271 | 2954.36 | 346 | 336 | 83.9 |
| D | 2 | 152 | 57855 | 685.39 | 346 | 336 | 83.9 |
| D | 11 | 176 | 33649 | 396.95 | 346 | 336 | 83.9 |
Histogram calculated using DETX and DETY for each event in the final _common_clean file
| Quadrant A |  |
 |
Quadrant B |
|---|---|---|---|
| Quadrant D |  |
 |
Quadrant C |
| Plot type | Count rate plots | Images |
|---|---|---|
| Comparison with Poisson distribution Blue bars denote a histogram of data divided into 1 sec bins. Red curve is a Poisson curve with rate = median count rate of data. |
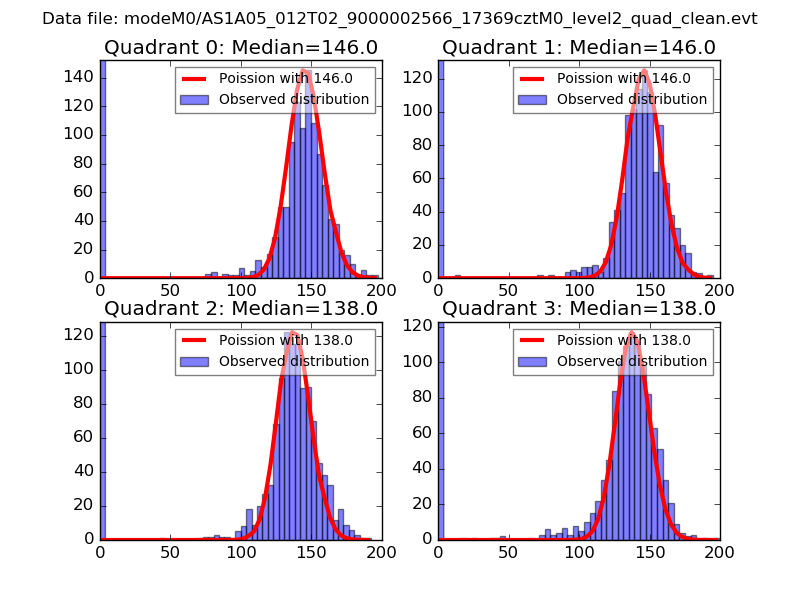 |
 |
| Quadrant-wise count rates Data is divided into 100 sec bins |
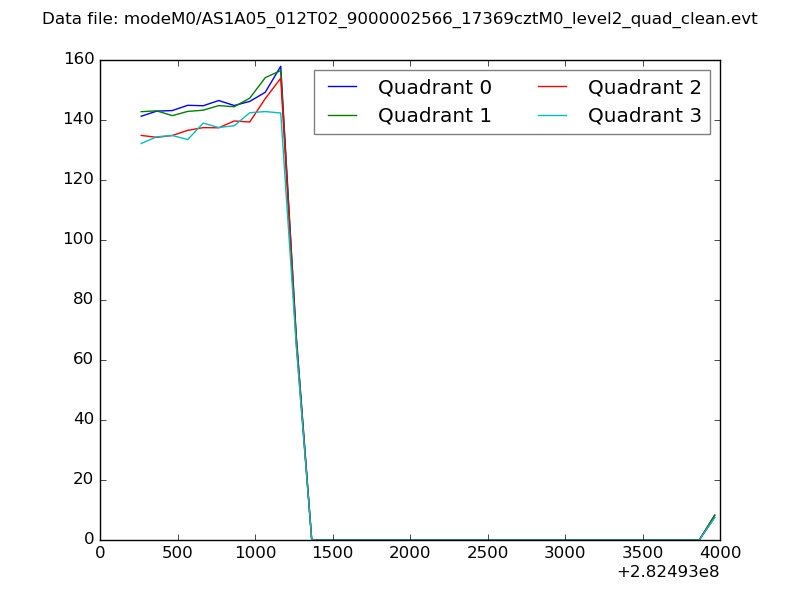 |
|
| Module-wise count rates for Quadrant A Data is divided into 100 sec bins |
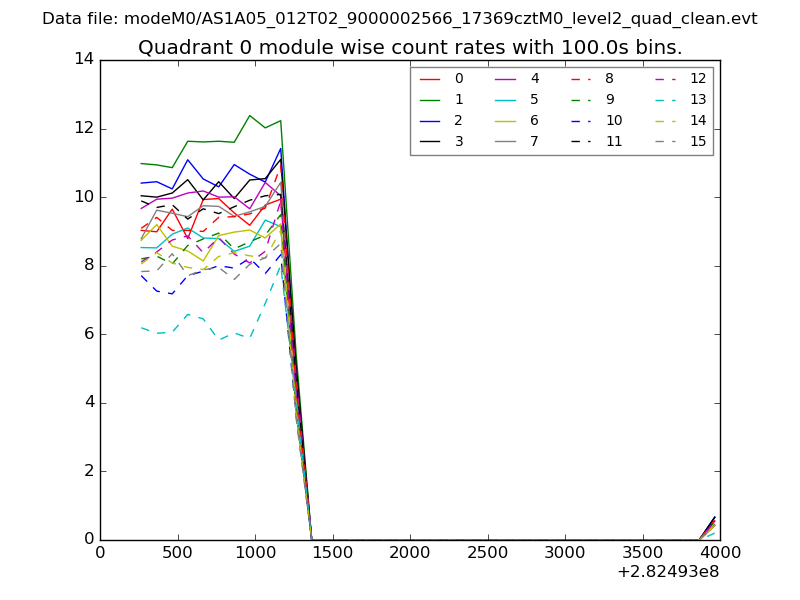 |
 |
| Module-wise count rates for Quadrant B Data is divided into 100 sec bins |
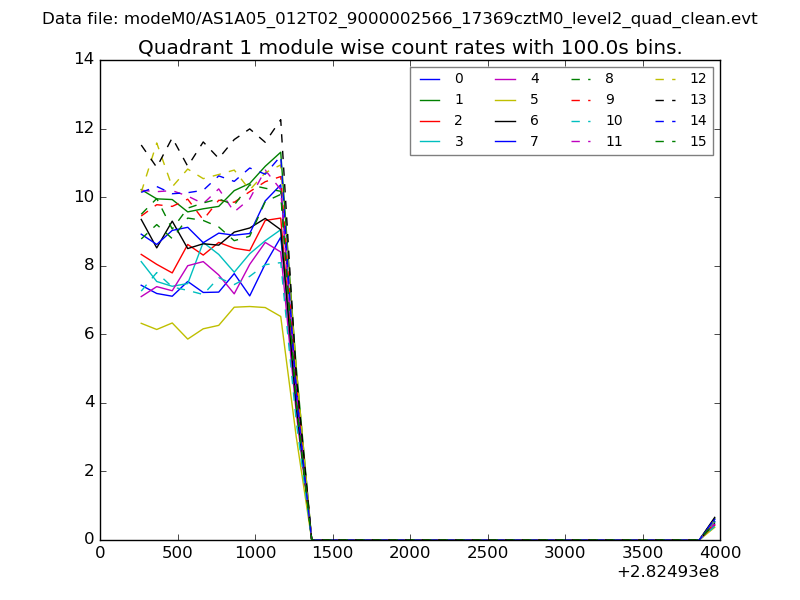 |
 |
| Module-wise count rates for Quadrant C Data is divided into 100 sec bins |
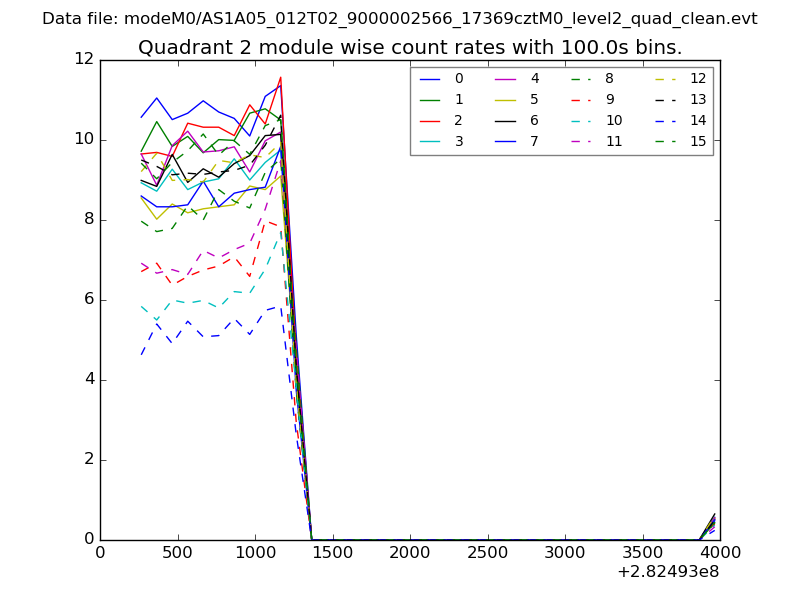 |
 |
| Module-wise count rates for Quadrant D Data is divided into 100 sec bins |
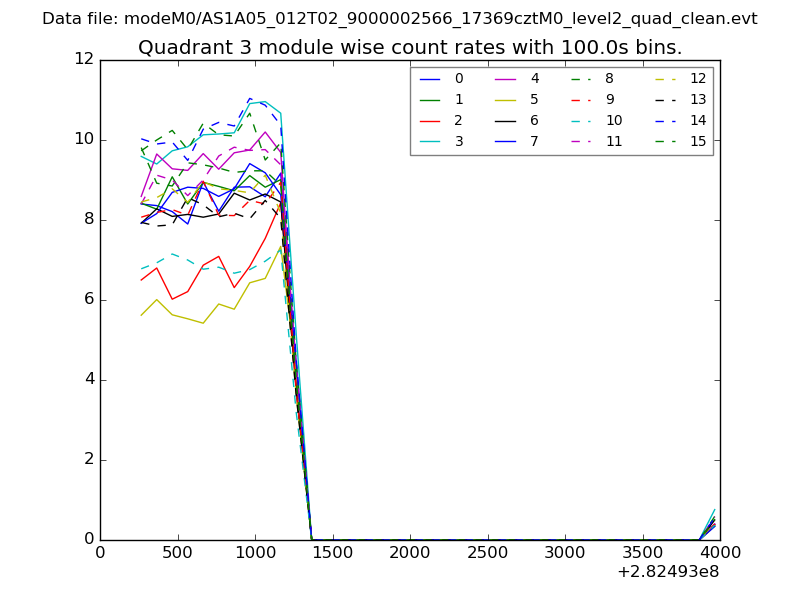 |
 |
| Parameter | Plot |
|---|---|
| CZT HV Monitor | 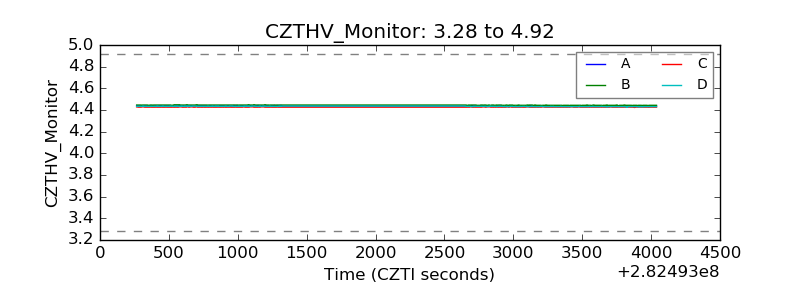 |
| D_VDD |  |
| Temperature 1 |  |
| Veto HV Monitor |  |
| Veto LLD |  |
| Alpha Counter | 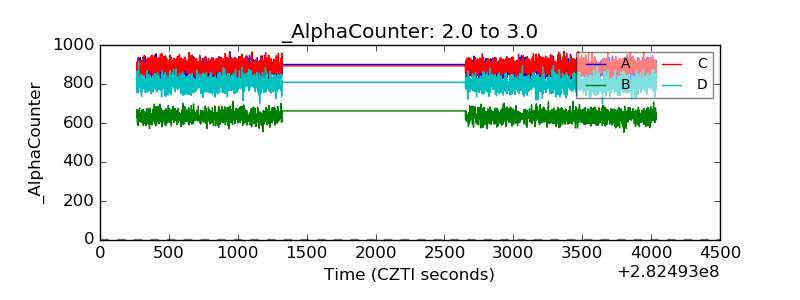 |
| _CPM_Rate | 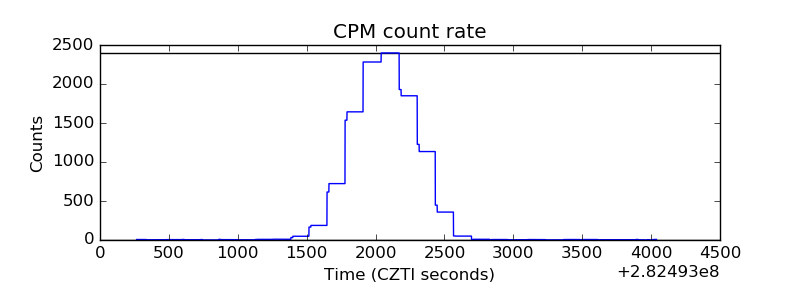 |
| CZT Counter |  |
| +2.5 Volts monitor |  |
| +5 Volts monitor |  |
| _ROLL_ROT | 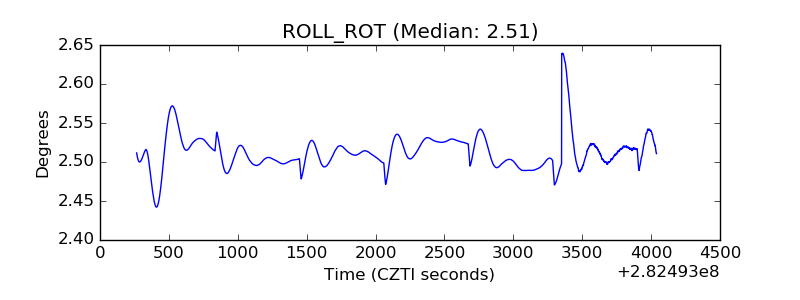 |
| _Roll_DEC | 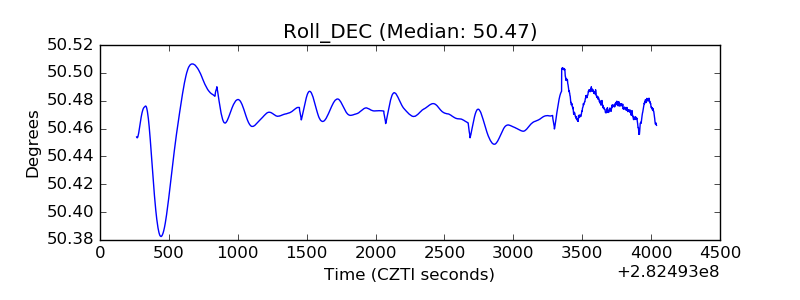 |
| _Roll_RA |  |
| Veto Counter | 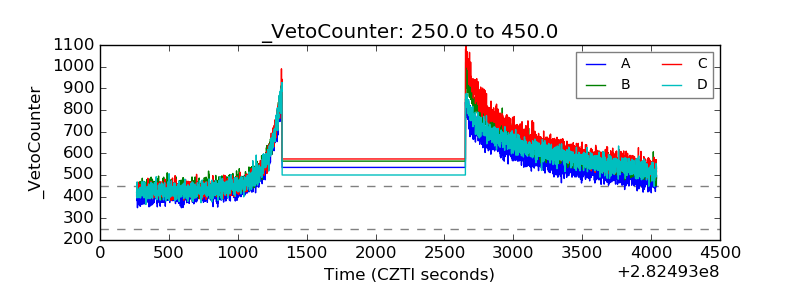 |